SlideShare a Scribd company logo
1 of 1
Download to read offline
Disability Prevalence by Age: 2010
55.8%
37.5%
29.6%
24.7%
20.4%
13.8%
7.3%
5.3%
4.2%
70.5%
53.6%
42.6%
35.0%
28.7%
19.7%
11.0%
10.2%
8.4%
80 and over
75 to 79
70 to 74
65 to 69
55 to 64
45 to 54
24 to 44
15 to 24
Under 15
Age
With a disability
Severe disability
6
Source: U.S. Census Bureau, Survey of Income and Program Participation, 2008 Panel, Adult and Child
Functional Limitations Topical Module

More Related Content

More from Adrienne Classen

Mental health care facts from the aap
Mental health care facts from the aapMental health care facts from the aap
Mental health care facts from the aapAdrienne Classen
 
Mental health care statistics
Mental health care statisticsMental health care statistics
Mental health care statisticsAdrienne Classen
 
Trends in child and overweight
Trends in child and overweightTrends in child and overweight
Trends in child and overweightAdrienne Classen
 
Afc prevalence 06_table6-1
Afc prevalence 06_table6-1Afc prevalence 06_table6-1
Afc prevalence 06_table6-1Adrienne Classen
 
Number of Children with Disabilities
Number of Children with DisabilitiesNumber of Children with Disabilities
Number of Children with DisabilitiesAdrienne Classen
 
Percentage of Children with Disabilities
Percentage of Children with DisabilitiesPercentage of Children with Disabilities
Percentage of Children with DisabilitiesAdrienne Classen
 
2011 Unemployment rates by County
2011 Unemployment rates by County2011 Unemployment rates by County
2011 Unemployment rates by CountyAdrienne Classen
 
Percent Population living in poverty
Percent Population living in povertyPercent Population living in poverty
Percent Population living in povertyAdrienne Classen
 
Number of Physicians in different specialties
Number of Physicians in different specialtiesNumber of Physicians in different specialties
Number of Physicians in different specialtiesAdrienne Classen
 
North Carolina unemployment 2009 to 2012
North Carolina unemployment 2009 to 2012North Carolina unemployment 2009 to 2012
North Carolina unemployment 2009 to 2012Adrienne Classen
 
NC Median Household Income
NC Median Household IncomeNC Median Household Income
NC Median Household IncomeAdrienne Classen
 
Counties receiving snap benefits
Counties receiving snap benefitsCounties receiving snap benefits
Counties receiving snap benefitsAdrienne Classen
 
Child and Adolescent Obesity
Child and Adolescent ObesityChild and Adolescent Obesity
Child and Adolescent ObesityAdrienne Classen
 

More from Adrienne Classen (20)

Mental health outcomes
Mental health outcomesMental health outcomes
Mental health outcomes
 
Mental health care facts from the aap
Mental health care facts from the aapMental health care facts from the aap
Mental health care facts from the aap
 
Mental health care statistics
Mental health care statisticsMental health care statistics
Mental health care statistics
 
Trends in child and overweight
Trends in child and overweightTrends in child and overweight
Trends in child and overweight
 
Afc prevalence 06_table9
Afc prevalence 06_table9Afc prevalence 06_table9
Afc prevalence 06_table9
 
Afc prevalence 06_table10
Afc prevalence 06_table10Afc prevalence 06_table10
Afc prevalence 06_table10
 
Afc prevalence 06_table8b
Afc prevalence 06_table8bAfc prevalence 06_table8b
Afc prevalence 06_table8b
 
Afc prevalence 06_table6-1
Afc prevalence 06_table6-1Afc prevalence 06_table6-1
Afc prevalence 06_table6-1
 
Afc prevalence 06_table13
Afc prevalence 06_table13Afc prevalence 06_table13
Afc prevalence 06_table13
 
Number of Children with Disabilities
Number of Children with DisabilitiesNumber of Children with Disabilities
Number of Children with Disabilities
 
Percentage of Children with Disabilities
Percentage of Children with DisabilitiesPercentage of Children with Disabilities
Percentage of Children with Disabilities
 
2011 Unemployment rates by County
2011 Unemployment rates by County2011 Unemployment rates by County
2011 Unemployment rates by County
 
Poverty Rate chart
Poverty Rate chartPoverty Rate chart
Poverty Rate chart
 
Percent Population living in poverty
Percent Population living in povertyPercent Population living in poverty
Percent Population living in poverty
 
Number of Physicians in different specialties
Number of Physicians in different specialtiesNumber of Physicians in different specialties
Number of Physicians in different specialties
 
North Carolina unemployment 2009 to 2012
North Carolina unemployment 2009 to 2012North Carolina unemployment 2009 to 2012
North Carolina unemployment 2009 to 2012
 
Manufacturing Employment
Manufacturing EmploymentManufacturing Employment
Manufacturing Employment
 
NC Median Household Income
NC Median Household IncomeNC Median Household Income
NC Median Household Income
 
Counties receiving snap benefits
Counties receiving snap benefitsCounties receiving snap benefits
Counties receiving snap benefits
 
Child and Adolescent Obesity
Child and Adolescent ObesityChild and Adolescent Obesity
Child and Adolescent Obesity
 

Disability Rates by Age Group 2010 Census Data

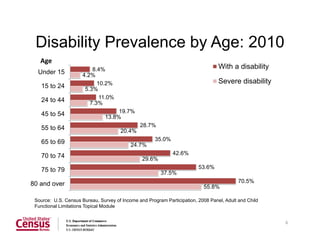
  • 1. Disability Prevalence by Age: 2010 55.8% 37.5% 29.6% 24.7% 20.4% 13.8% 7.3% 5.3% 4.2% 70.5% 53.6% 42.6% 35.0% 28.7% 19.7% 11.0% 10.2% 8.4% 80 and over 75 to 79 70 to 74 65 to 69 55 to 64 45 to 54 24 to 44 15 to 24 Under 15 Age With a disability Severe disability 6 Source: U.S. Census Bureau, Survey of Income and Program Participation, 2008 Panel, Adult and Child Functional Limitations Topical Module