1. Research Article
AJBBL http://www.ajbbl.com/ Volume 02 Issue 02 July 2013 1
Impact of salinity on above ground biomass and stored carbon
in a common mangrove Excoecaria agallocha of Indian
Sundarbans
Asit Kumar Bhattacharjee*, Sufia Zaman#* Atanu Kumar Raha#, Subhadra Devi
Gadi$, and Abhijit Mitra#*
#TECHNO INDIA UNIVERSITY, Salt Lake Campus, Kolkata 700 091. *Department of Marine Science, Calcutta
University, 35. B.C. Road, Kolkata 700 019. $Department of Zoology, Carmel College for Women, Nuven, Salcete,
Goa 403604
E-mail: sufia_zaman@yahoo.com, Tele Phone: +91 9830 501959
*Corresponding author
Published: July 01, 2013, Received: April 04, 2013
AJBBL 2012, Volume 02: Issue 02 Pages 01-11 Accepted: May 31, 2013
ABSTRACT
The above ground biomass (AGB) and carbon stock of Excoecaria agallocha (a
common mangrove plant species) were estimated in western and central
Indian Sundarbans for five successive years (2005 – 2010). The two sectors
are drastically different with respect to salinity on account of massive siltation
that prevents the flow of fresh water of the River Ganga to the central sector of
Indian Sundarbans. The biomass and carbon content of the above ground
structures (stem, branch and leaf) of the species vary significantly with
locality (p<0.01), the values being more in the high saline central sector on
account of higher stem biomass. The tolerance of Excoecaria agallocha to high
saline environment of lower Gangetic delta is confirmed.
INTRODUCTION
Mangroves are a taxonomically diverse
group of salt-tolerant, mainly arboreal, flowering
plants that grow primarily in tropical and
subtropical regions (Ellison and Stoddart 1991).
Salinity plays a crucial role in the growth and
survival of mangroves. Based on the physiological
studies, Bowman (1917) and Davis (1940)
concluded that mangroves are not salt lovers,
rather salt tolerant. However, excessive saline
conditions retard seed germination, impede growth
and development of mangroves. Indian
Sundarbans, the famous mangrove chunk of the
tropics is gradually losing a few mangroves species
(like Heritiera fomes, Nypa fruticans etc.) owing to
increase of salinity in the central sector of the
deltaic complex around the Matla River. Reports on
adverse impact of salinity on growth of mangroves
in Indian Sundarbans are available (Mitra et al.
2004). However no study has yet been carried out
to investigate the effect of salinity on the carbon
2. Research Article
AJBBL http://www.ajbbl.com/ Volume 02 Issue 02 July 2013 2
content of mangroves from this part of the Indian
subcontinent.
The present study aims to establish a
baseline data set of stored carbon in the AGB of
Excoecaria agallocha, a dominant mangrove species
of Indian Sundarbans. The species thrives
luxuriantly in a wide range of salinity (4 psu – 28
psu) and hence an attempt was also made to find
the AGB and carbon content in above ground
structures (stem, branches and leaves) of the
species with respect to ambient aquatic salinity.
MATERIALS AND METHODS
STUDY AREA:
The mighty River Ganga emerges from the
Himalayas and flows down to the Bay of Bengal
covering a distance of 2525 km. At the apex of Bay
of Bengal a delta has been formed which is
recognized as one of the most diversified and
productive ecosystems of the tropics and is
referred to as Indian Sundarbans. The deltaic
complex has a Biosphere Reserve area of 9630 sq.
km and houses 102 islands. The western sector of
the deltaic lobe receives the snowmelt water of
mighty Himalayan glaciers after being regulated
through several barrages on the way. The central
sector on the other hand, is fully deprived from
such supply due to heavy siltation and clogging of
the Bidyadhari channel in the late 15th century
(Chaudhuri and Choudhury 1994). Such variation
cause sharp difference in salinity between the two
sectors (Mitra et al. 2009). Two sampling sites were
selected each in the western and central sectors of
this lower Gangetic delta (Fig.1). The station in the
western part lies at the confluence of the River
Hugli (a continuation of Ganga-Bhagirathi system)
and Bay of Bengal. The site is locally known as
Sagar South (88° 01' 47.28" E Latitude and 21° 31'
4.68" N Longitude). In the central sector, the
sampling station was selected at Canning (88° 40'
36.84" E Latitude and 22° 18' 37.44" N Longitude),
near to tide fed Matla River. Study was undertaken
in both these sectors during low tide period
through three seasons viz. premonsoon (March),
monsoon (September) and postmonsoon
(December) for five consecutive years (2005 –
2010).
In each sector, plot size of 10m × 10m was
selected and the average readings were
documented from 15 such plots. The mean relative
density of Excoecaria agallocha was evaluated for
relative abundance of the species.
ABOVE - GROUND STEM BIOMASS ESTIMATION
The stem volume for each tree of the
species in every plot was estimated using the
Newton’s formula (Husch et al. 1982) as per the
expression: V = h/6 (Ab + 4Am + At) where, V is the
volume (in m3), h the height measured with laser
beam (BOSCH DLE 70 Professional model), and Ab,
Am, and At are the areas of the selected tree at base,
middle and top respectively. Specific gravity (G) of
the wood was estimated taking the stem cores from
5 to 10 cm depth with a motorized corer, which
was further converted into stem biomass (BS) as
per the expression BS = GV. The stem biomass of
individual tree was finally multiplied with the
number of trees of the species in 15 selected plots
in both western and central Indian Sundarbans.
ABOVE GROUND BRANCH BIOMASS ESTIMATION
The total number of branches irrespective of
size was counted on each of the sample trees. These
branches were categorized on the basis of basal
diameter into three groups, viz. <6 cm, 6–10 cm and
>10 cm. Dry weight of two branches from each size
group was recorded separately using the equation of
Chidumaya (1990). Total branch biomass (dry
3. Research Article
AJBBL http://www.ajbbl.com/ Volume 02 Issue 02 July 2013 3
weight) of individual tree was determined after
drying at 80 ± 50C as per the expression: Bdb = n1bw1
+ n2bw2 + n3bw3 = Σ nibwi
Where, Bdb is the dry branch biomass per tree, ni the
number of branches in the ith branch group, bwi the
average weight of branches in the ith group and i = 1,
2, 3, …..n are the branch groups. The branch biomass
of individual tree was finally multiplied with the
number of trees of the species in all the 15 plots for
each station.
ABOVE GROUND LEAF BIOMASS ESTIMATION
Leaves from nine branches (three of each size
group) of individual trees were plucked, weighed and
oven dried separately to a constant weight at 80 ±
50C. Three trees per plot were considered for
estimation. The leaf biomass was then estimated by
multiplying the average biomass of the leaves per
branch with the number of branches in a single tree
and the average number of trees per plot as per the
expression: Ldb = n1Lw1N1 + n2Lw2N2 + ……….niLwiNi
Where, Ldb is the dry leaf biomass of selected
mangrove species per plot, n1..….ni are the number of
branches of each tree of the species, Lw1 …….Lwi are
the average dry weight of leaves removed from the
branches and N1………Ni are the number of trees of the
species in the plots.
CARBON ESTIMATION
Direct estimation of percent carbon was done
by a CHN analyzer. For this, a portion of fresh sample
of stem, branch and leaf from thirty trees (two trees/
plot) of the species (covering all the 15 plots) was
collected. The vegetative parts were oven dried
separately at 700C and ground to pass through a 0.5
mm screen (1.0 mm screen for leaves). The carbon
content (in %) was finally analyzed on a Vario MACRO
elementar CHN analyzer.
SALINITY
The surface water salinity was recorded by
means of an optical refractometer (Atago, Japan) in
the field and cross-checked in laboratory by
employing Mohr- Knudsen method. The correction
factor was found out by titrating the silver nitrate
solution against standard seawater (IAPO standard
seawater service Charlottenlund, Slot Denmark,
chlorinity = 19.376‰). Our method was applied to
estimate the salinity of standard seawater procured
from NIO and a standard deviation of 0.02% was
obtained for salinity. The average accuracy for
salinity (in connection to our triplicate sampling) is ±
0.28 psu.
STATISTICAL ANALYSIS
Scatterplots, allometric equations and
correlations were computed with a sample size of
240 for each sector to observe the interrelationships
between AGB, DBH, stem, branch and leaf biomass
along with stored carbon in these above ground
structures. Analysis of variance (ANOVA) was
performed to assess whether biomass and carbon
content varied significantly between sites, years and
seasons; possibilities less than 0.01 (p < 0.01) were
considered statistically significant. All statistical
calculations were performed with SPSS 9.0 for
Windows.
RESULTS
RELATIVE ABUNDANCE
Nine species of mangroves were documented
in the selected plots in the western sector, but in the
central sector only six species were recorded. The
mean relative abundance of Excoecaria agallocha was
18.75% and 25.81% in the western and central
sectors respectively. In both the sectors, the trees are
~12 years old, but high salinity in the central sector
probably stunted the growth of the species.
4. Research Article
AJBBL http://www.ajbbl.com/ Volume 02 Issue 02 July 2013 4
ABOVE GROUND BIOMASS
The stem, branch, leaf and AGB of the
mangrove species increased with age. The increment
was however not uniform in both the sectors as
revealed from the trend line equations (Fig. 2 - 5). We
observed significant variation in the rate of AGB
increase between sites (p<0.01). It was
0.63t/ha/month and 0.75 t/ha/month in the western
and central sectors respectively. The yearly variation
of AGB was also significant (p<0.01), but the seasonal
variation was not pronounced. It is interesting to
note that AGB of Excoecaria agallocha in the Indian
Sundarbans is accounted solely due to stem, which is
a basic indicator of growth unlike branches and
leaves that contribute substantially to litter fall and
less to permanent biomass. The nature of the scatter
plots also confirm strong dependency of AGB on stem
biomass and DBH unlike branch and leaf biomass
that exhibit no relationships with AGB of the species
(Fig. 6 -11).
CARBON CONTENT
The seasonal variations of stored carbon in
the above ground structures of the species for five
successive years are shown in Fig. 12 to 15. In both
the sectors carbon content was highest in stems,
followed by branches and leaves. In stem the carbon
content ranged from 0.81 t/ha (in the central sector
during September, 2005) to 10.13 t/ha (in the central
sector during March, 2010), which are 40.5% and
42.0% of the biomass respectively. The sequestration
rates of carbon in the stem of the western and central
sectors are significantly different (p<0.01) with
values of 0.10 t/ha/month and 0.17 t/ha/month
respectively. In branch the range of stored carbon
was 0.22 t/ha (39.2% of the branch biomass in the
central sector during September, 2005) to 6.40 t/ha
(42.2% of the branch biomass in the western sector
during March, 2010). The branch sequestered 0.10
t/ha/month and 0.09 t/ha/month in the western and
central sectors respectively. In leaf minimum carbon
content (0.22 t/ha which is equivalent to 43.1% of
leaf biomass) was observed in the central sector in
September, 2005 and the maximum value (4.74 t/ha
which is equivalent to 46.4% of leaf biomass) was
recorded in the western sector in March, 2010. The
sequestration rates are 0.08 t/ha/month and 0.06
t/ha/month in the western and central sectors
respectively.
ANOVA results confirmed significant
differences in stored carbon of the stem between the
sites (p < 0.01), but no differences were observed for
branches and leaves. The carbon content in the above
ground structures exhibit significant positive
correlations with stem biomass and its DBH, but not
with branch and leaf biomass.
SALINITY
The surface water salinity values ranged from
8.66 psu (at Sagar south in the western sector during
2010 monsoon) to 26.59 psu (at Canning in the
central sector during 2008 premonsoon). The salinity
values varied as per the order premonsoon >
postmonsoon > monsoon and the seasonal variation
is significant (p < 0.01). The salinity values were
significantly higher (p<0.01) in the central sector
compared to the western sector irrespective of
seasons and year (Table 1).
5. Table 1. Seasonal variation of surface water salinity (in psu) in the selected stations during 2005 -
2010
Season 2005 2006 2007 2008 2009 2010
A B A B A B A B A B A B
Pre
monsoon
- 26.10 26.50 25.12 26.00 29.11 26.59 24.04 26.08 23.58 25.95
Monsoon 9.16 10.44 9.02 9.65 9.30 9.98 8.76 9.90 9.08 10.02 8.66 10.13
Post
monsoon
22.32 23.10 21.67 23.15 21.80 23.88 20.73 24.06 20.04 24.32 20.12 25.02
A - Sagar south (Western sector) and B – Canning (Central sector)
Table 2. Data on AGB in few mixed mangrove forests
Region Location Condition or age AGB (t/ha) Reference
Sri Lanka 8° 15' N Latitude and
79° 50'E Longitude
Fringe forest 172.0 Amarasinghe and
Balasubramaniam (1992)
Sri Lanka 8° 15' N Latitude and
79° 50'E Longitude
Riverine forest 57.0 Amarasinghe and
Balasubramaniam (1992)
Thailand (Trat Eastern) 12° 12' N Latitude
and 102° 33'E
Longitude
Secondary forest 142.2 Poungpam (2003)
Western Indian
Sundarbans (Sagar
South)
88° 01' 47.28" N
Latitude and 21° 31'
4.68" E Longitude
~ 12 years 15.14 This study, considering
only 1 species (n = 225)
Central Indian
Sundarbans (Canning)
88° 40' 36.84" N
Latitude and 22° 18'
37.44" E Longitude
~ 12 years 26.52 This study, considering
only 1 species (n = 225)
6. Research Article
AJBBL http://www.ajbbl.com/ Volume 02 Issue 02 July 2013 6
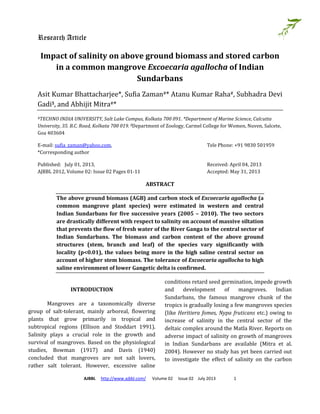
Fig.1. Location of sampling stations in the western and central sectors of Indian Sundarbans
Sagar South
Canning
7. Research Article
AJBBL http://www.ajbbl.com/ Volume 02 Issue 02 July 2013 7
Fig. 2. Stem biomass of Excoecaria agallocha
y = 1.53x - 1.2507
R2
= 0.9474
y = 0.8396x + 6.0925
R2
= 0.9546
0
5
10
15
20
25
30
Sept.,2005
Dec.,2005
Mar.,2006
Sept.,2006
Dec.,2006
Mar.,2007
Sept.,2007
Dec.,2007
Mar.,2008
Sept.,2008
Dec.,2008
Mar.,2009
Sept.,2009
Dec.,2009
Mar.,2010
Stembiomass(t/h
Western
Central
Fig. 3. Branch biomass of Excoecaria agallocha
y = 0.9145x + 1.497
R2
= 0.992
y = 0.9016x - 1.7879
R2
= 0.9656
-2
0
2
4
6
8
10
12
14
16
18
Sept.,2005
Dec.,2005
Mar.,2006
Sept.,2006
Dec.,2006
Mar.,2007
Sept.,2007
Dec.,2007
Mar.,2008
Sept.,2008
Dec.,2008
Mar.,2009
Sept.,2009
Dec.,2009
Mar.,2010
Branchbiomass(t/
Western
Central
Fig. 4. Leaf biomass of Excoecaria agallocha
y = 0.6404x + 0.2699
R2
= 0.9914
y = 0.56x - 1.151
R2
= 0.936
-2
0
2
4
6
8
10
12
Sept.,2005
Dec.,2005
Mar.,2006
Sept.,2006
Dec.,2006
Mar.,2007
Sept.,2007
Dec.,2007
Mar.,2008
Sept.,2008
Dec.,2008
Mar.,2009
Sept.,2009
Dec.,2009
Mar.,2010
Leafbiomass(t/h
Western
Central
Fig. 5. AGB of Excoecara agallocha
y = 2.3881x + 7.9308
R2
= 0.9933
y = 2.9901x - 4.1249
R2
= 0.9549
-10
0
10
20
30
40
50
Sept.,2005
Dec.,2005
Mar.,2006
Sept.,2006
Dec.,2006
Mar.,2007
Sept.,2007
Dec.,2007
Mar.,2008
Sept.,2008
Dec.,2008
Mar.,2009
Sept.,2009
Dec.,2009
Mar.,2010
AGB(t/ha
Western
Central
Fig. 6. Relationship between stem biomass and AGB of
Excoecaria agallocha in western sector
y = 0.8446x + 12.514
R2
= 0.6761
0.00
5.00
10.00
15.00
20.00
25.00
30.00
35.00
0.00 5.00 10.00 15.00 20.00 25.00
Stem Biomass (Kg)
AGB(Kg
Fig. 7. Relationship between stem biomass and AGB of
Excoecaria agallocha in central sector
y = 1.0283x + 5.4284
R2
= 0.7426
0.00
5.00
10.00
15.00
20.00
25.00
0 2 4 6 8 10 12 14 16
Stem biomass (Kg)
AGB(Kg
8. Research Article
AJBBL http://www.ajbbl.com/ Volume 02 Issue 02 July 2013 8
Fig. 8. Relationship between branch biomass and AGB of
Excoecaria agallocha in western sector
y = 0.8807x + 20.83
R2
= 0.1131
0.00
5.00
10.00
15.00
20.00
25.00
30.00
35.00
0.00 2.00 4.00 6.00 8.00 10.00
Branch Biomass (Kg)
AGB(Kg
Fig. 9. Relationship between branch bioamss and AGB of
Excoecaria agallocha in central sector
y = 1.6631x + 8.9866
R2
= 0.3011
0.00
5.00
10.00
15.00
20.00
25.00
0.00 1.00 2.00 3.00 4.00 5.00 6.00
Branch Biomass (Kg)
AGB(Kg
Fig. 10. Relationship between leaf biomass and AGB of
Excoecaria agallocha in western sector
y = 1.5126x + 21.255
R2
= 0.1075
0.00
5.00
10.00
15.00
20.00
25.00
30.00
35.00
0.00 1.00 2.00 3.00 4.00 5.00 6.00
Leaf Biomass (Kg)
AGB(Kg
Fig. 11. Relationship between leaf biomass and AGB of
Excoecaria agallocha in central sector
y = 2.8266x + 9.4954
R2
= 0.2738
0.00
5.00
10.00
15.00
20.00
25.00
0.00 0.50 1.00 1.50 2.00 2.50 3.00 3.50
Leaf Biomass (Kg)
AGB(Kg
Fig. 12. Carbon content in Excoecaria agallocha stem
y = 0.3752x + 2.577
R2
= 0.9391
y = 0.6478x - 0.533
R2
= 0.952
0
2
4
6
8
10
12
Sept.,2005
Dec.,2005
Mar.,2006
Sept.,2006
Dec.,2006
Mar.,2007
Sept.,2007
Dec.,2007
Mar.,2008
Sept.,2008
Dec.,2008
Mar.,2009
Sept.,2009
Dec.,2009
Mar.,2010
Carboncontent(t/h
Western
Central
Fig. 13. Carbon content in Excoecaria agallocha branch
y = 0.3804x + 0.6025
R2
= 0.9879
y = 0.3703x - 0.7356
R2
= 0.9673
-1
0
1
2
3
4
5
6
7
Sept.,2005
Dec.,2005
Mar.,2006
Sept.,2006
Dec.,2006
Mar.,2007
Sept.,2007
Dec.,2007
Mar.,2008
Sept.,2008
Dec.,2008
Mar.,2009
Sept.,2009
Dec.,2009
Mar.,2010
Carboncontent(t/h
Western
Central
9. Research Article
AJBBL http://www.ajbbl.com/ Volume 02 Issue 02 July 2013 9
Fig. 14. Carbon content in Excoecaria agallocha leaf
y = 0.2885x + 0.1203
R2
= 0.9802
y = 0.2518x - 0.5292
R2
= 0.9347
-1
0
1
2
3
4
5
Sept.,2005
Dec.,2005
Mar.,2006
Sept.,2006
Dec.,2006
Mar.,2007
Sept.,2007
Dec.,2007
Mar.,2008
Sept.,2008
Dec.,2008
Mar.,2009
Sept.,2009
Dec.,2009
Mar.,2010
Carboncontent(t/h
Western
Central
Fig. 15. Carbon content in AGB of Excoecaria agallocha
y = 1.0534x + 3.0511
R2
= 0.9623
y = 1.2692x - 1.7874
R2
= 0.9582
-5
0
5
10
15
20
25
Sept.,2005
Dec.,2005
Mar.,2006
Sept.,2006
Dec.,2006
Mar.,2007
Sept.,2007
Dec.,2007
Mar.,2008
Sept.,2008
Dec.,2008
Mar.,2009
Sept.,2009
Dec.,2009
Mar.,2010
Carboncontent(t/h
Western
Central
DISCUSSION
The potential impact of mangrove on
coastal zone carbon dynamics has been a topic of
intense debate during the past decades. Despite the
large number of case studies dealing with various
aspects of organic matter cycling in mangrove
systems (Kristensen et al. 2008), there is very limited
consensus on the carbon sequestering potential of
mangroves. It has been opined by several workers
that the carbon sequestration in this unique producer
community is a function of biomass production
capacity, which in turn depends upon interaction
between edaphic, climate, and topographic factors of
an area (Chaudhuri and Choudhury, 1994; Mitra and
Banerjee, 2005). Hence, results obtained at one place
may not be applicable to another. We therefore
attempted to establish allometric equations for
Excoecaria agallocha of Indian Sundarbans relating
its DBH, stem biomass, branch biomass, leaf biomass,
AGB and stored carbon. The nature of the scatter
plots indicate significant positive correlations
between AGB, stem biomass, DBH and stored carbon
in both the sectors. The AGB and stored carbon do
not exhibit any dependency on branch and leaf
biomass of the species. This indicates the sole
contribution of stem biomass and DBH to AGB and
carbon stored in the above ground structures.
Mangroves, in general, prefer brackish
water environment and in extreme saline condition
stunted growth is observed (Mitra et al. 2004). The
present study, however, presents a different picture
and reveals the adaptation of Excoecaria agallocha in
the high saline central sector. The relatively higher
growth rate of the above ground structures of the
species in the central sector (0.75 t/ha/month)
compared to the western part (0.63t/ha/month)
confirms its tolerance to salinity. A critical analysis of
biochemical mechanisms may throw light on the
adaptation of Excoecaria agallocha in the high saline
environment of central Indian Sundarbans.
The carbon content and sequestration rate
of above ground structures are also higher in the
central sector as a direct function of above ground
biomass. During our study period the average surface
water salinity in the central Indian Sundarbans were
relatively higher (26.22 psu during premonsoon,
10.02 psu during monsoon and 23.70 during
postmonsoon) compared to the western part (25.59
psu during premonsoon, 9.00 psu during monsoon
and 21.31 during postmonsoon). This could not
retard the carbon sequestration of the species (by the
total AGB) as evidenced from the stored carbon value
10. Research Article
AJBBL http://www.ajbbl.com/ Volume 02 Issue 02 July 2013 10
and sequestration rate in the central sector (0.32
t/ha/month) compared to the western sector (0.28
t/ha/month). The results of our study have been
compared with the AGB of few mixed mangrove
forests (Table 2) to evaluate the potential of Indian
Sundarbans mangrove as carbon sink. The values of
the present study are less when compared with other
regions, but efficient adaptation of the species in high
saline zone has multiplied the importance of the
species as the present geographical locale is
vulnerable to climate change induced salinity rise
owing to its location below the mean sea level and
experiencing a sea level rise of 3.14 mm/yr as
compared to global average of 2.5 mm/yr.
CONCLUSION
Indian Sundarbans is ecologically dynamic
with contrasting salinity in western and central
sectors. The western sector is hyposaline as the area
receives the freshwater of River Ganga. The central
sector has no head-on discharge and therefore the
environment is hypersaline in nature. The
comparatively more biomass and carbon content in
the Excoecaria agallocha sampled from central Indian
Sundarbans suggests the adaptive efficiency of the
species to high saline condition. Considering the
present state of sea level rise in the deltaic complex
of Indian Sundarbans it can be concluded that
Excoecaria agallocha can cope and survive better in
the matrix of rising salinity.
ACKNOWLEDGEMENT:
The financial assistance from the TECHNO
INDIA UNIVERSITY, Salt Lake Campus, Kolkata is
gratefully acknowledged. The authors are also
grateful to the Forest Department, Govt. of West
Bengal for assisting the research team in collecting
data and providing all infrastructural facilities to
reach the remote islands.
REFERENCES
1.Bowman (1917) Mangrove regeneration and management. In: AKF Hoque 1995. Mimeograph.
2.Chidumaya, E.N., 1990. Above ground woody biomass structure and productivity in a Zambezian woodland. For.
Ecol. Manage. 36, 33-46.
3.Chaudhuri, A.B., Choudhury, A., 1994. Mangroves of the Sundarbans. India, IUCN- The World Conservation
Union, 1.
4.Davis JH (1940) The Ecology and Geological Role of Mangroves in Florida. Pap Tortugas Lab 32: 303-412.
5.Ellison JC and Stoddart DR (1991) Mangrove ecosystem collapse during predicted sea-level rise: Holocene
analogues and implications. Journal of Coastal Research 7: 151-165.
6.Husch, B., Miller, C.J. Beers, T.W., 1982. Forest mensuration, Ronald Press, New York.
7.Kristensen, E., Bouillon, S., Dittmar, T., Marchand, C., 2008. Organic matter dynamics in mangrove ecosystems.
Aqua. Bot. J Aqua. Bot. 2007 15.05 (in press).
11. Research Article
AJBBL http://www.ajbbl.com/ Volume 02 Issue 02 July 2013 11
8.Mitra, A., Banerjee, K., 2005. In: Living Resources of the Sea: Focus Indian Sundarbans, Published by WWF India.
(Ed: Col S.R. Banerjee ), Canning Field Office, 24 Parganas (S), W.B. 96 pp.
9.Mitra, A., Banerjee, K., Bhattacharyya, D.P., 2004. In The Other Face of Mangroves. Published by Department of
Environment, Govt. of West Bengal, India.
10. Mitra, A., Banerjee, K., Sengupta, K., Gangopadhyay, A., 2009. Pulse of climate change in Indian Sundarbans: A
myth or reality? Natl. Acad. Sci. Lett. 32, 1-2.