Download to read offline
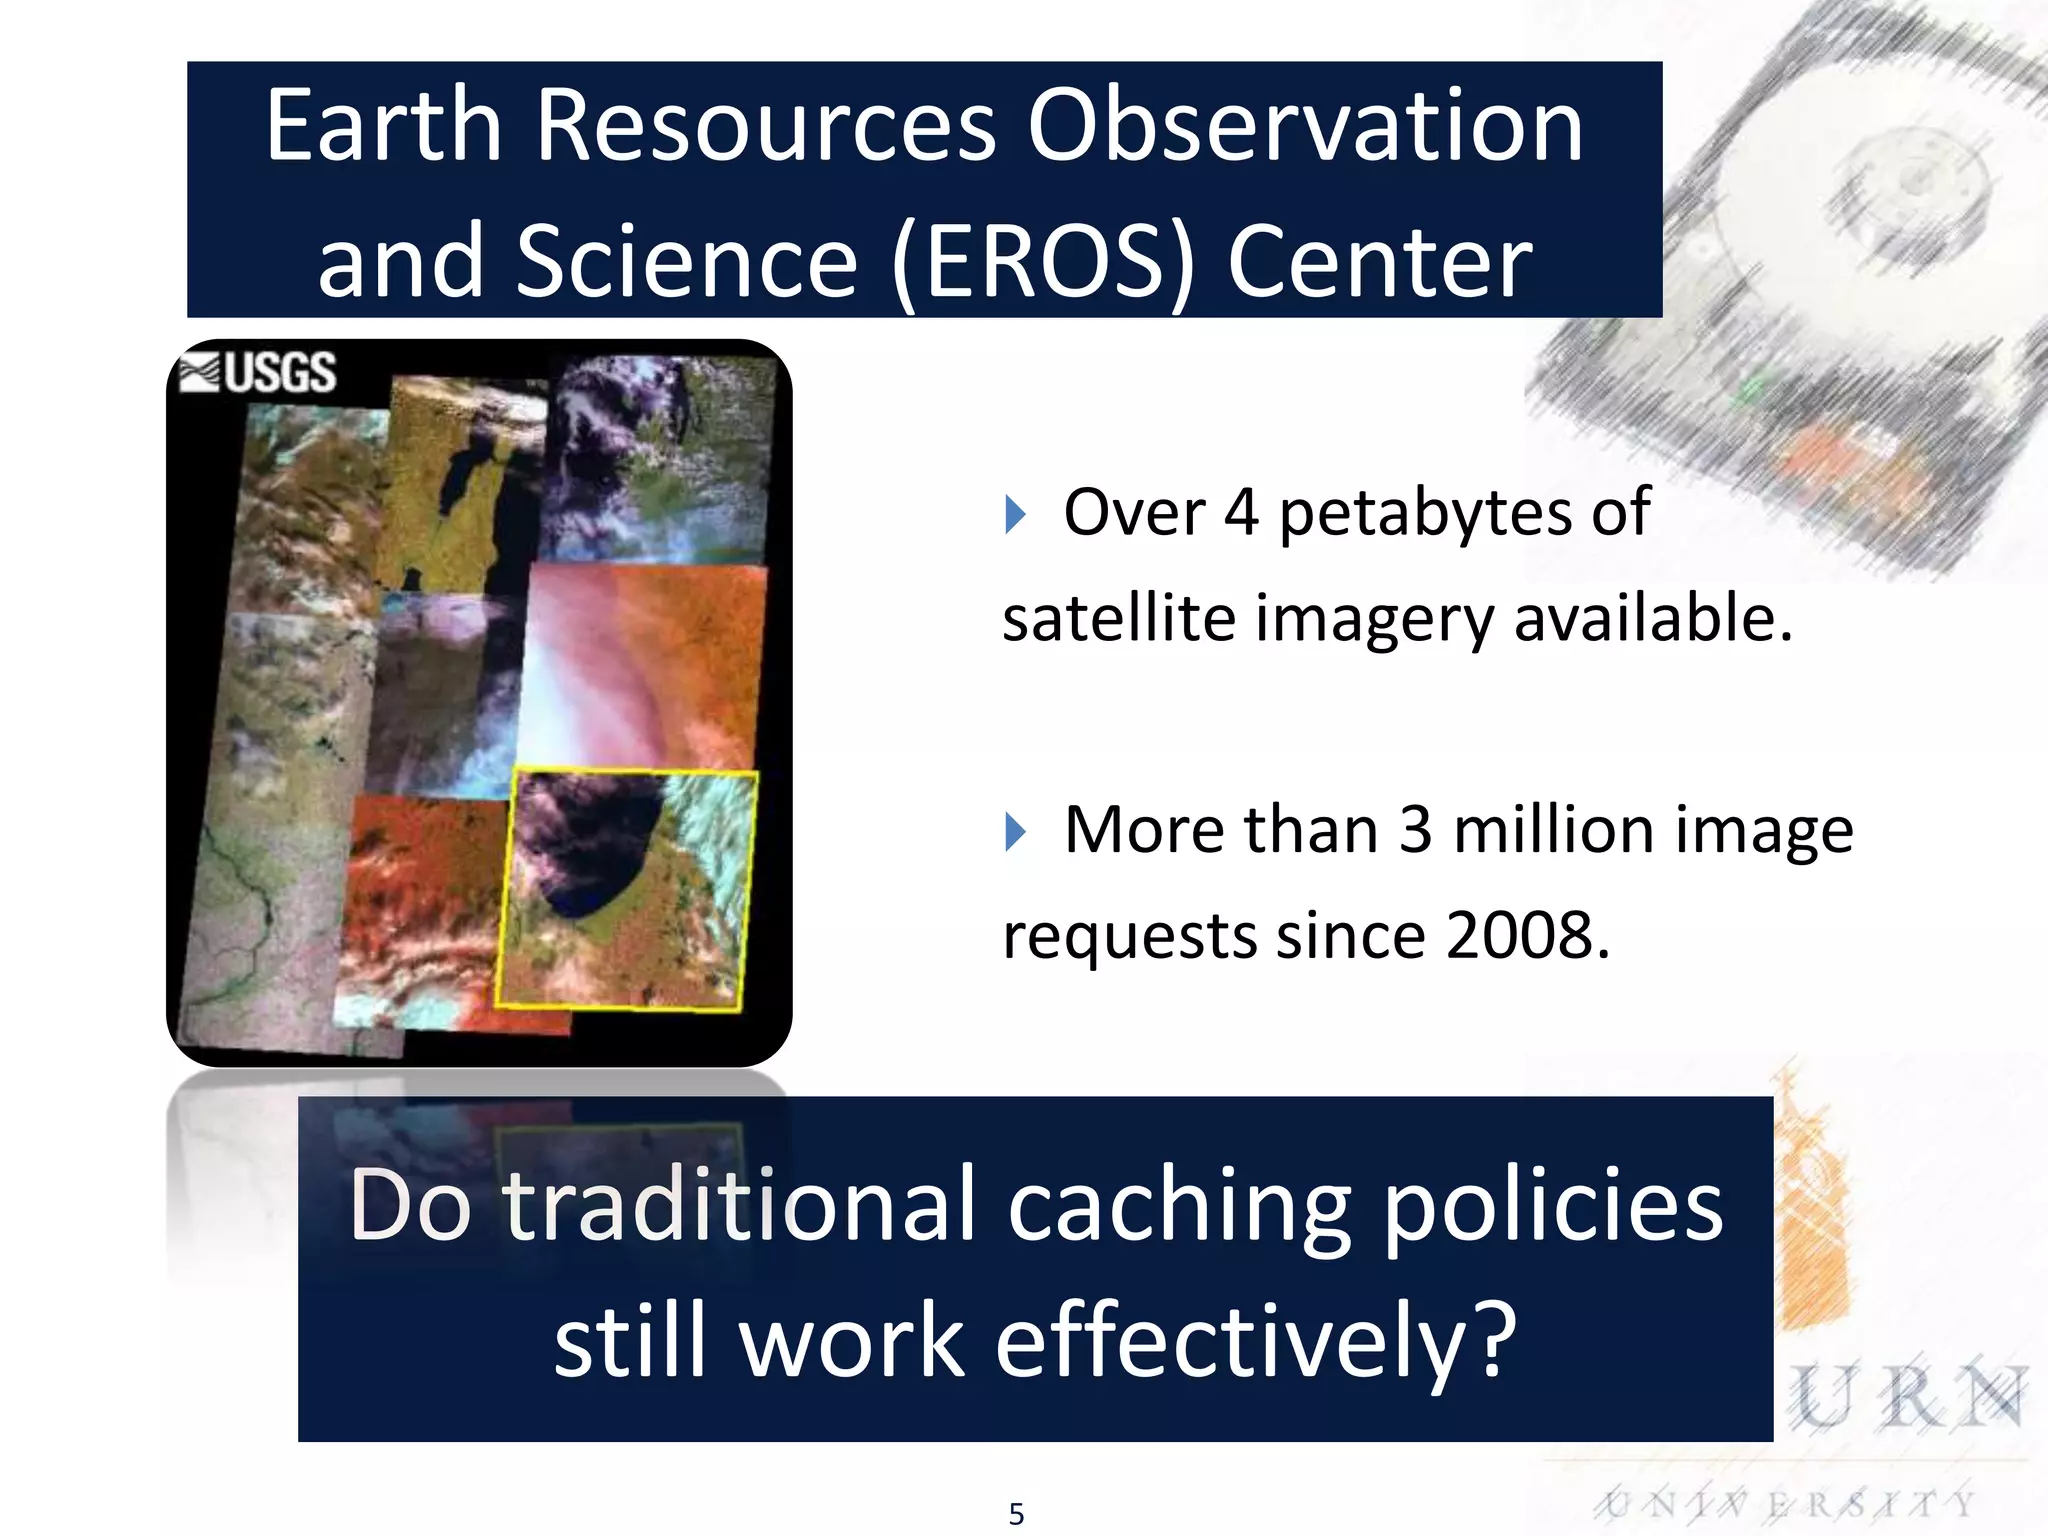
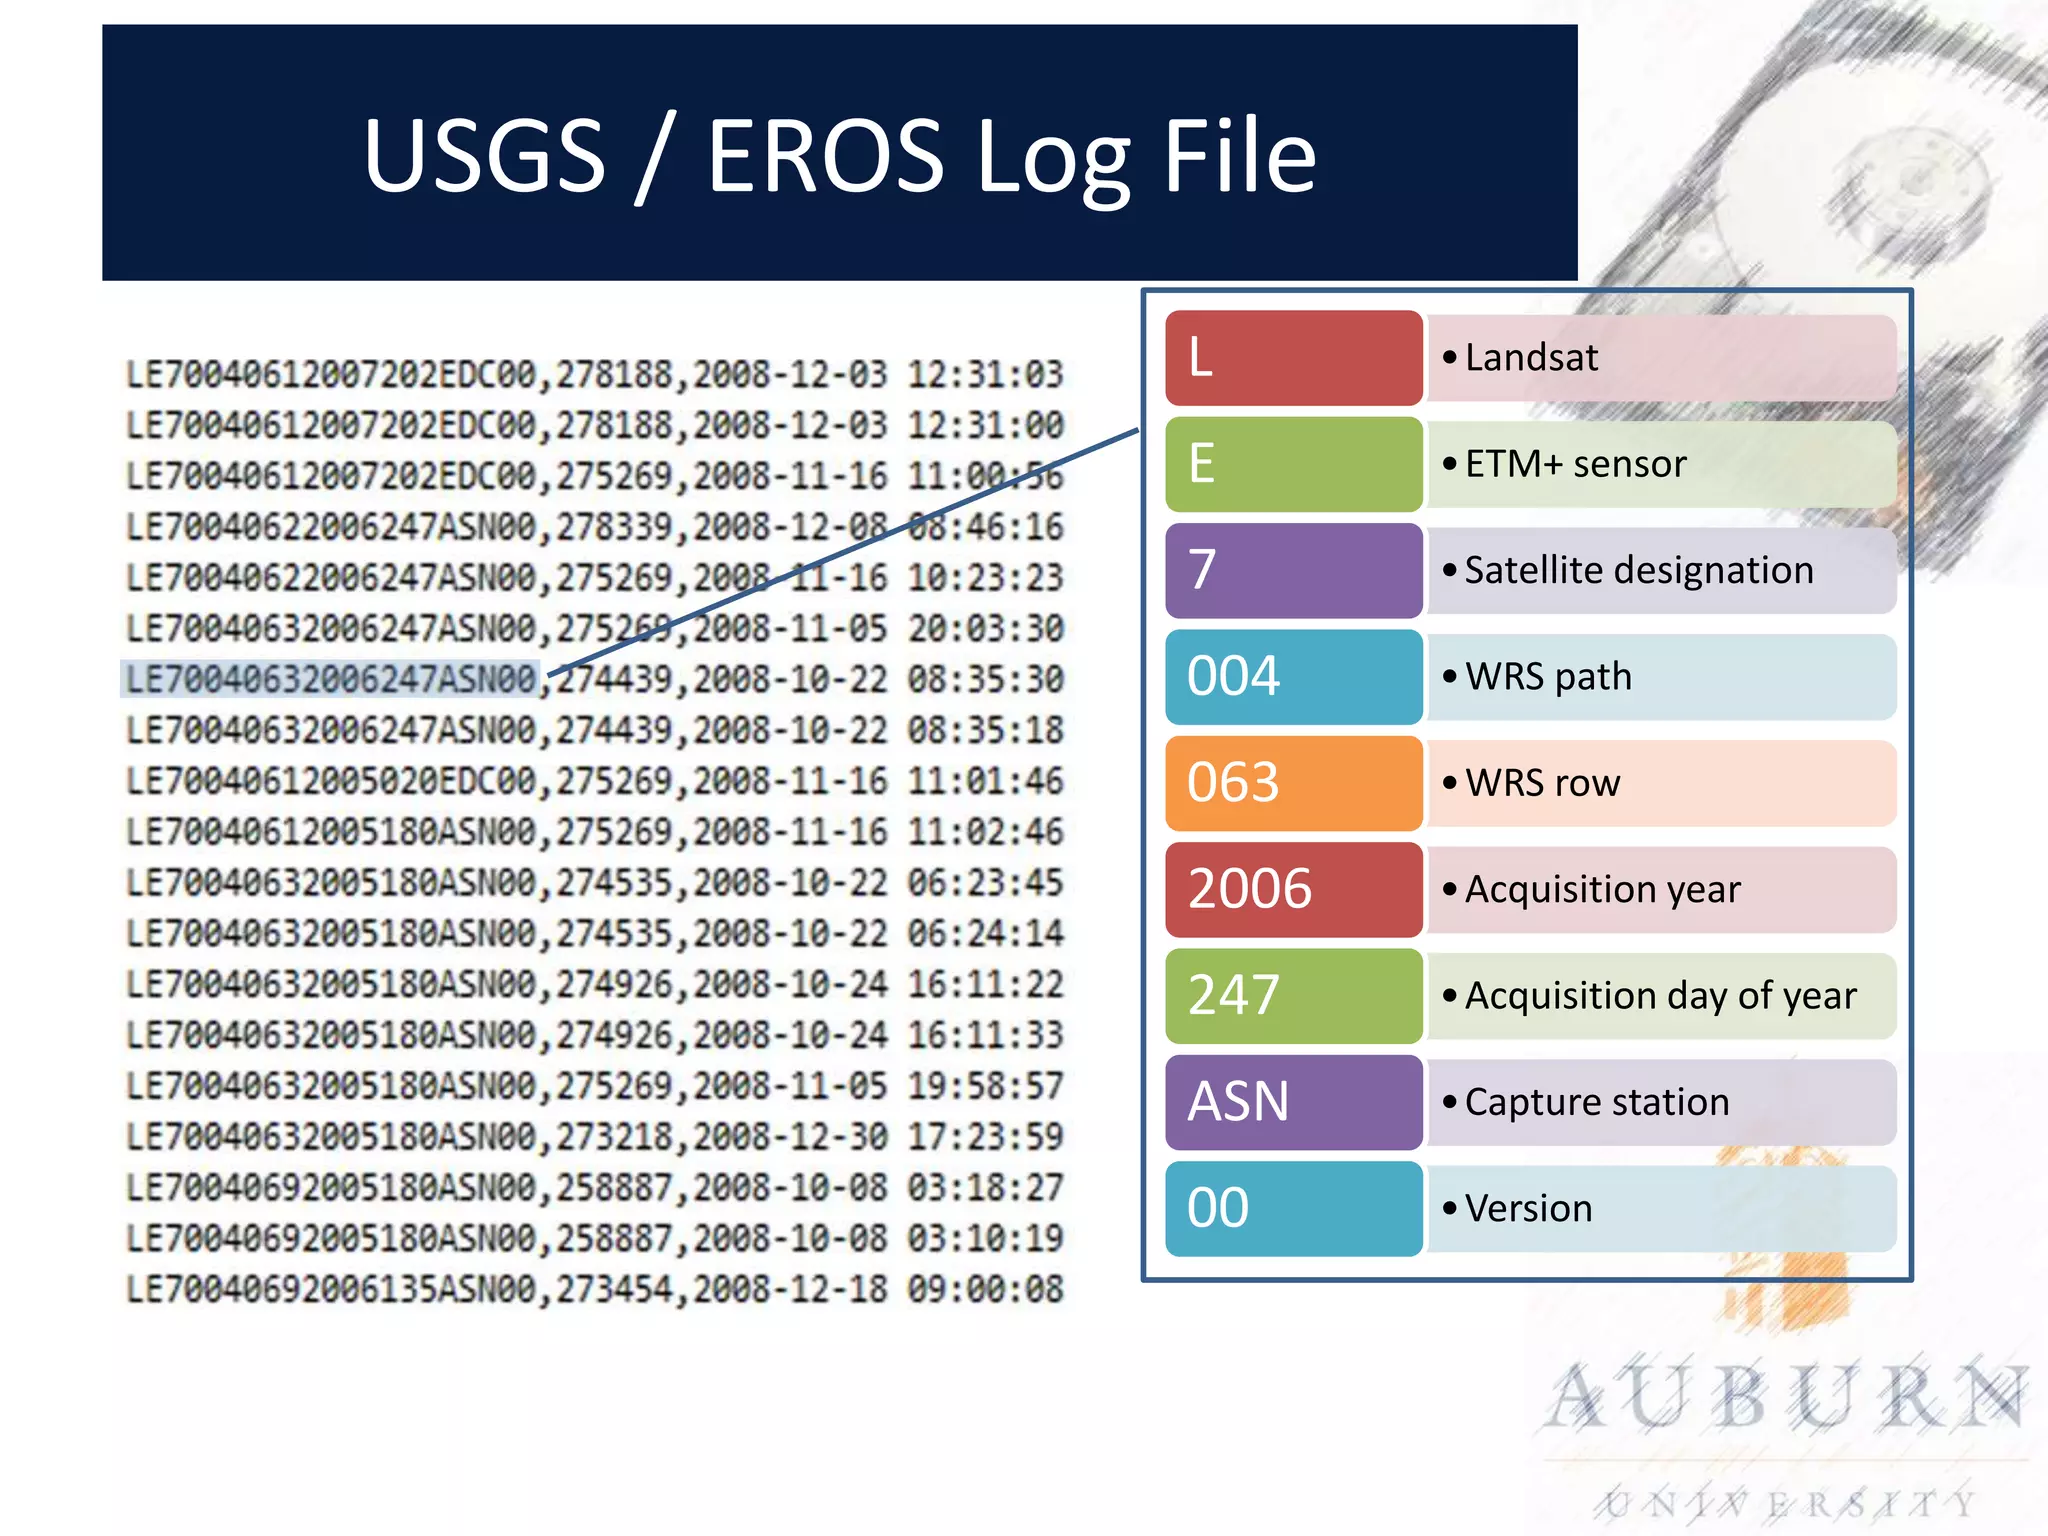
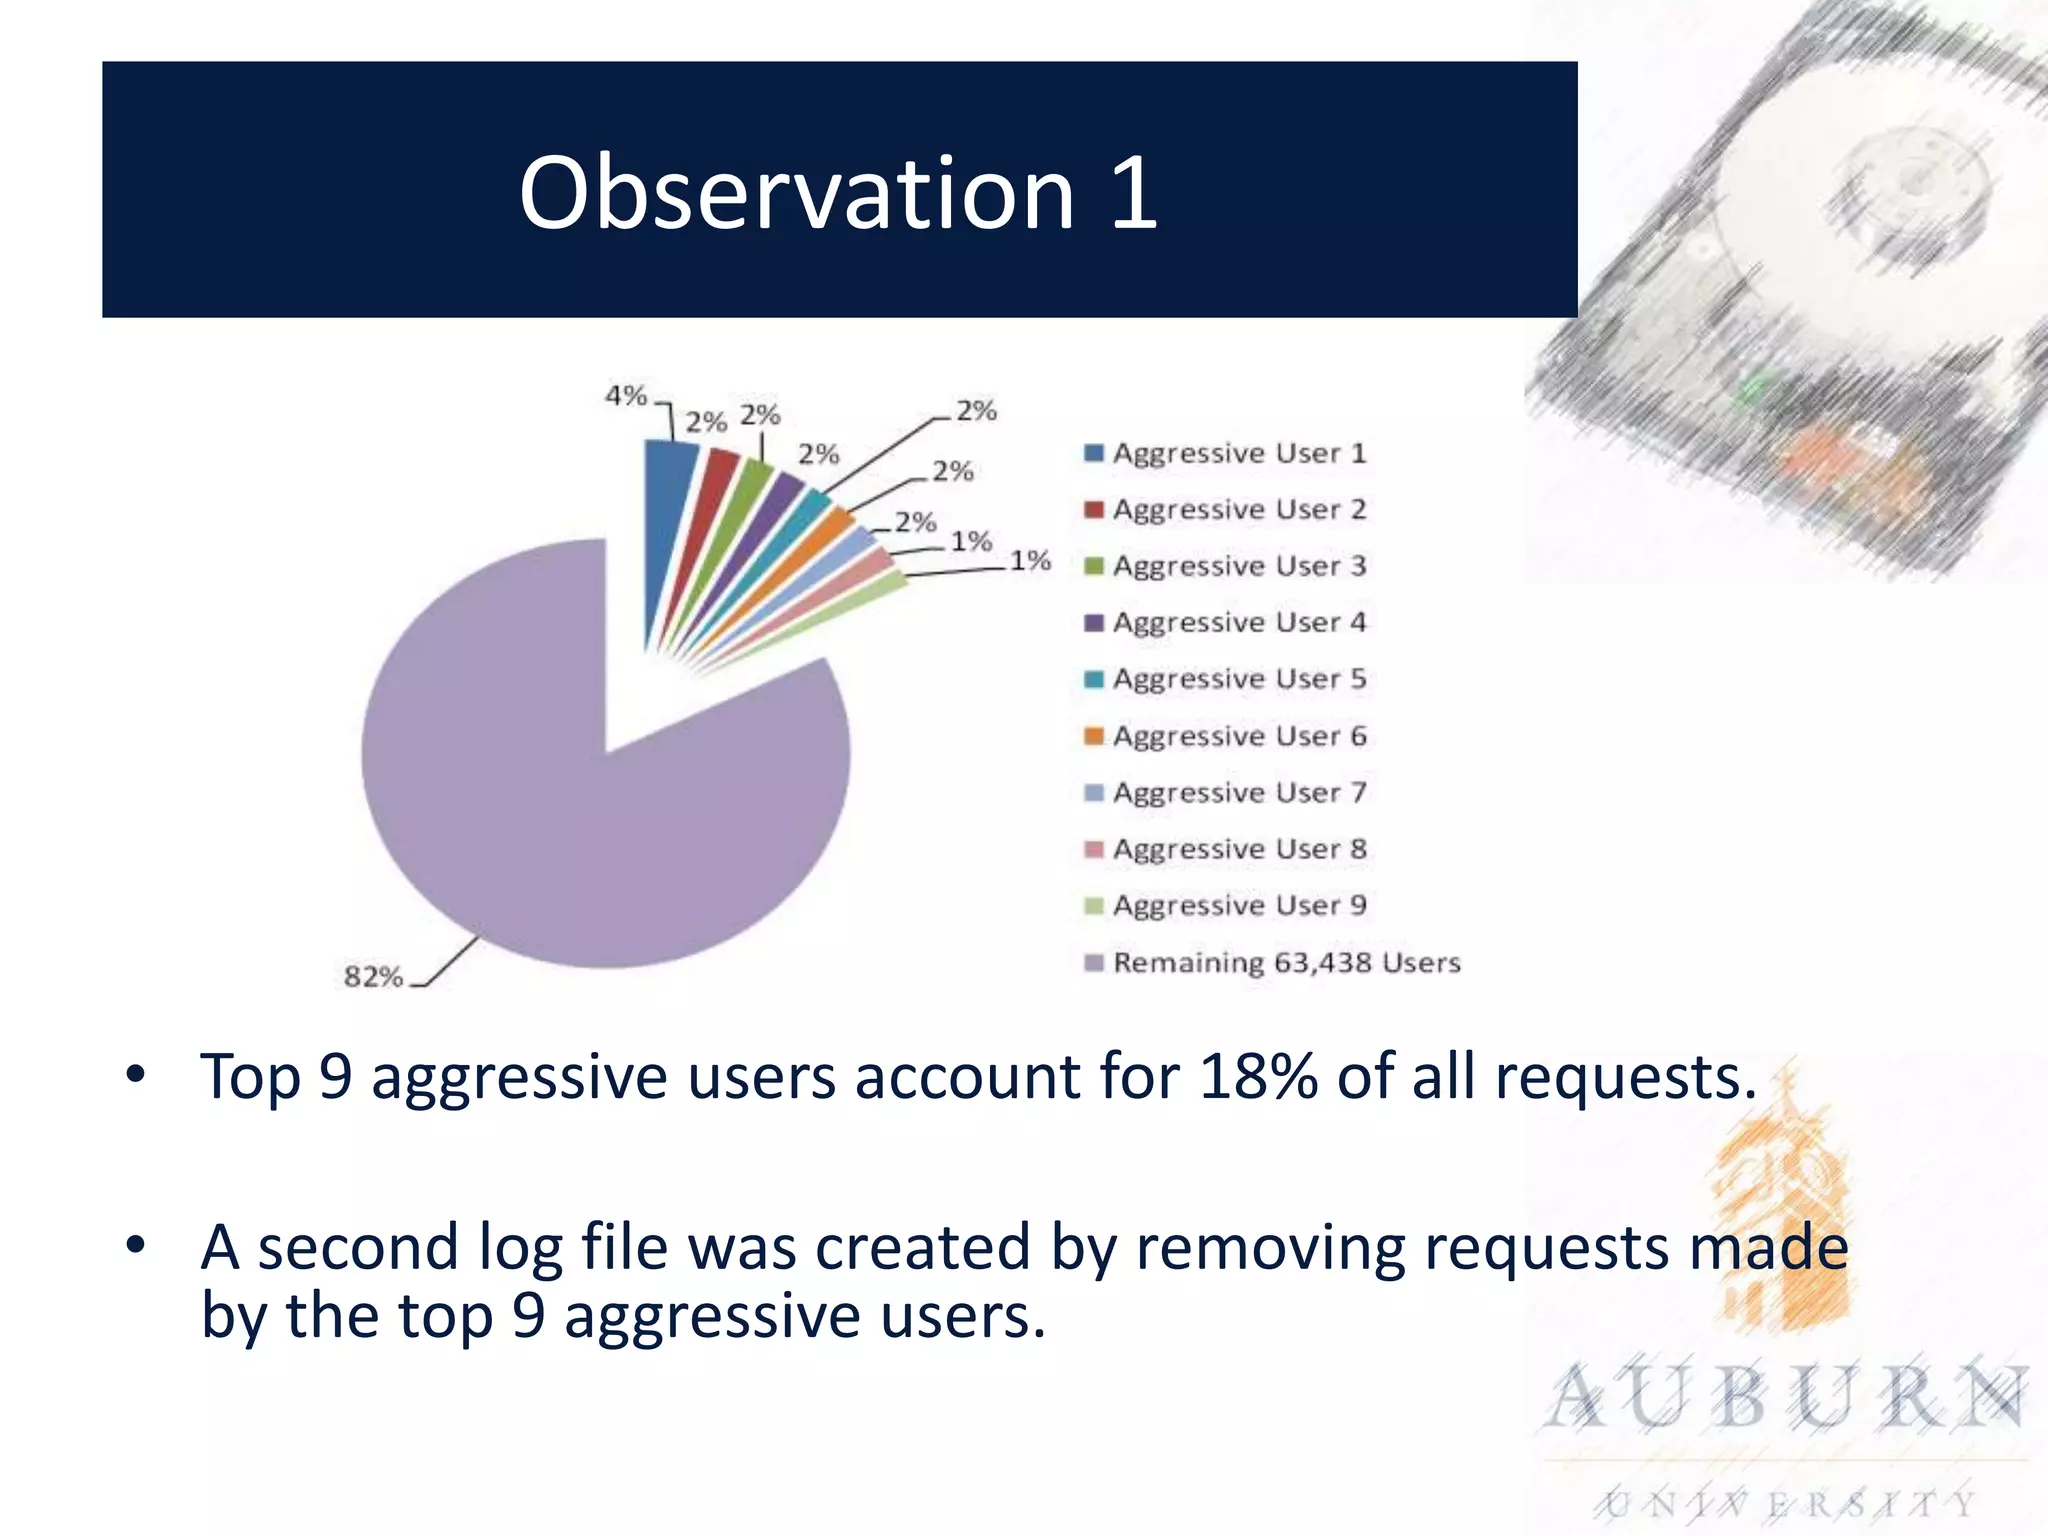
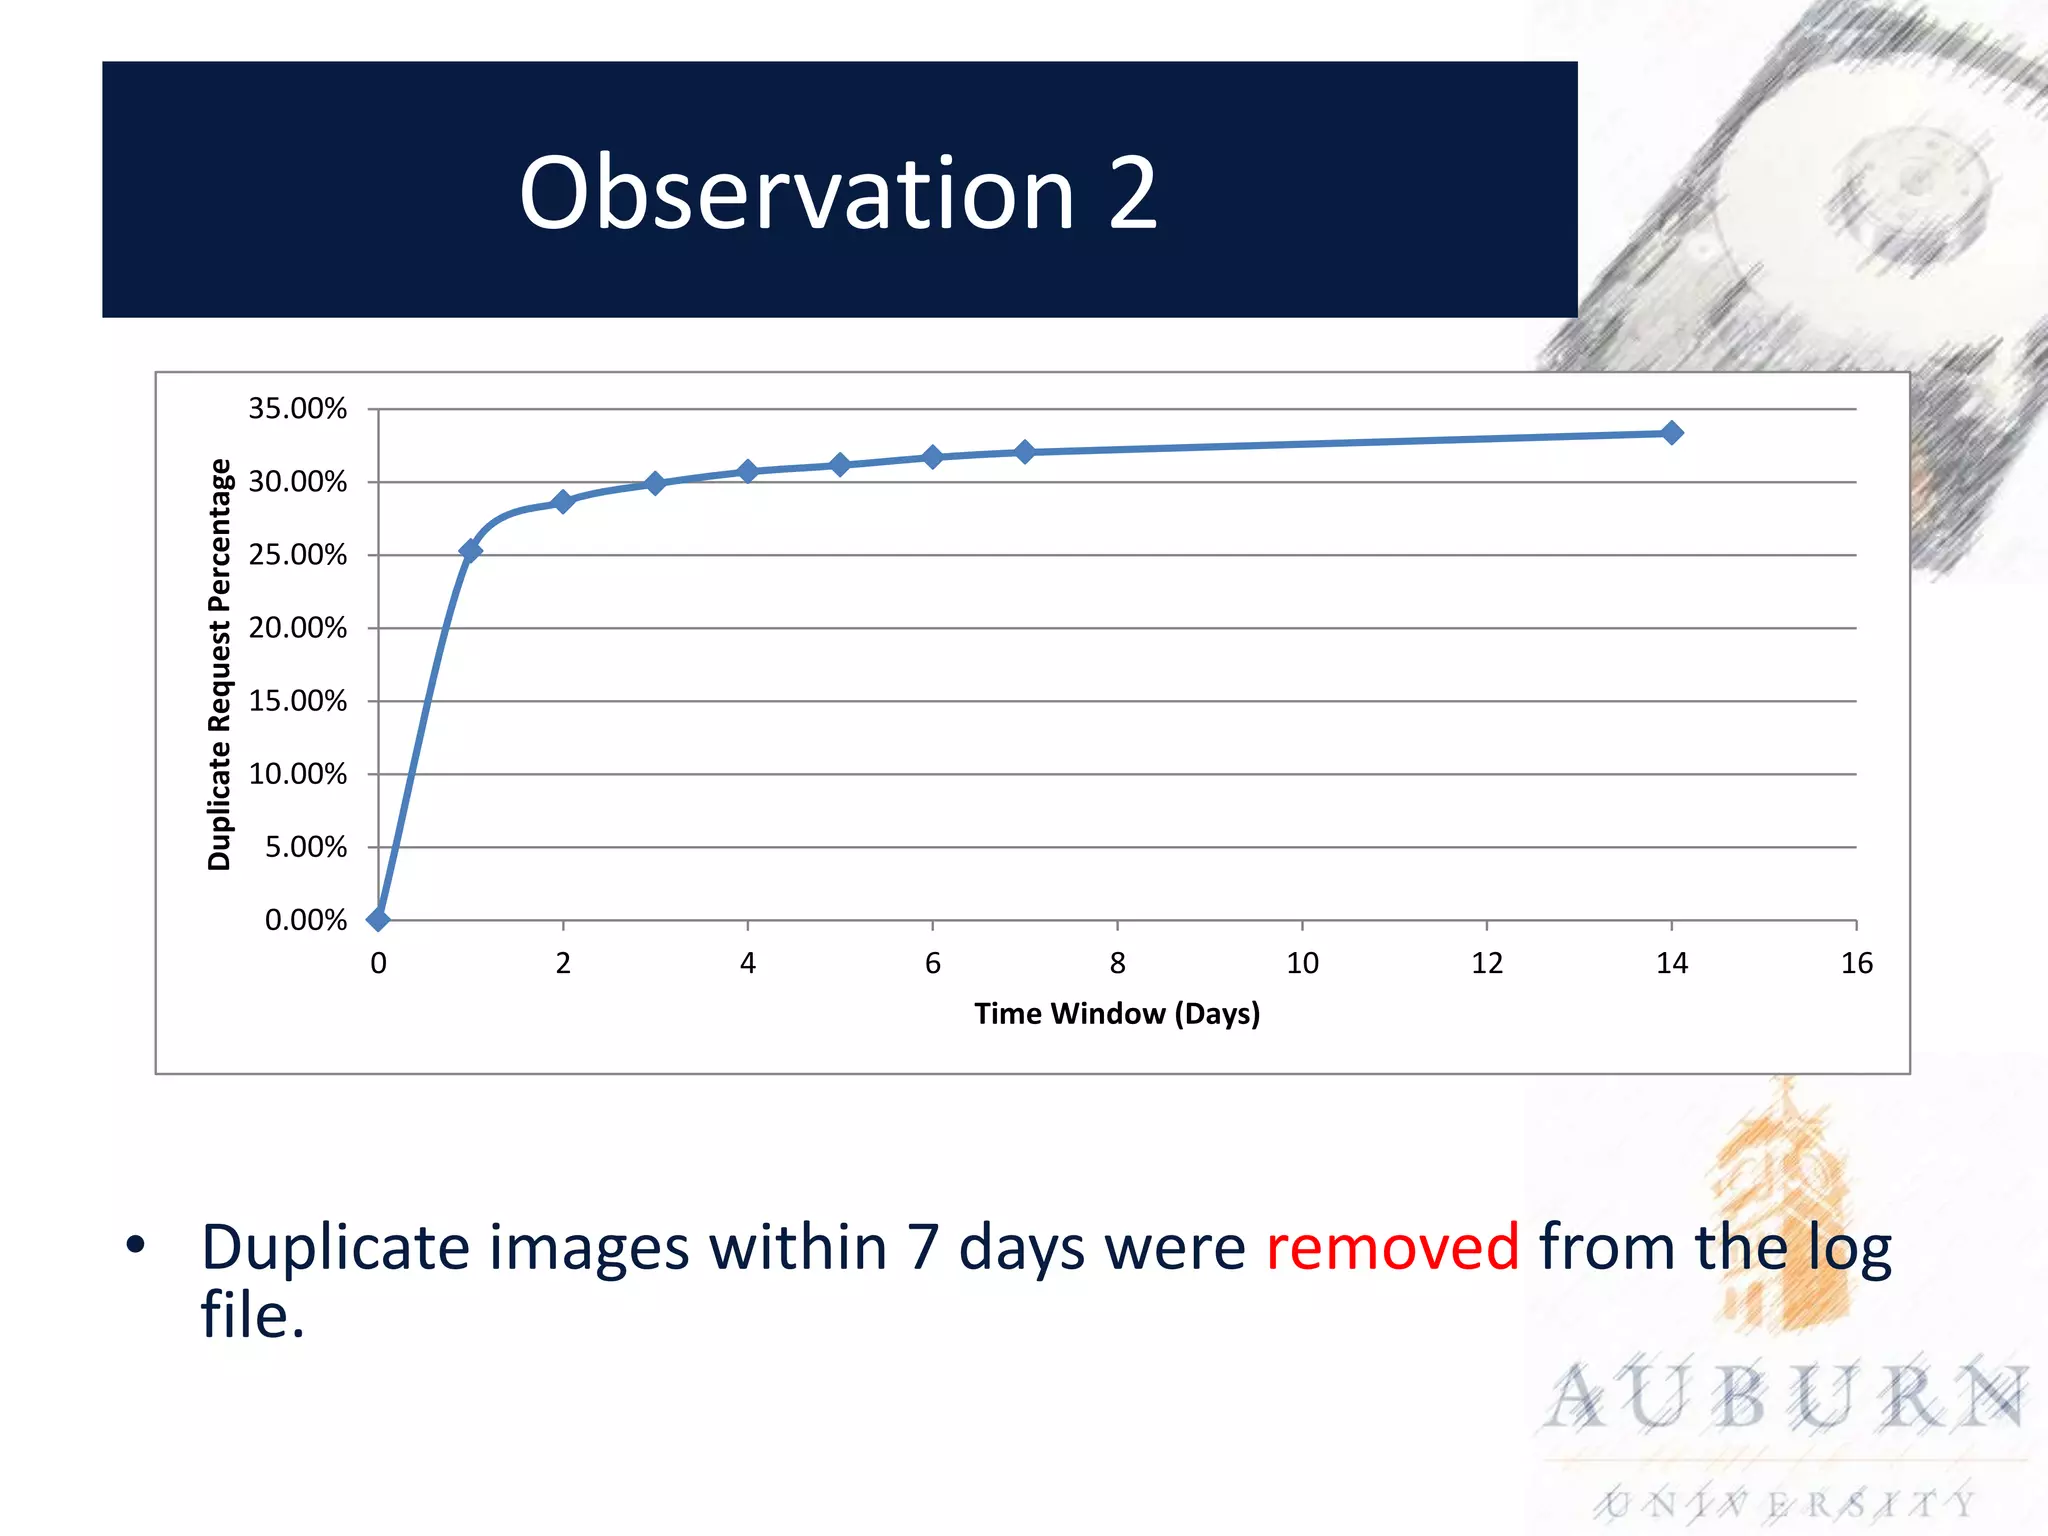
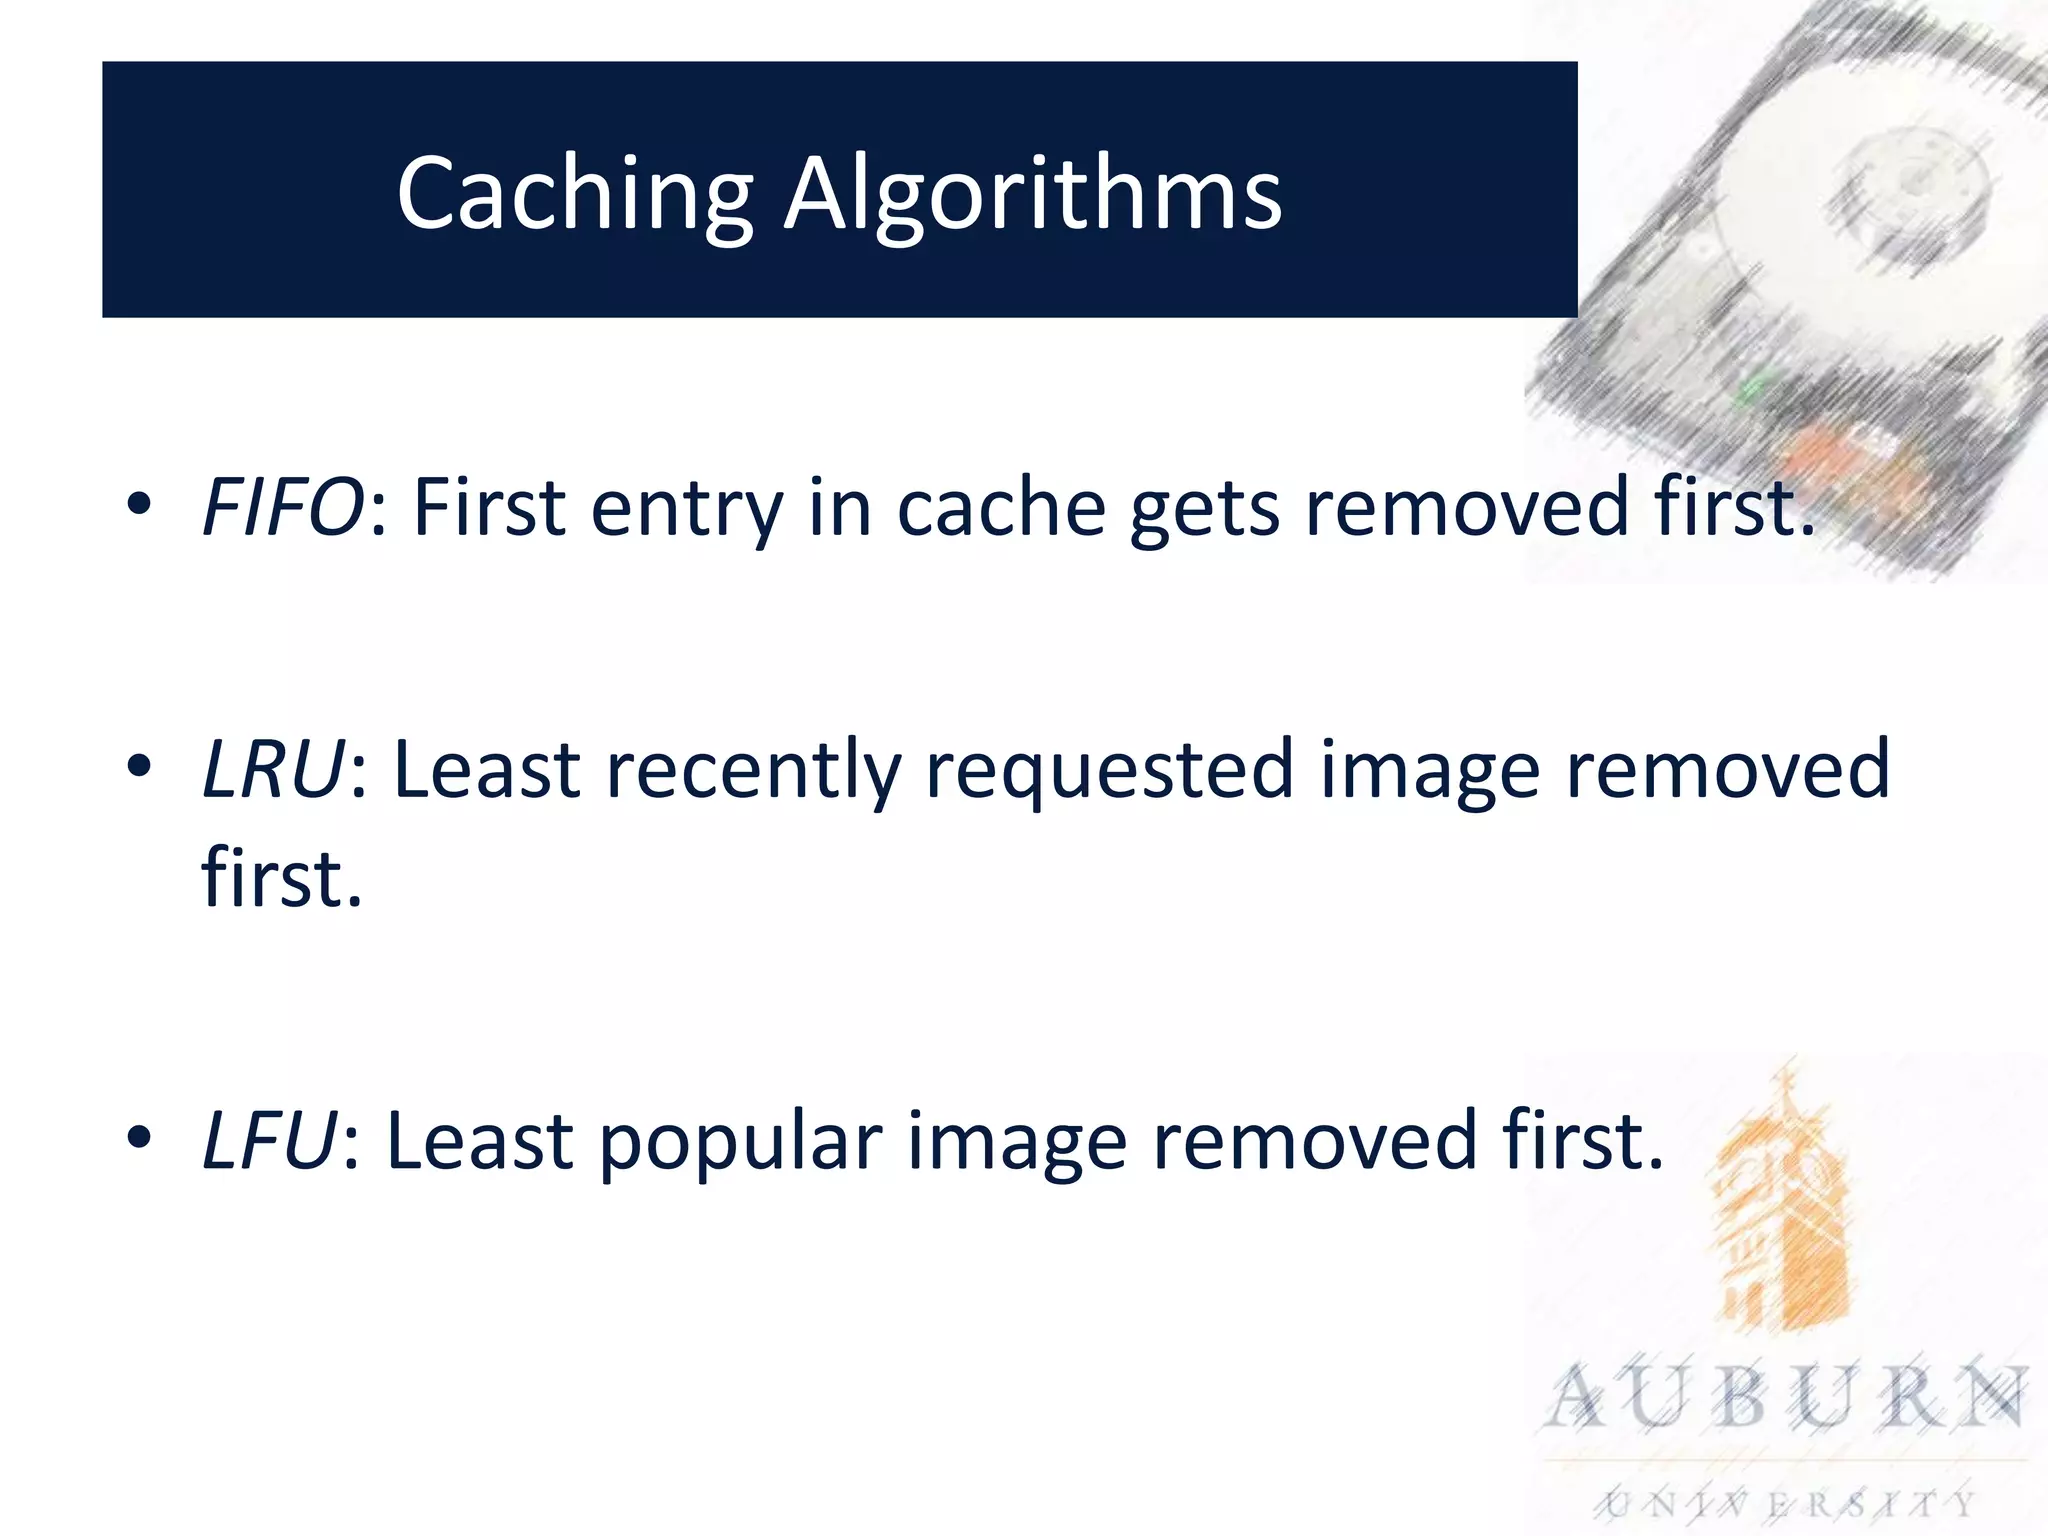
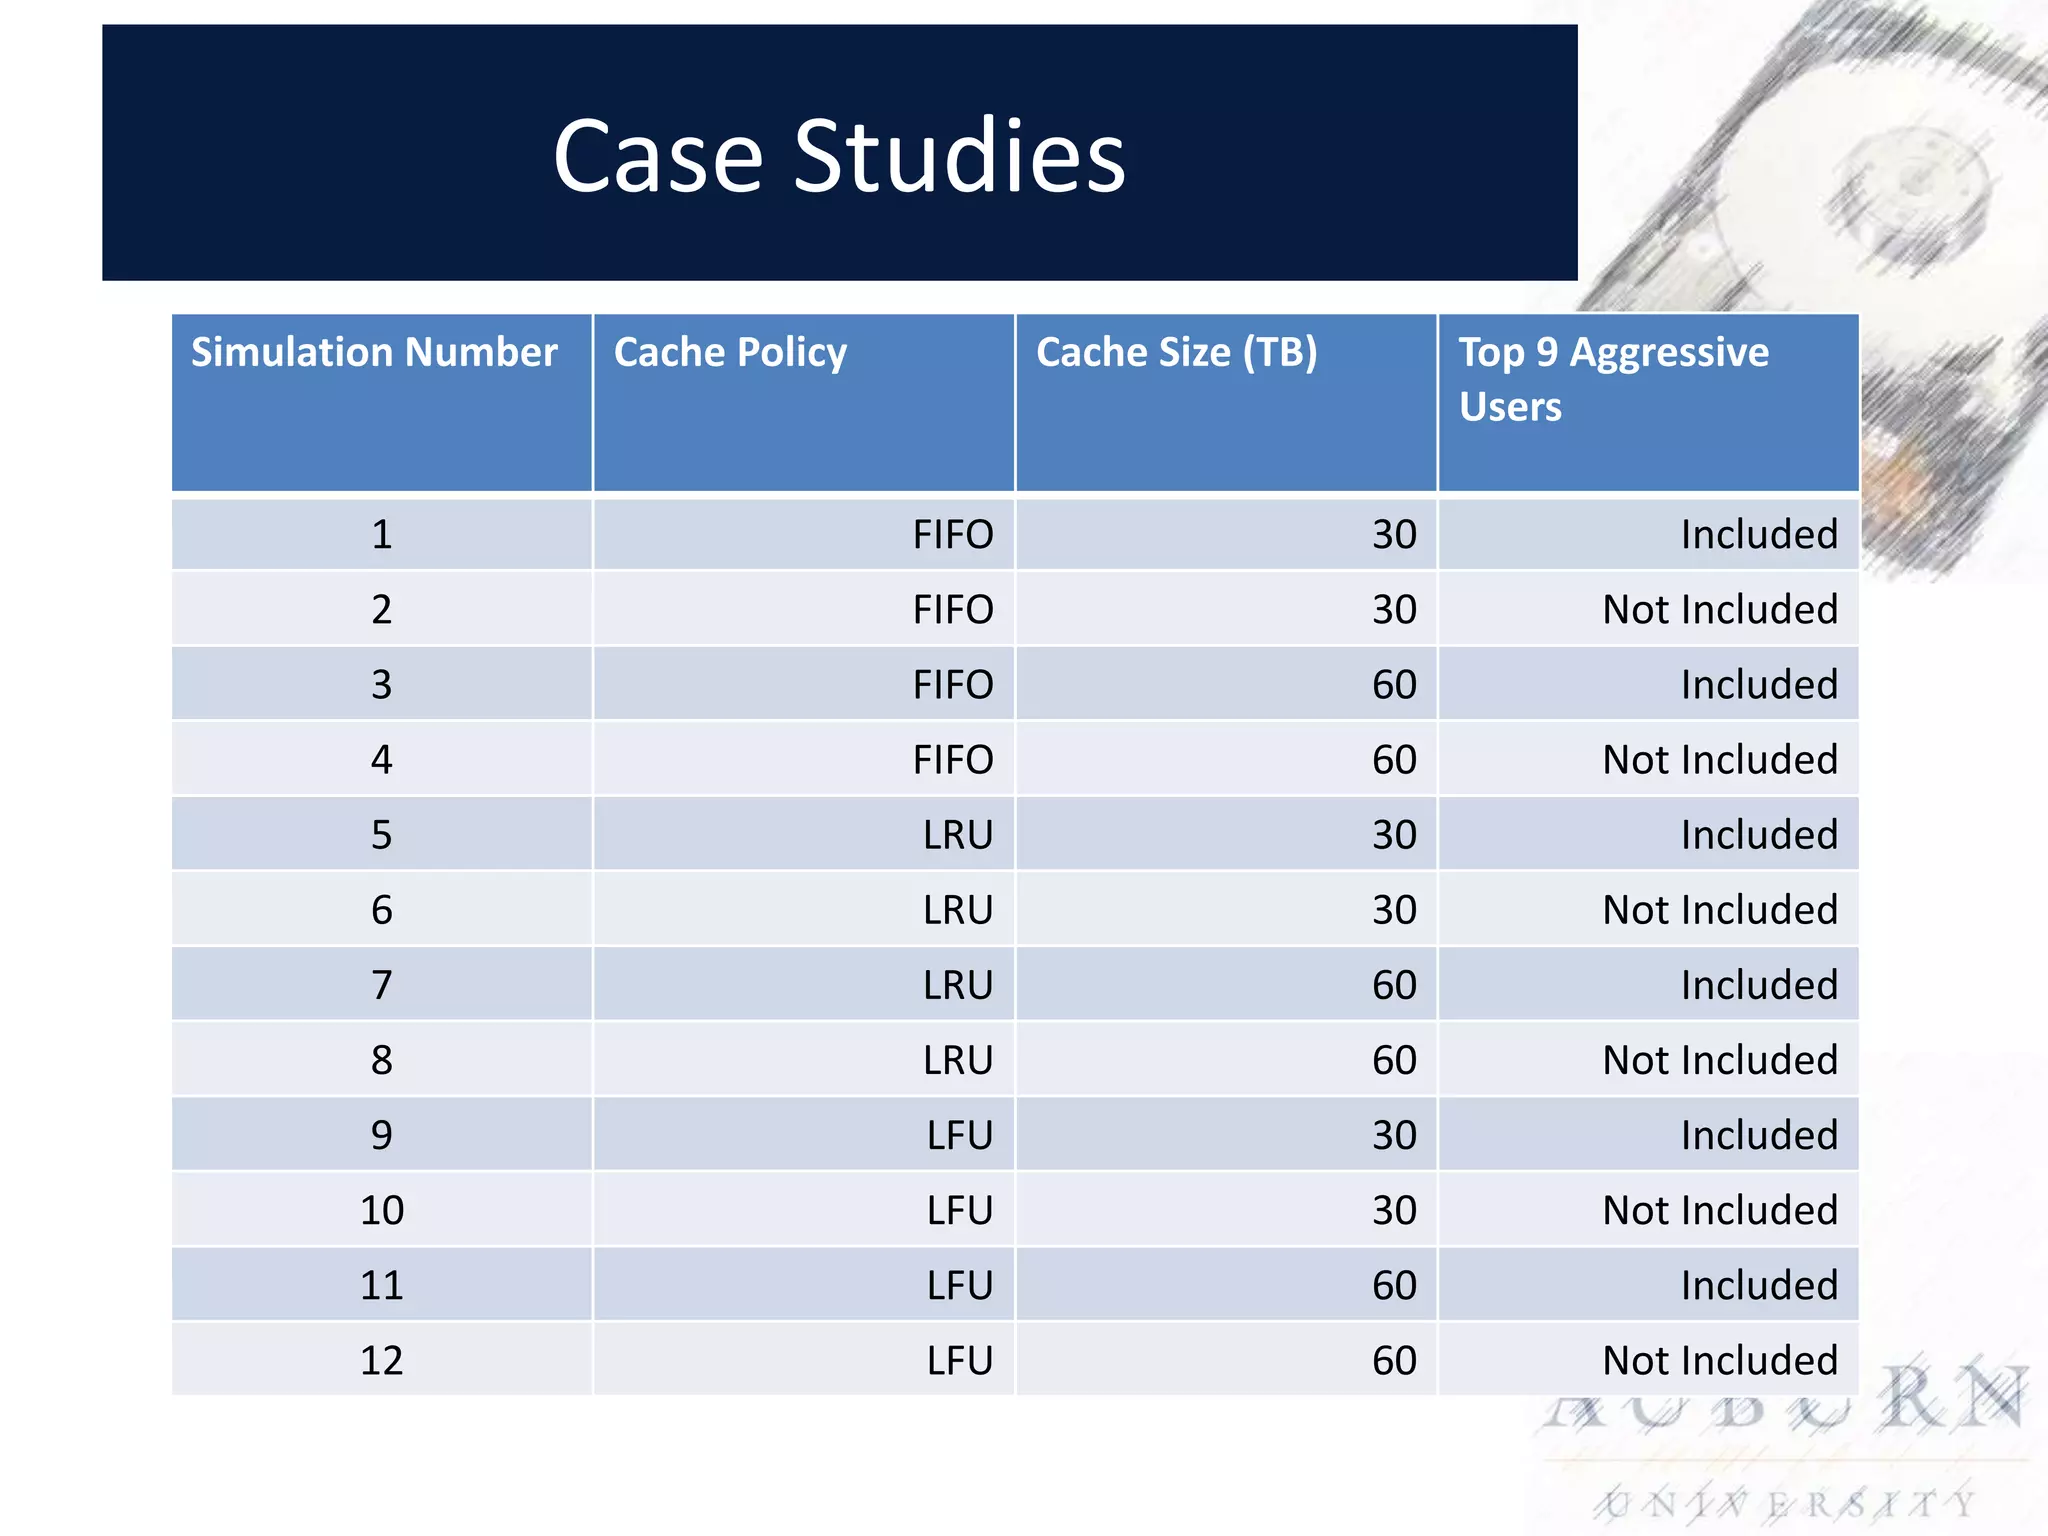
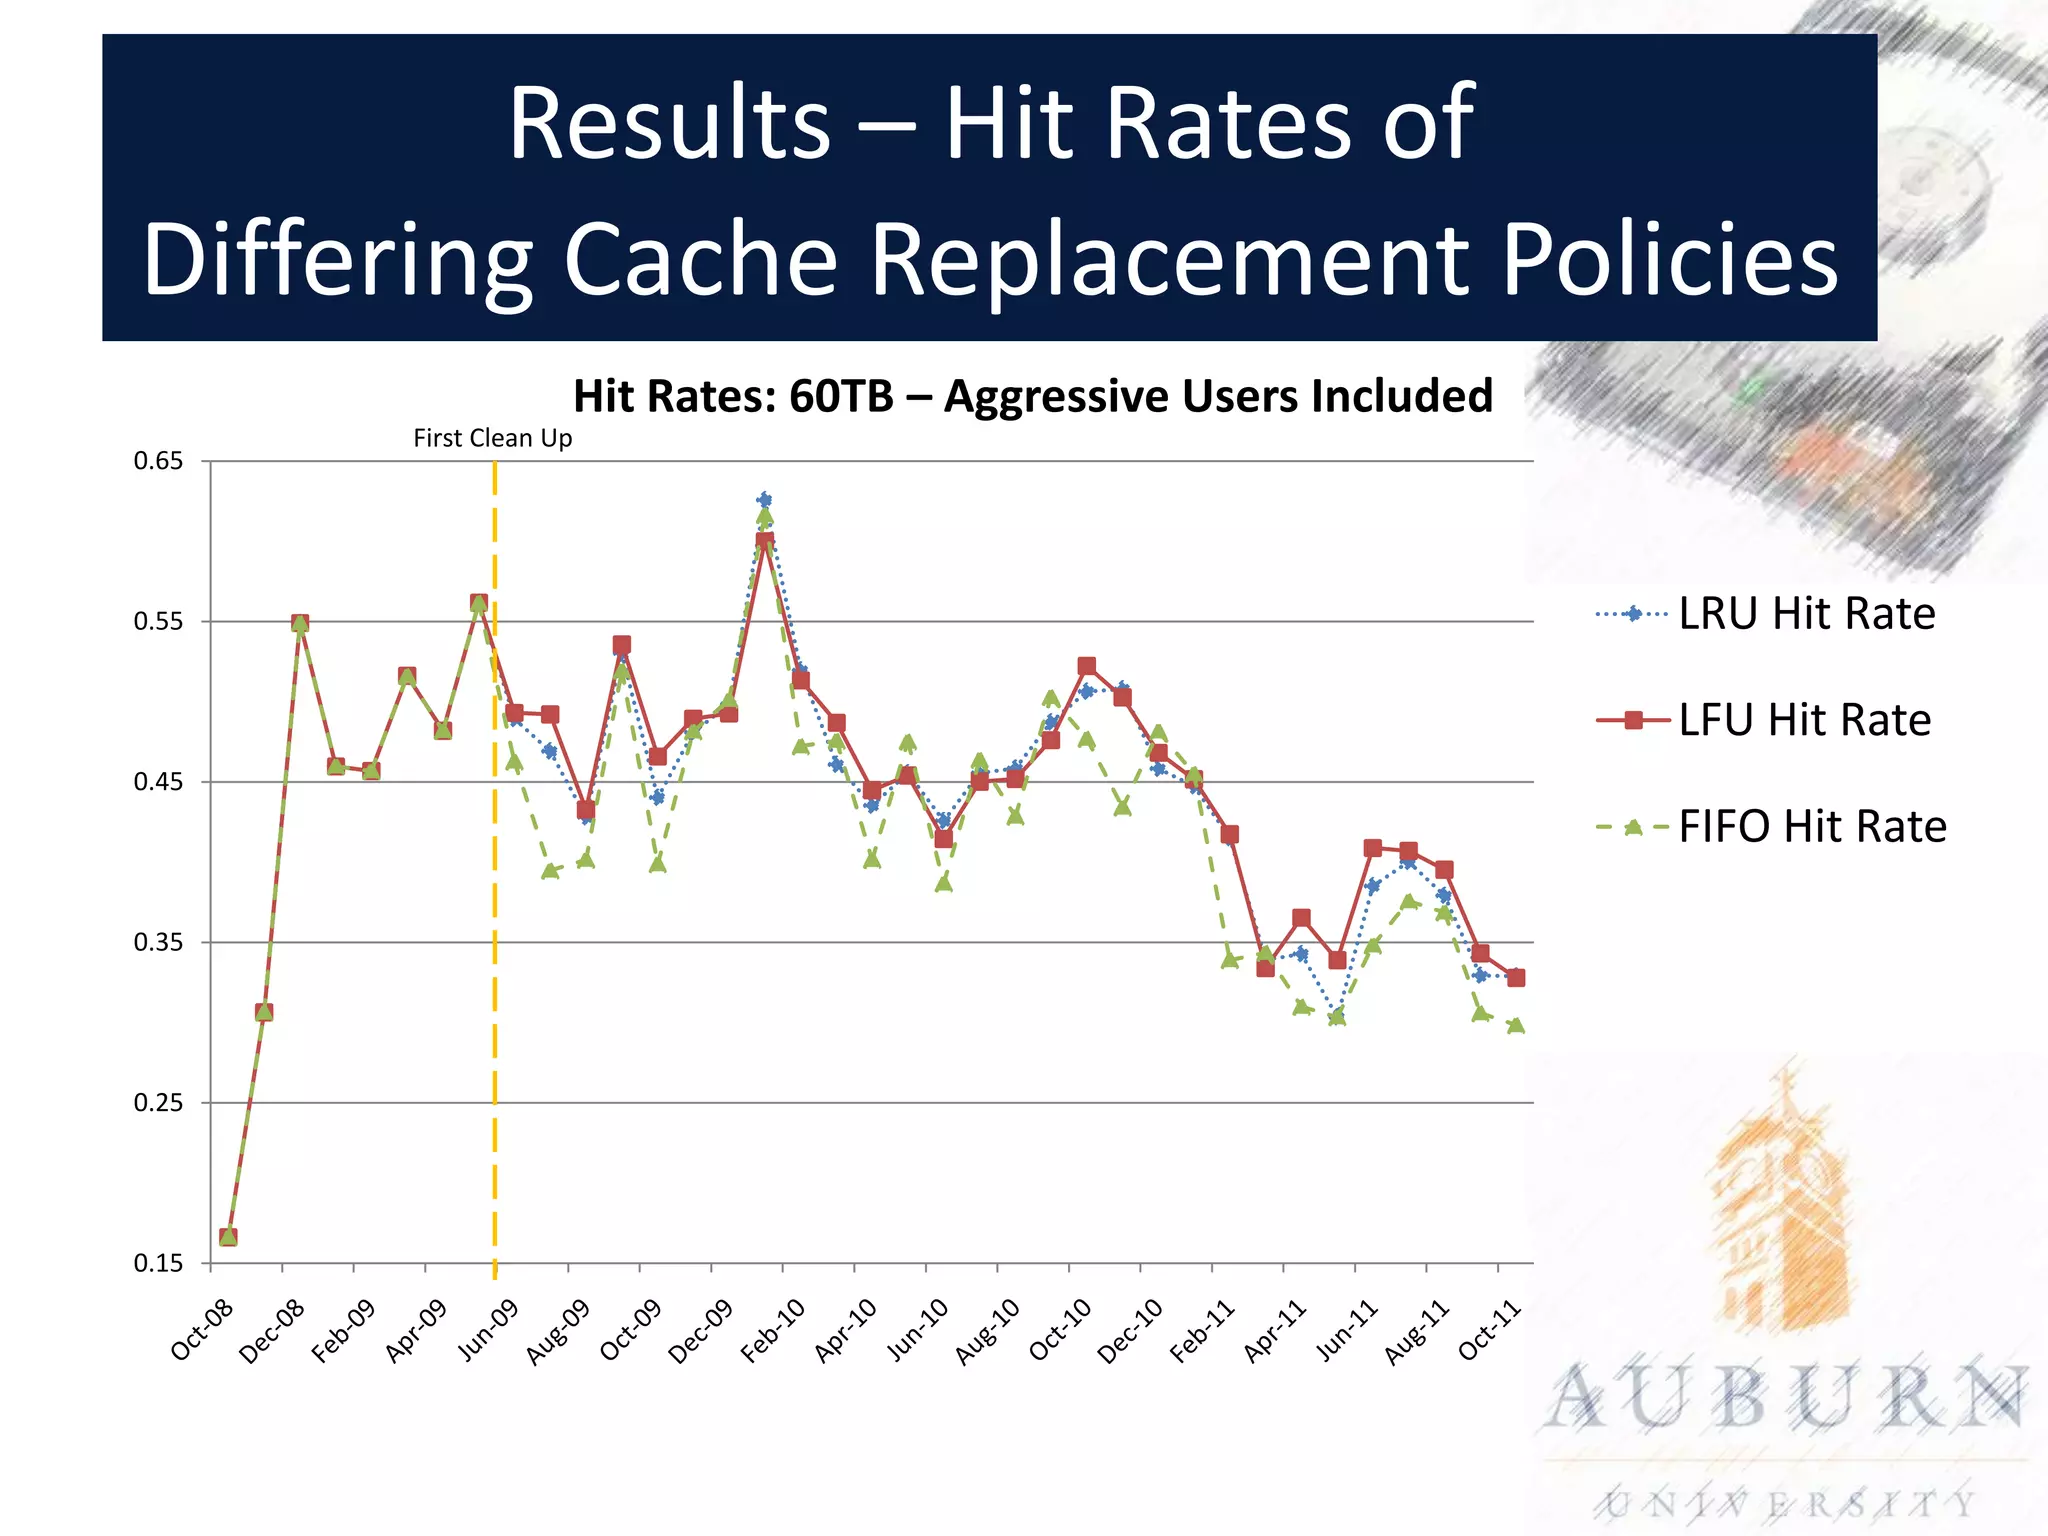
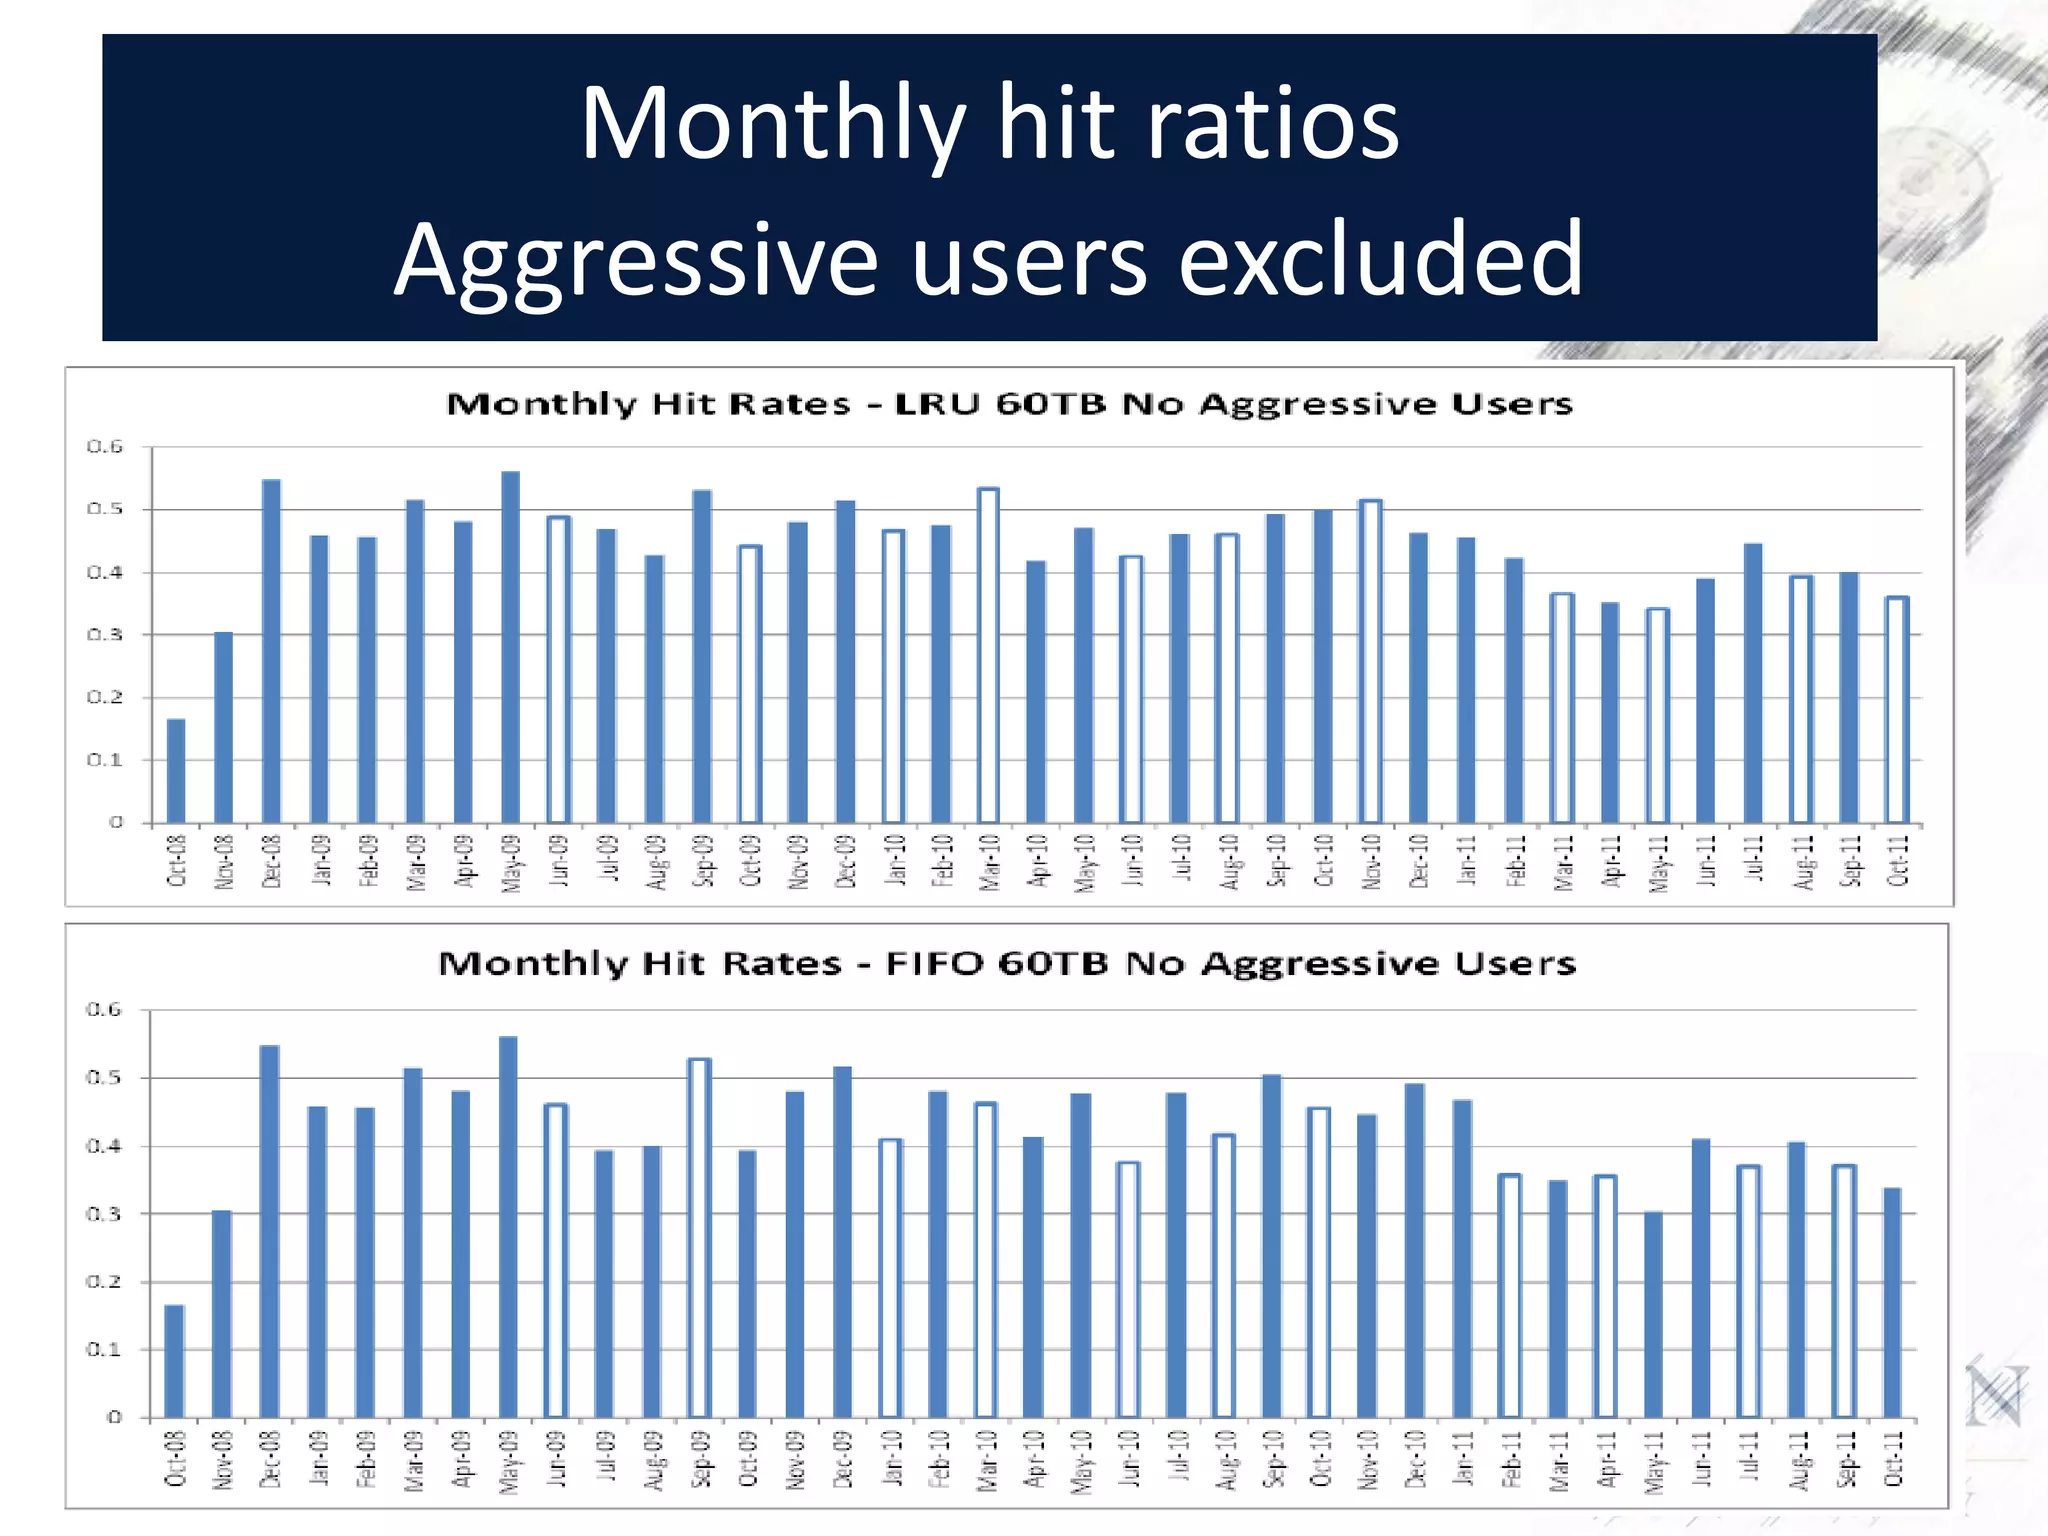
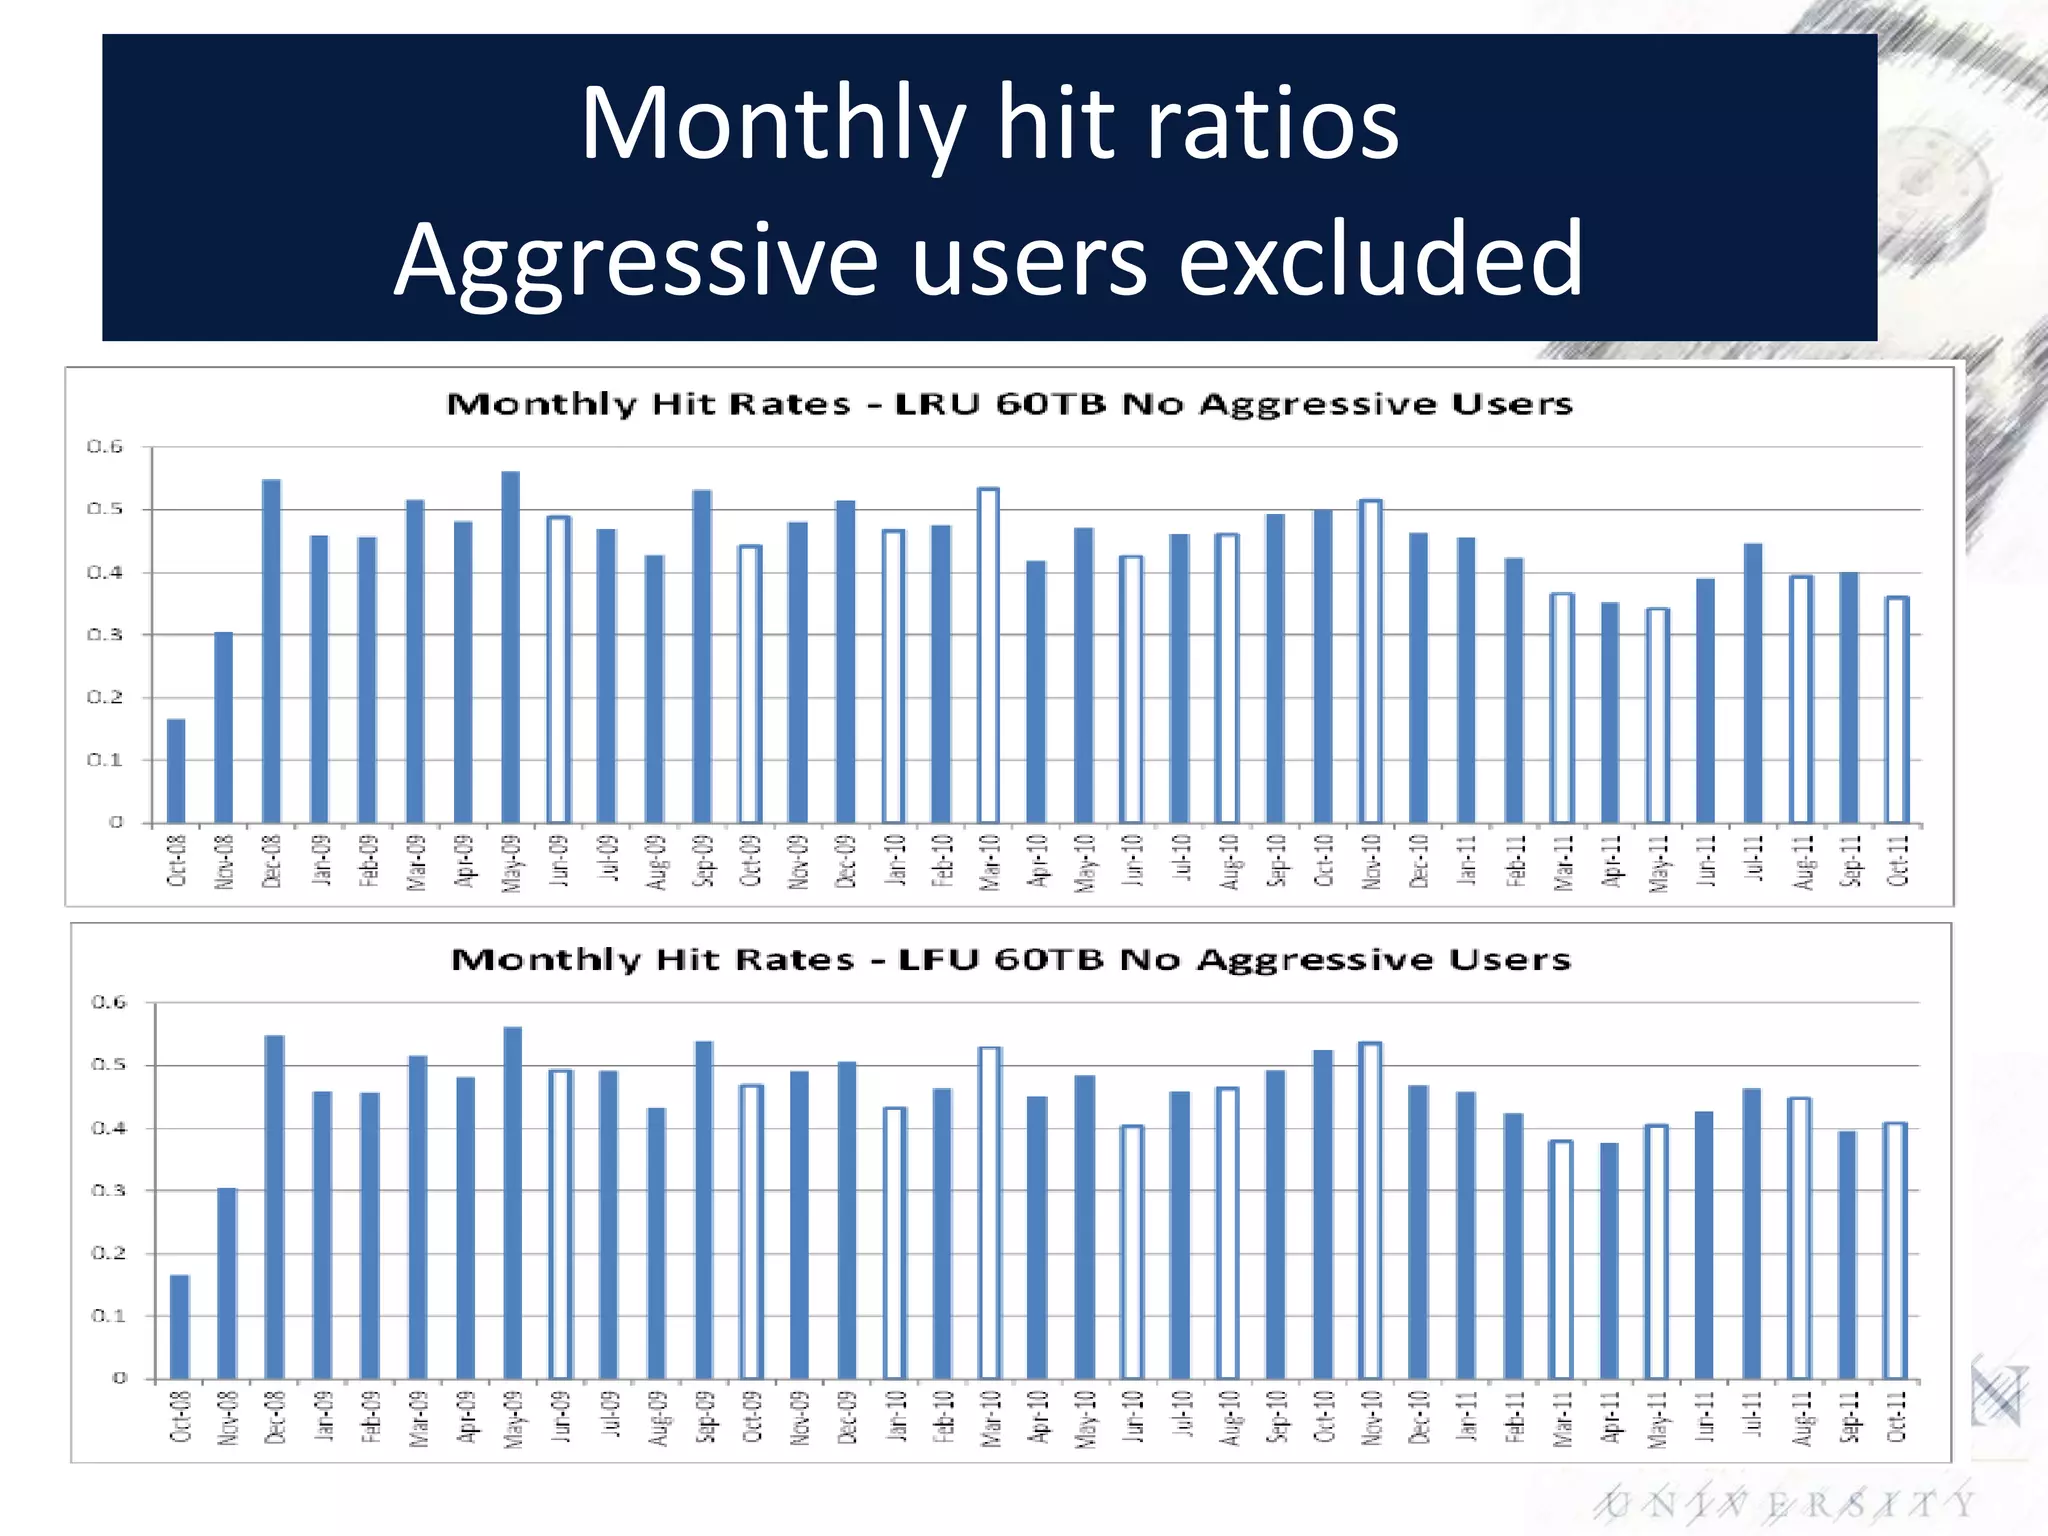
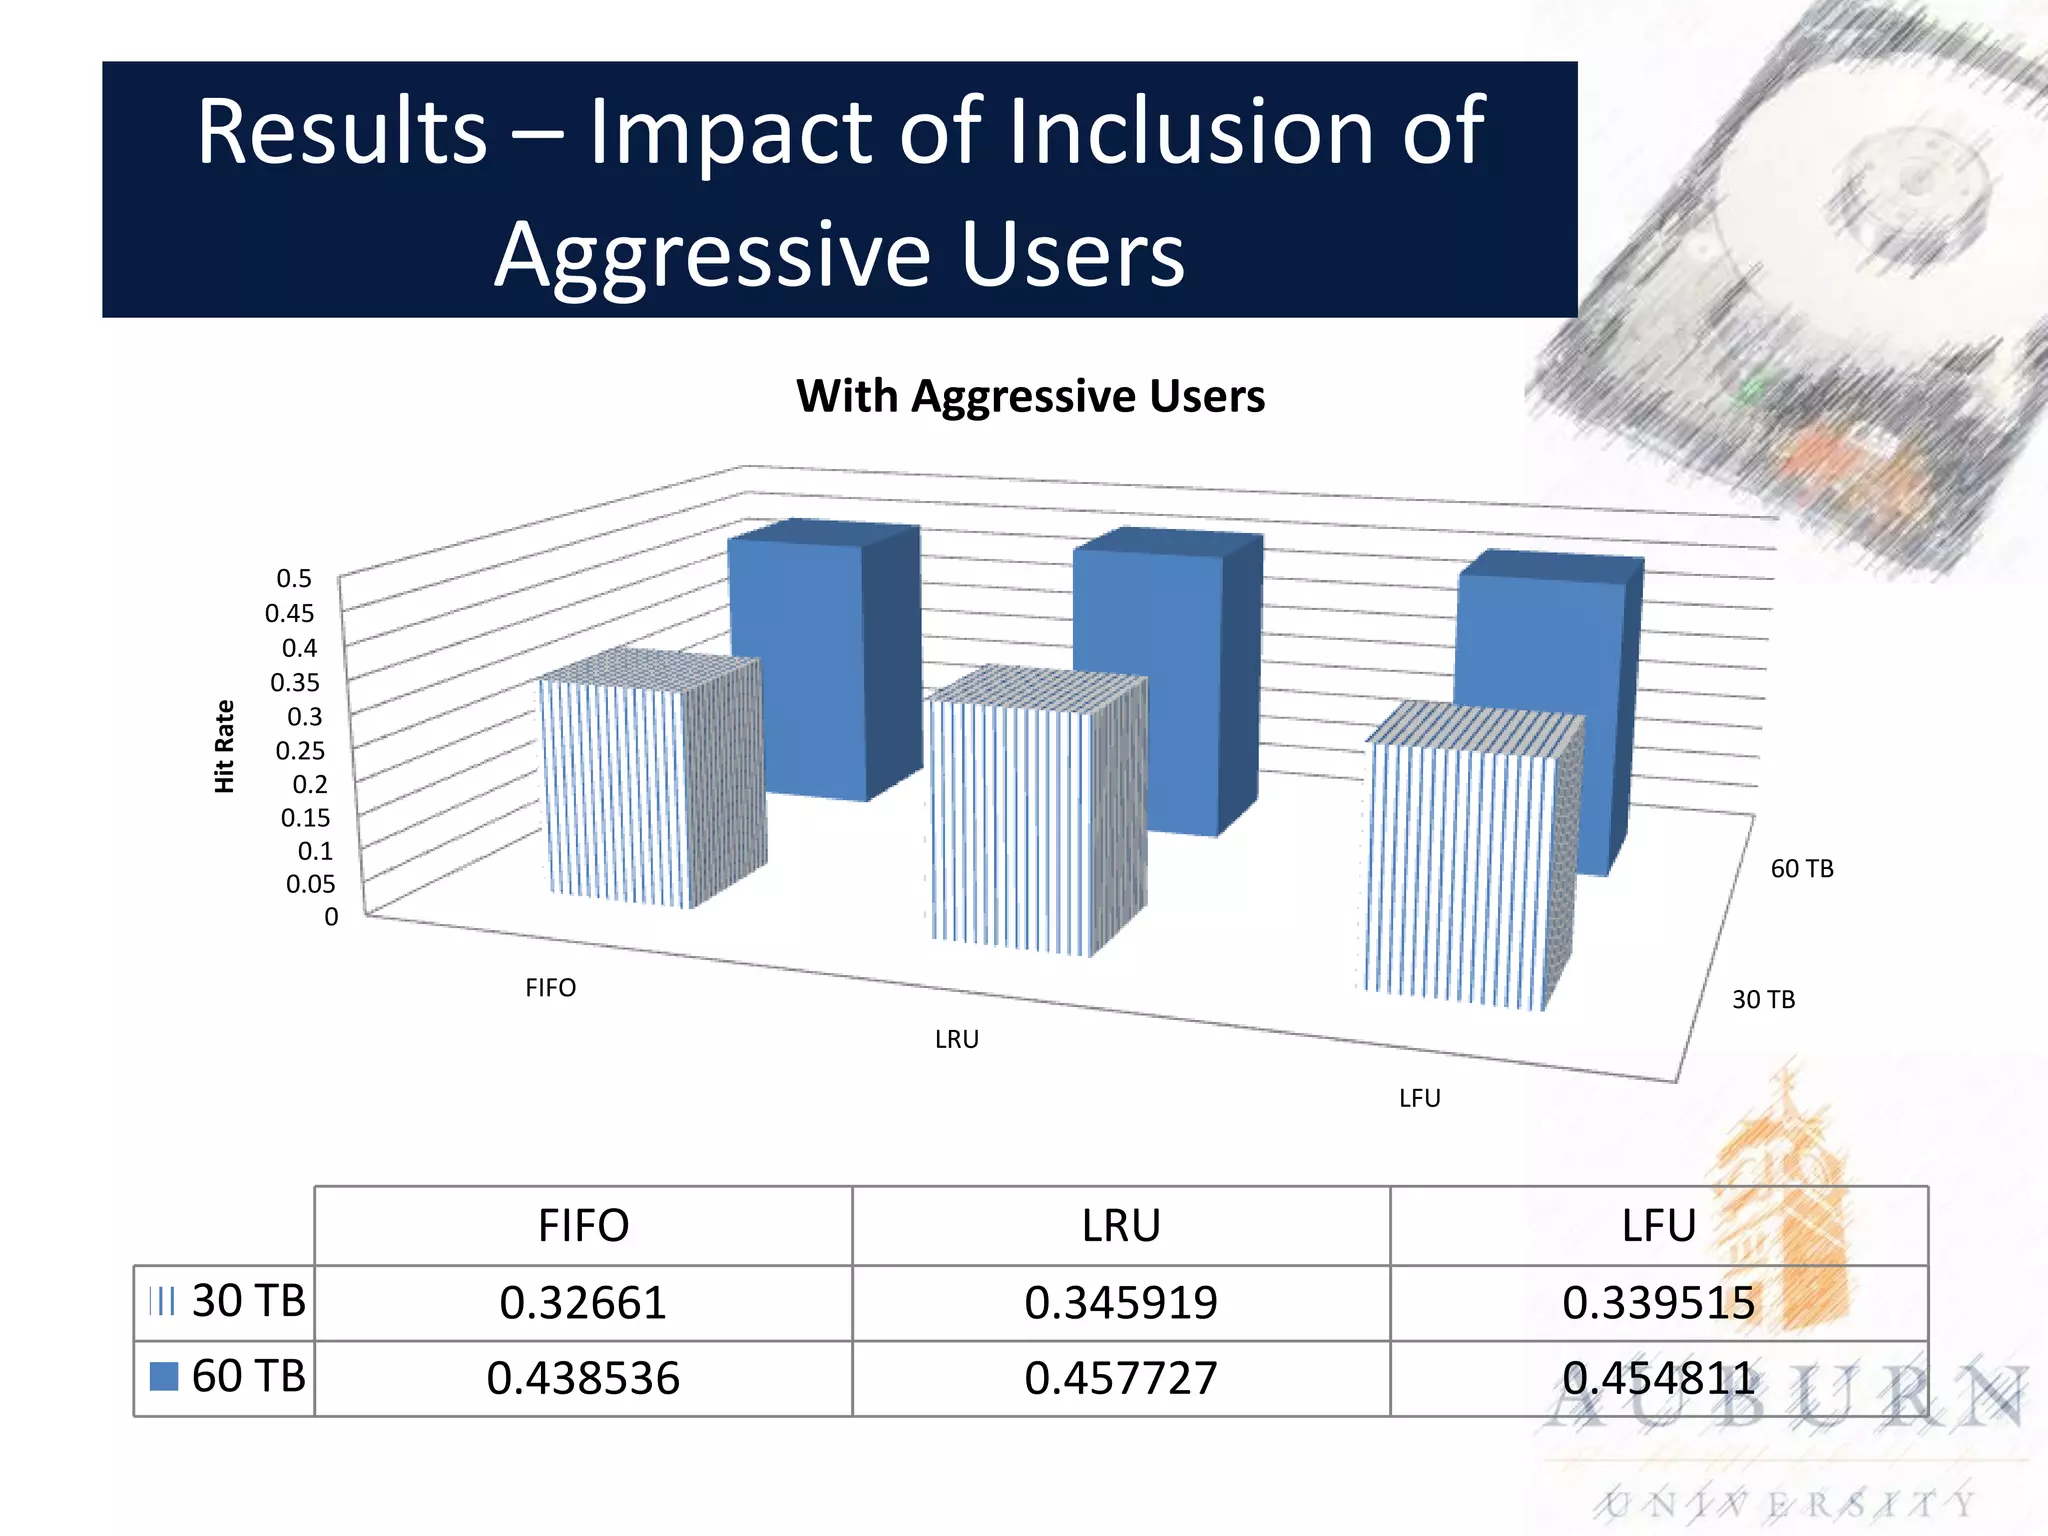
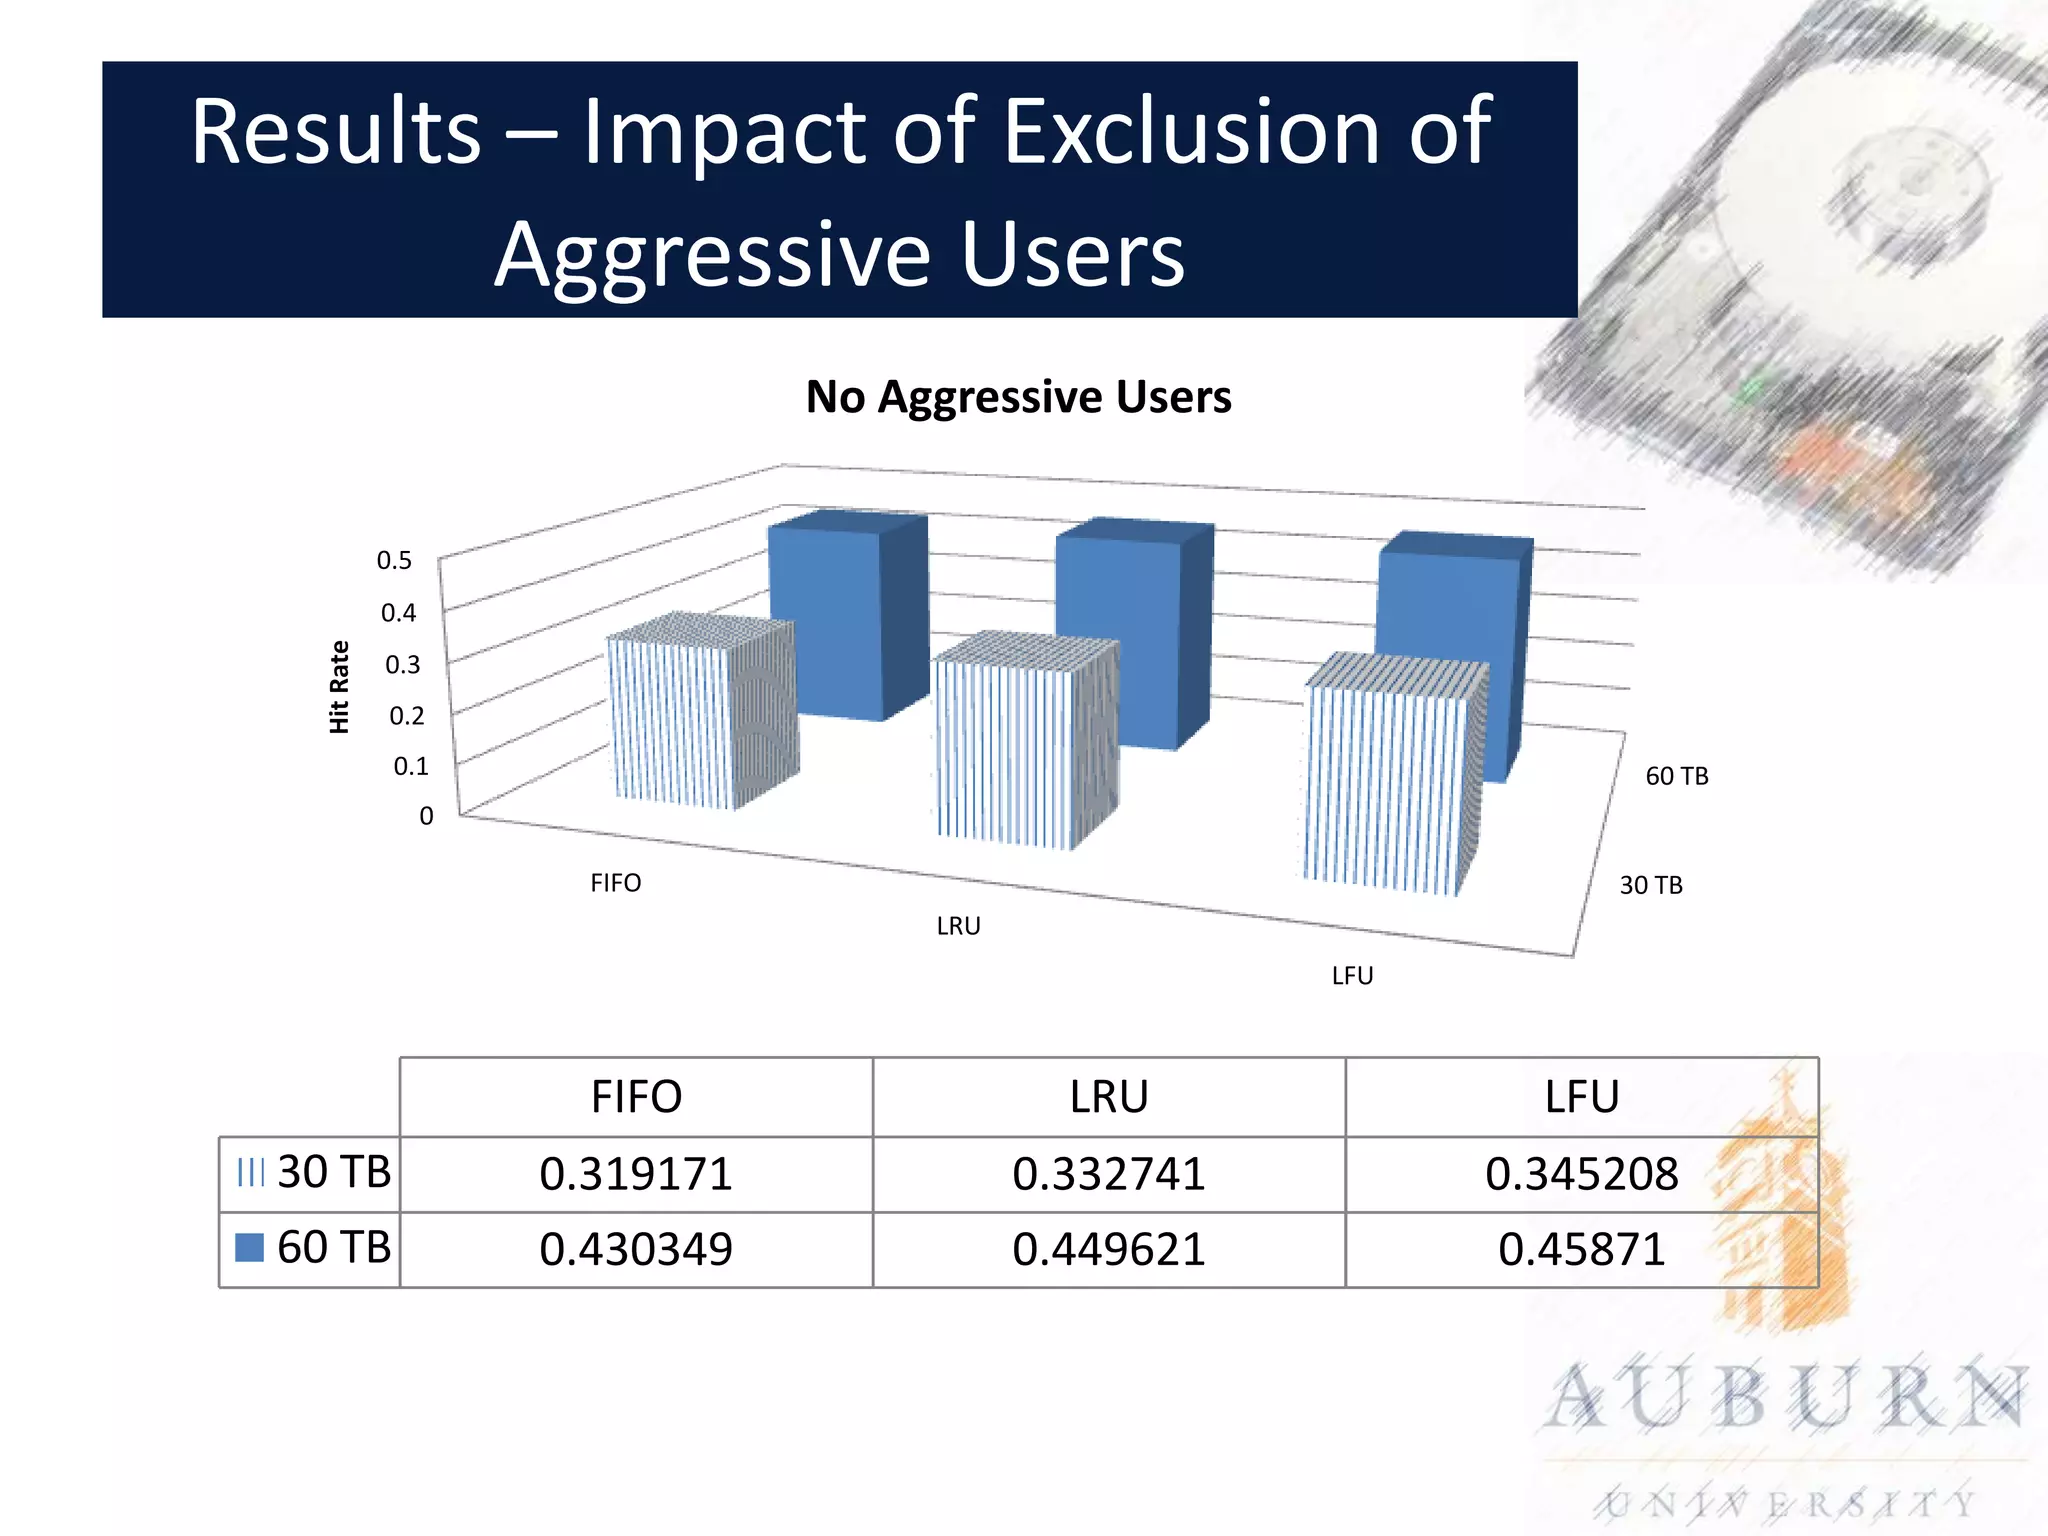

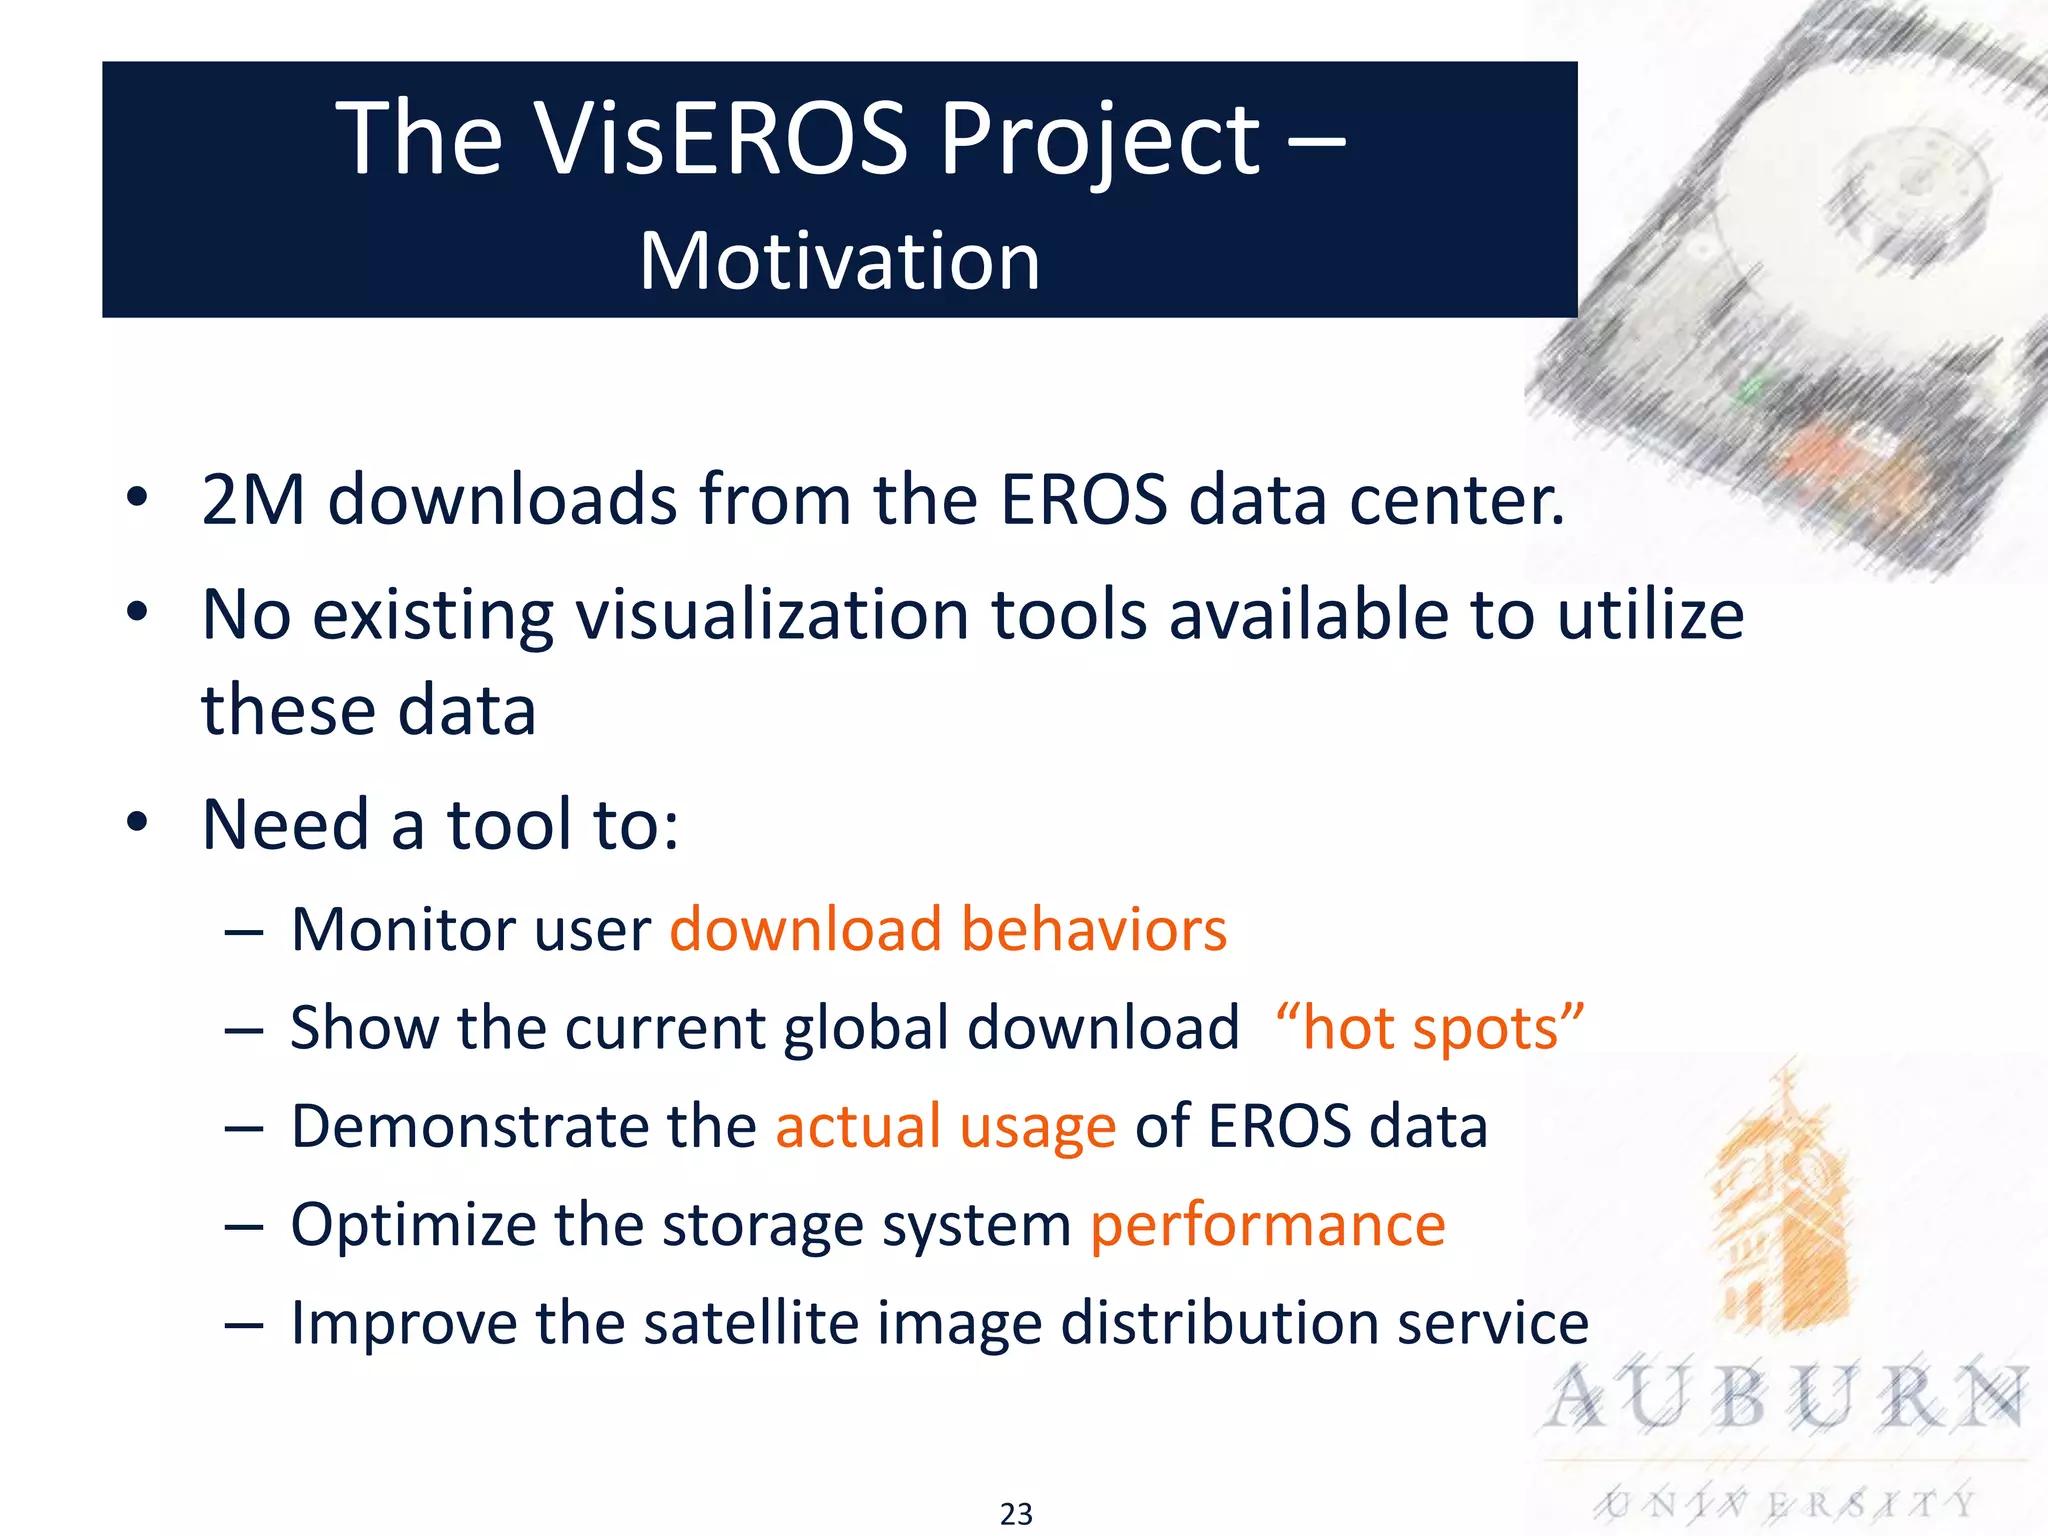
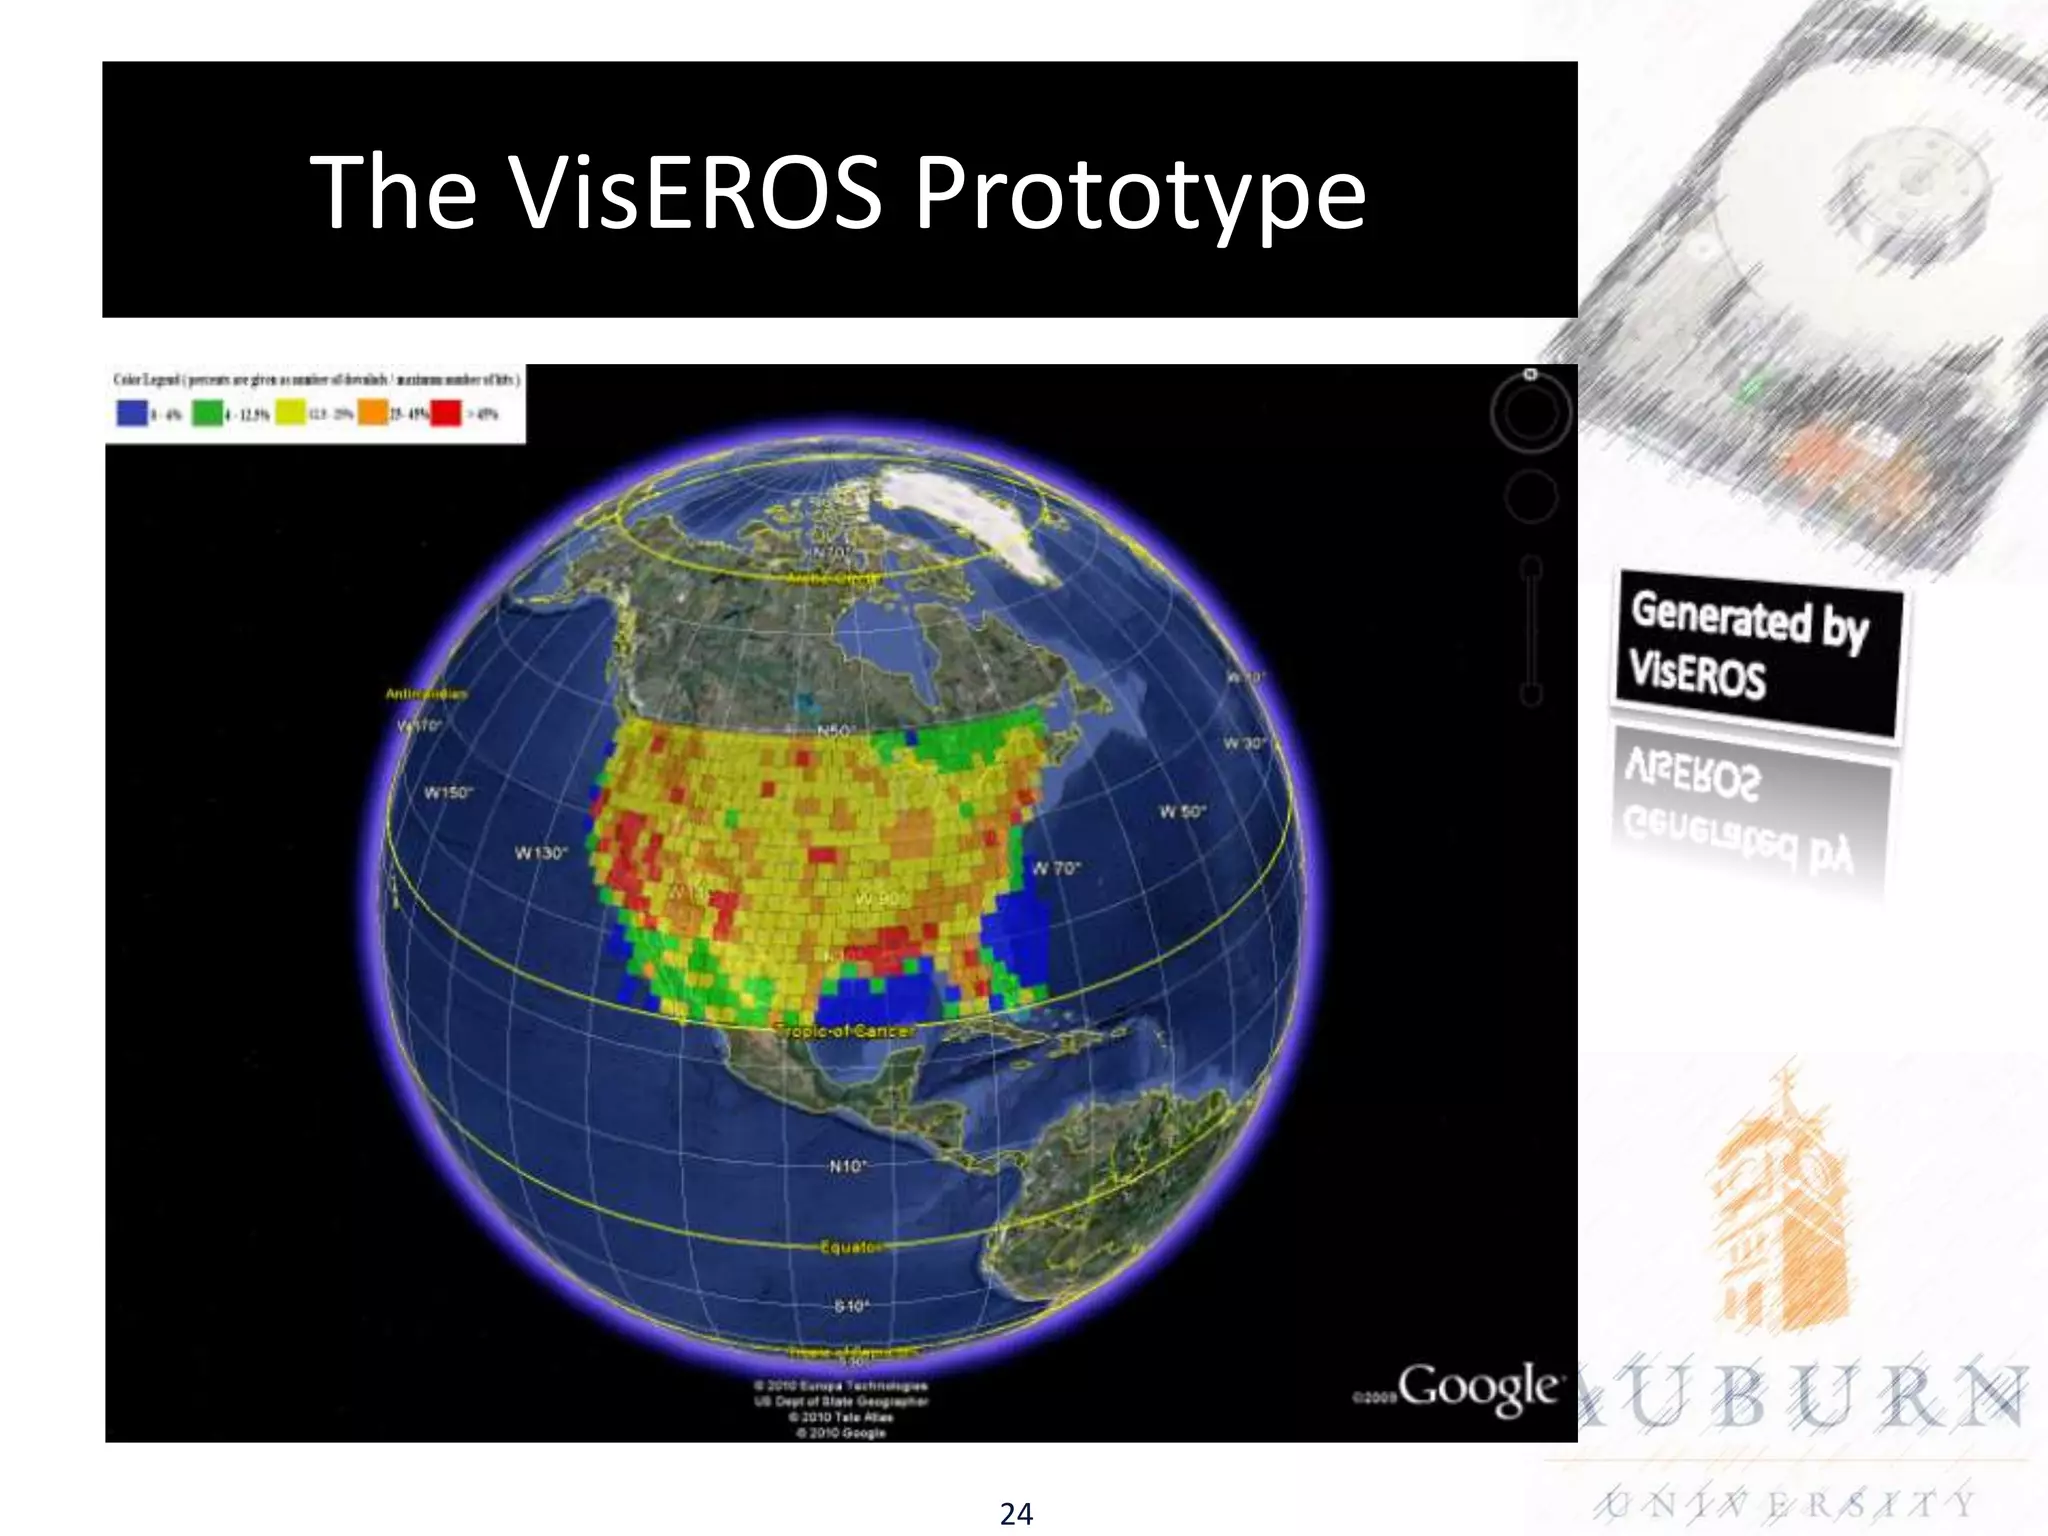
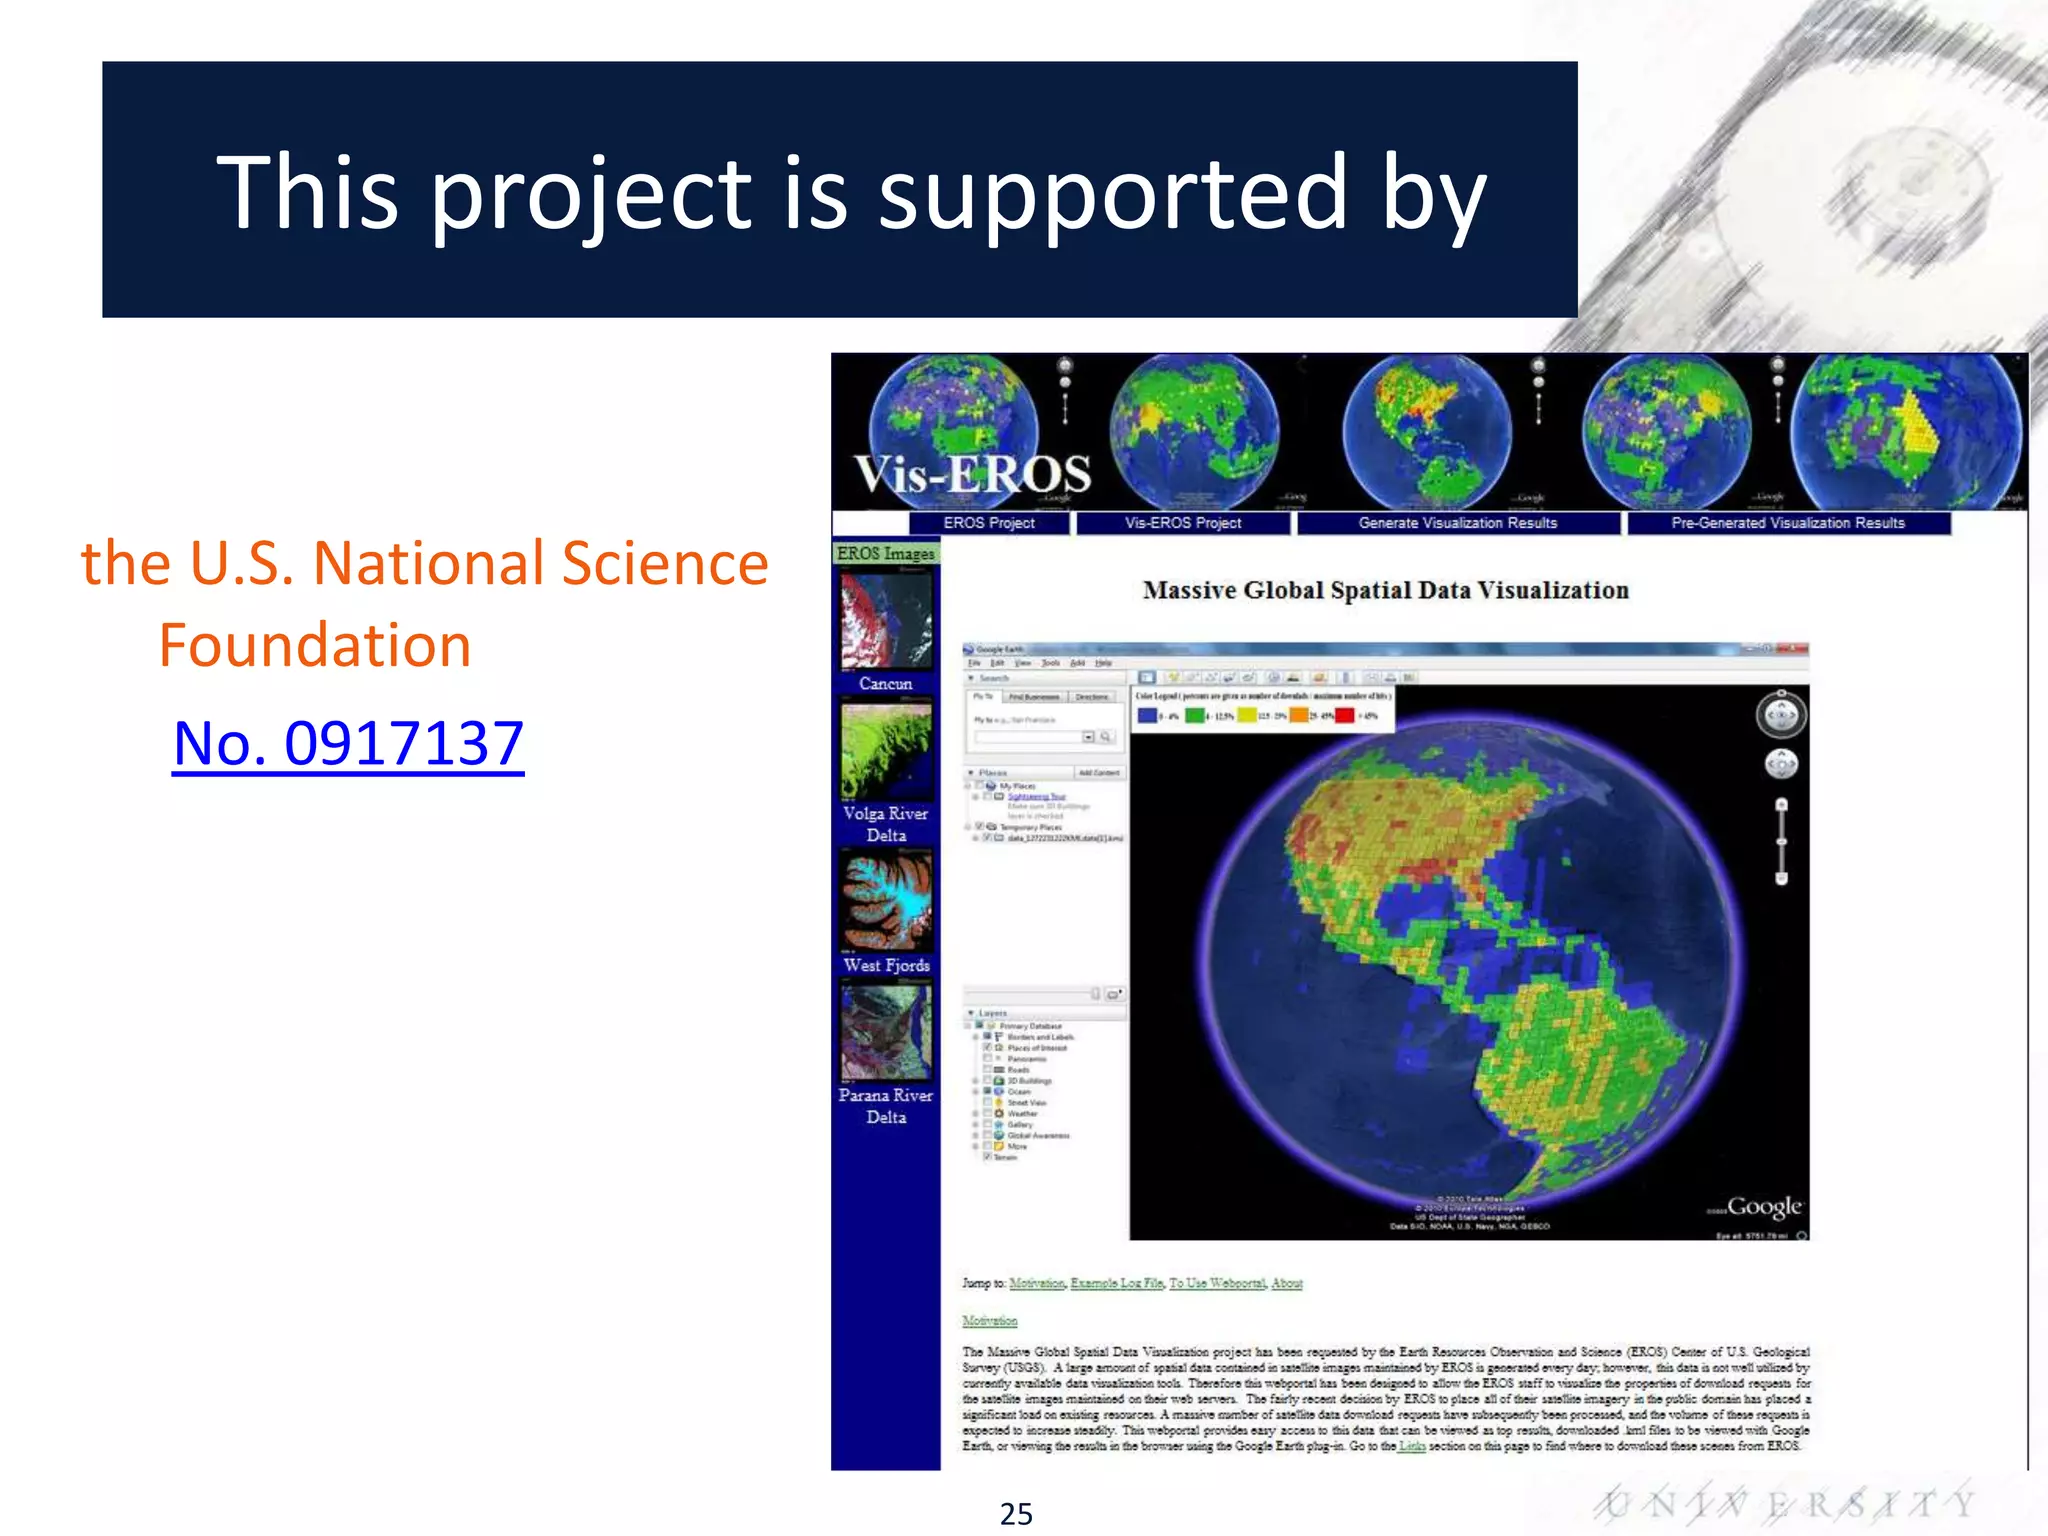

The document evaluates traditional caching policies in a large-scale data context, specifically at the Earth Resources Observation and Science (EROS) Center, which handles over 4 petabytes of satellite imagery. The study found that cache management strategies, such as FIFO, LRU, and LFU, yield varying hit rates, particularly influenced by aggressive user patterns. Recommendations suggest further investigation into user behaviors for improved caching strategies to enhance data processing and image distribution.


![Coded Agents – with UiPath SDK + LangGraph [Virtual Hands-on Workshop]](https://cdn.slidesharecdn.com/ss_thumbnails/codedagentsdeck-251215155422-5497c599-thumbnail.jpg?width=640&height=640&fit=bounds)


