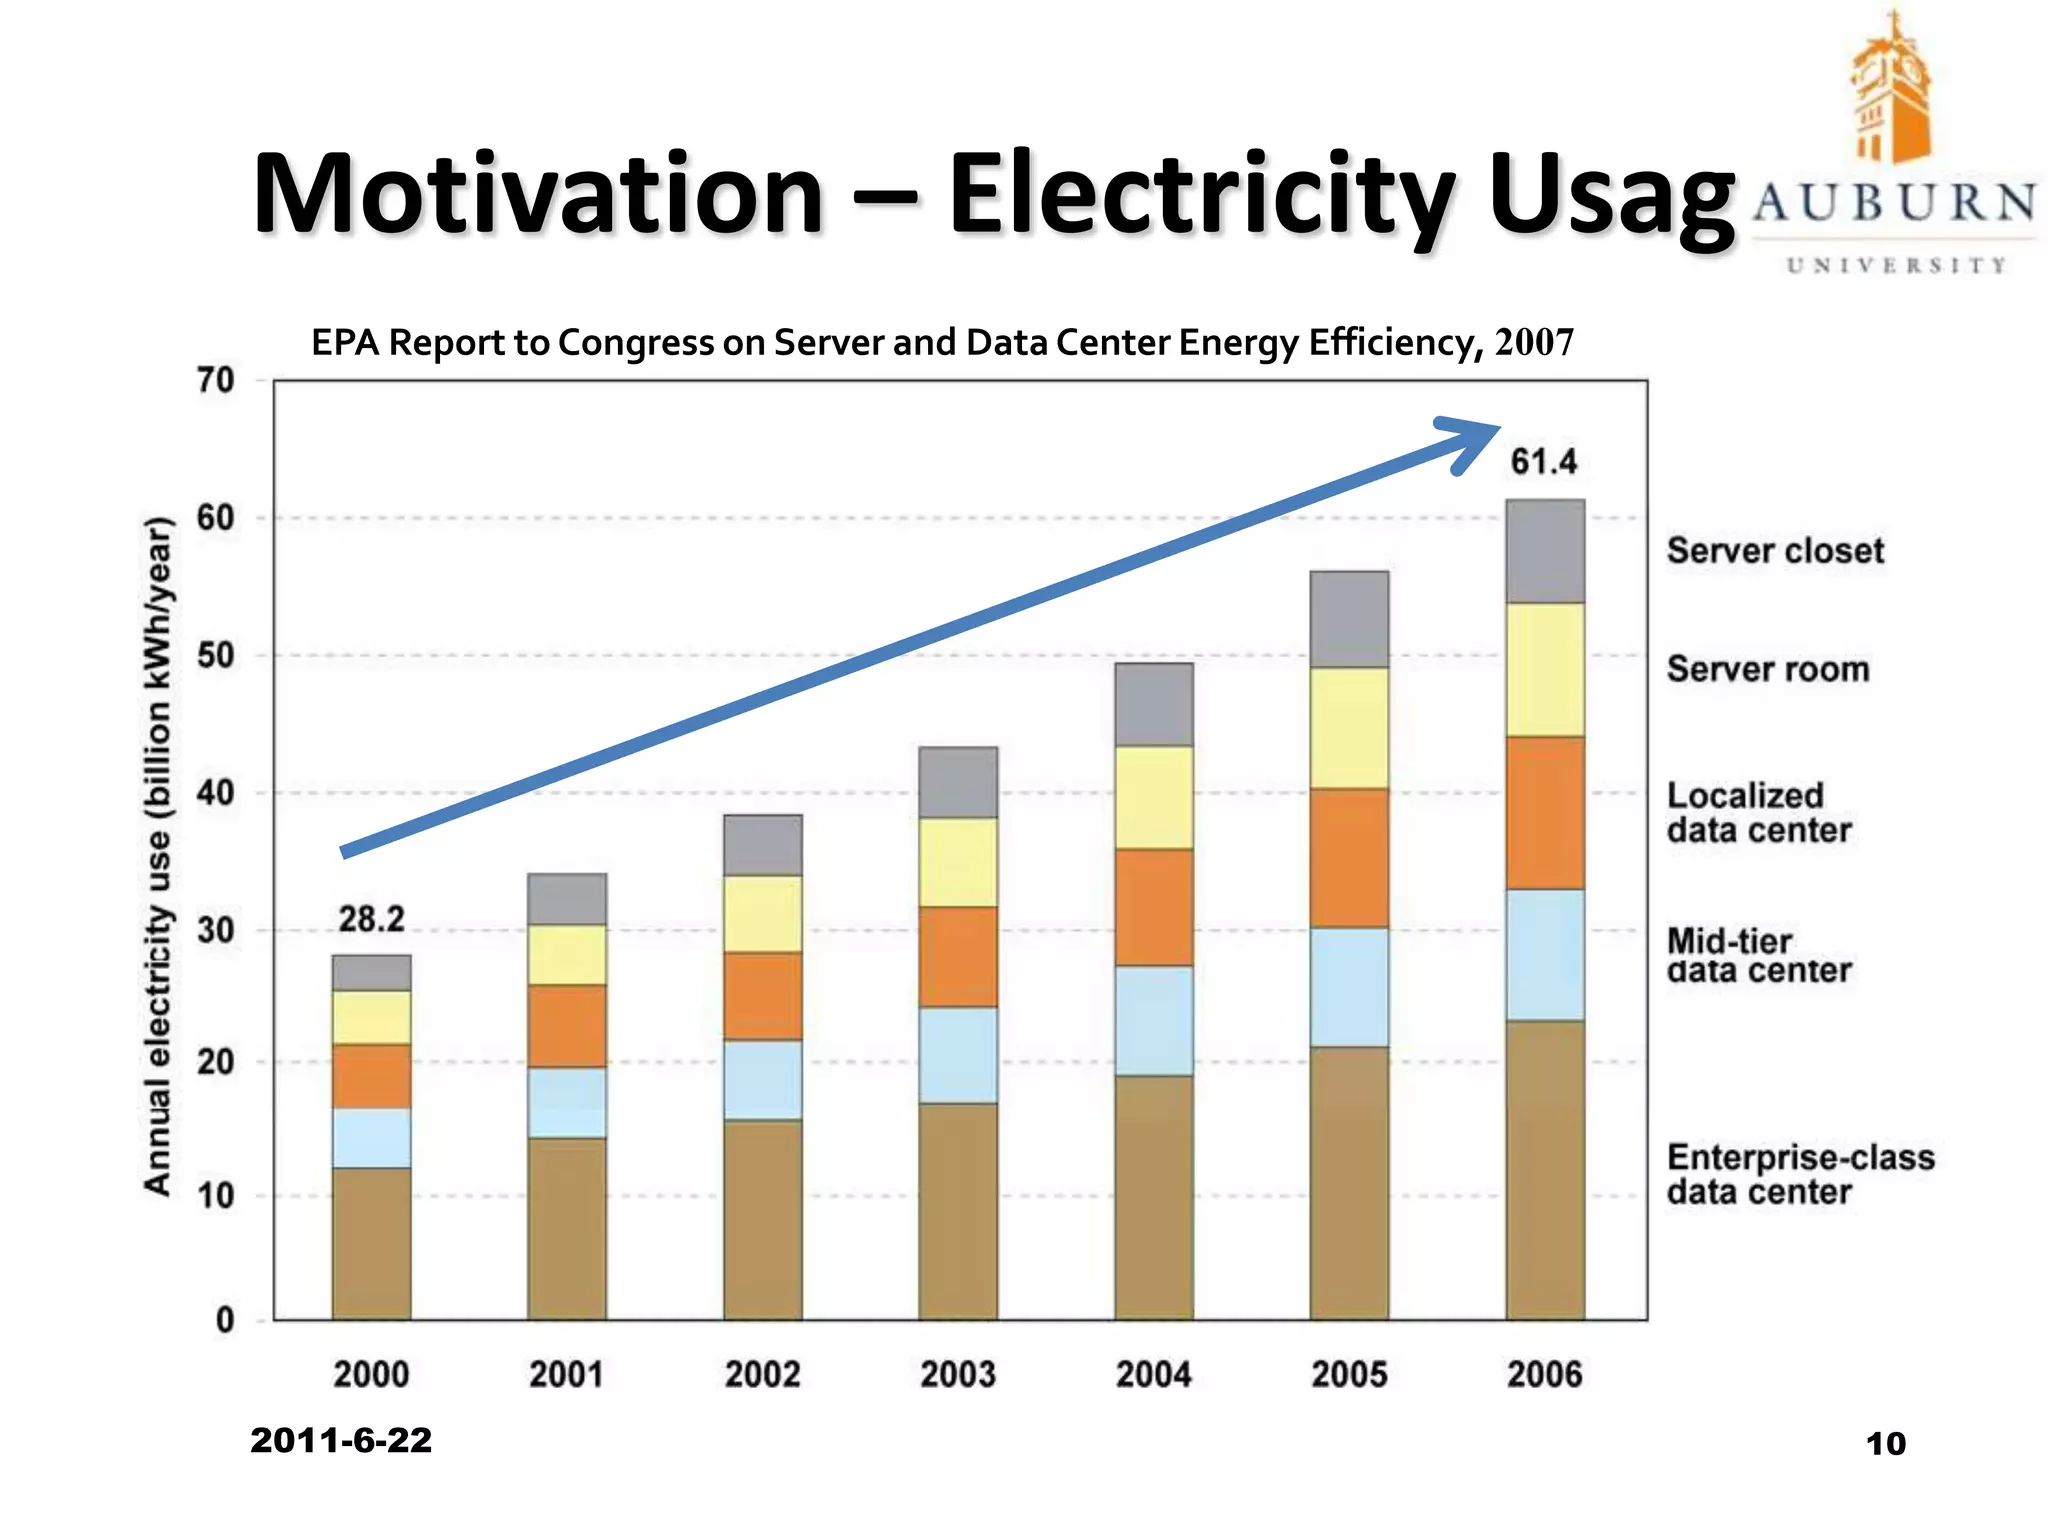
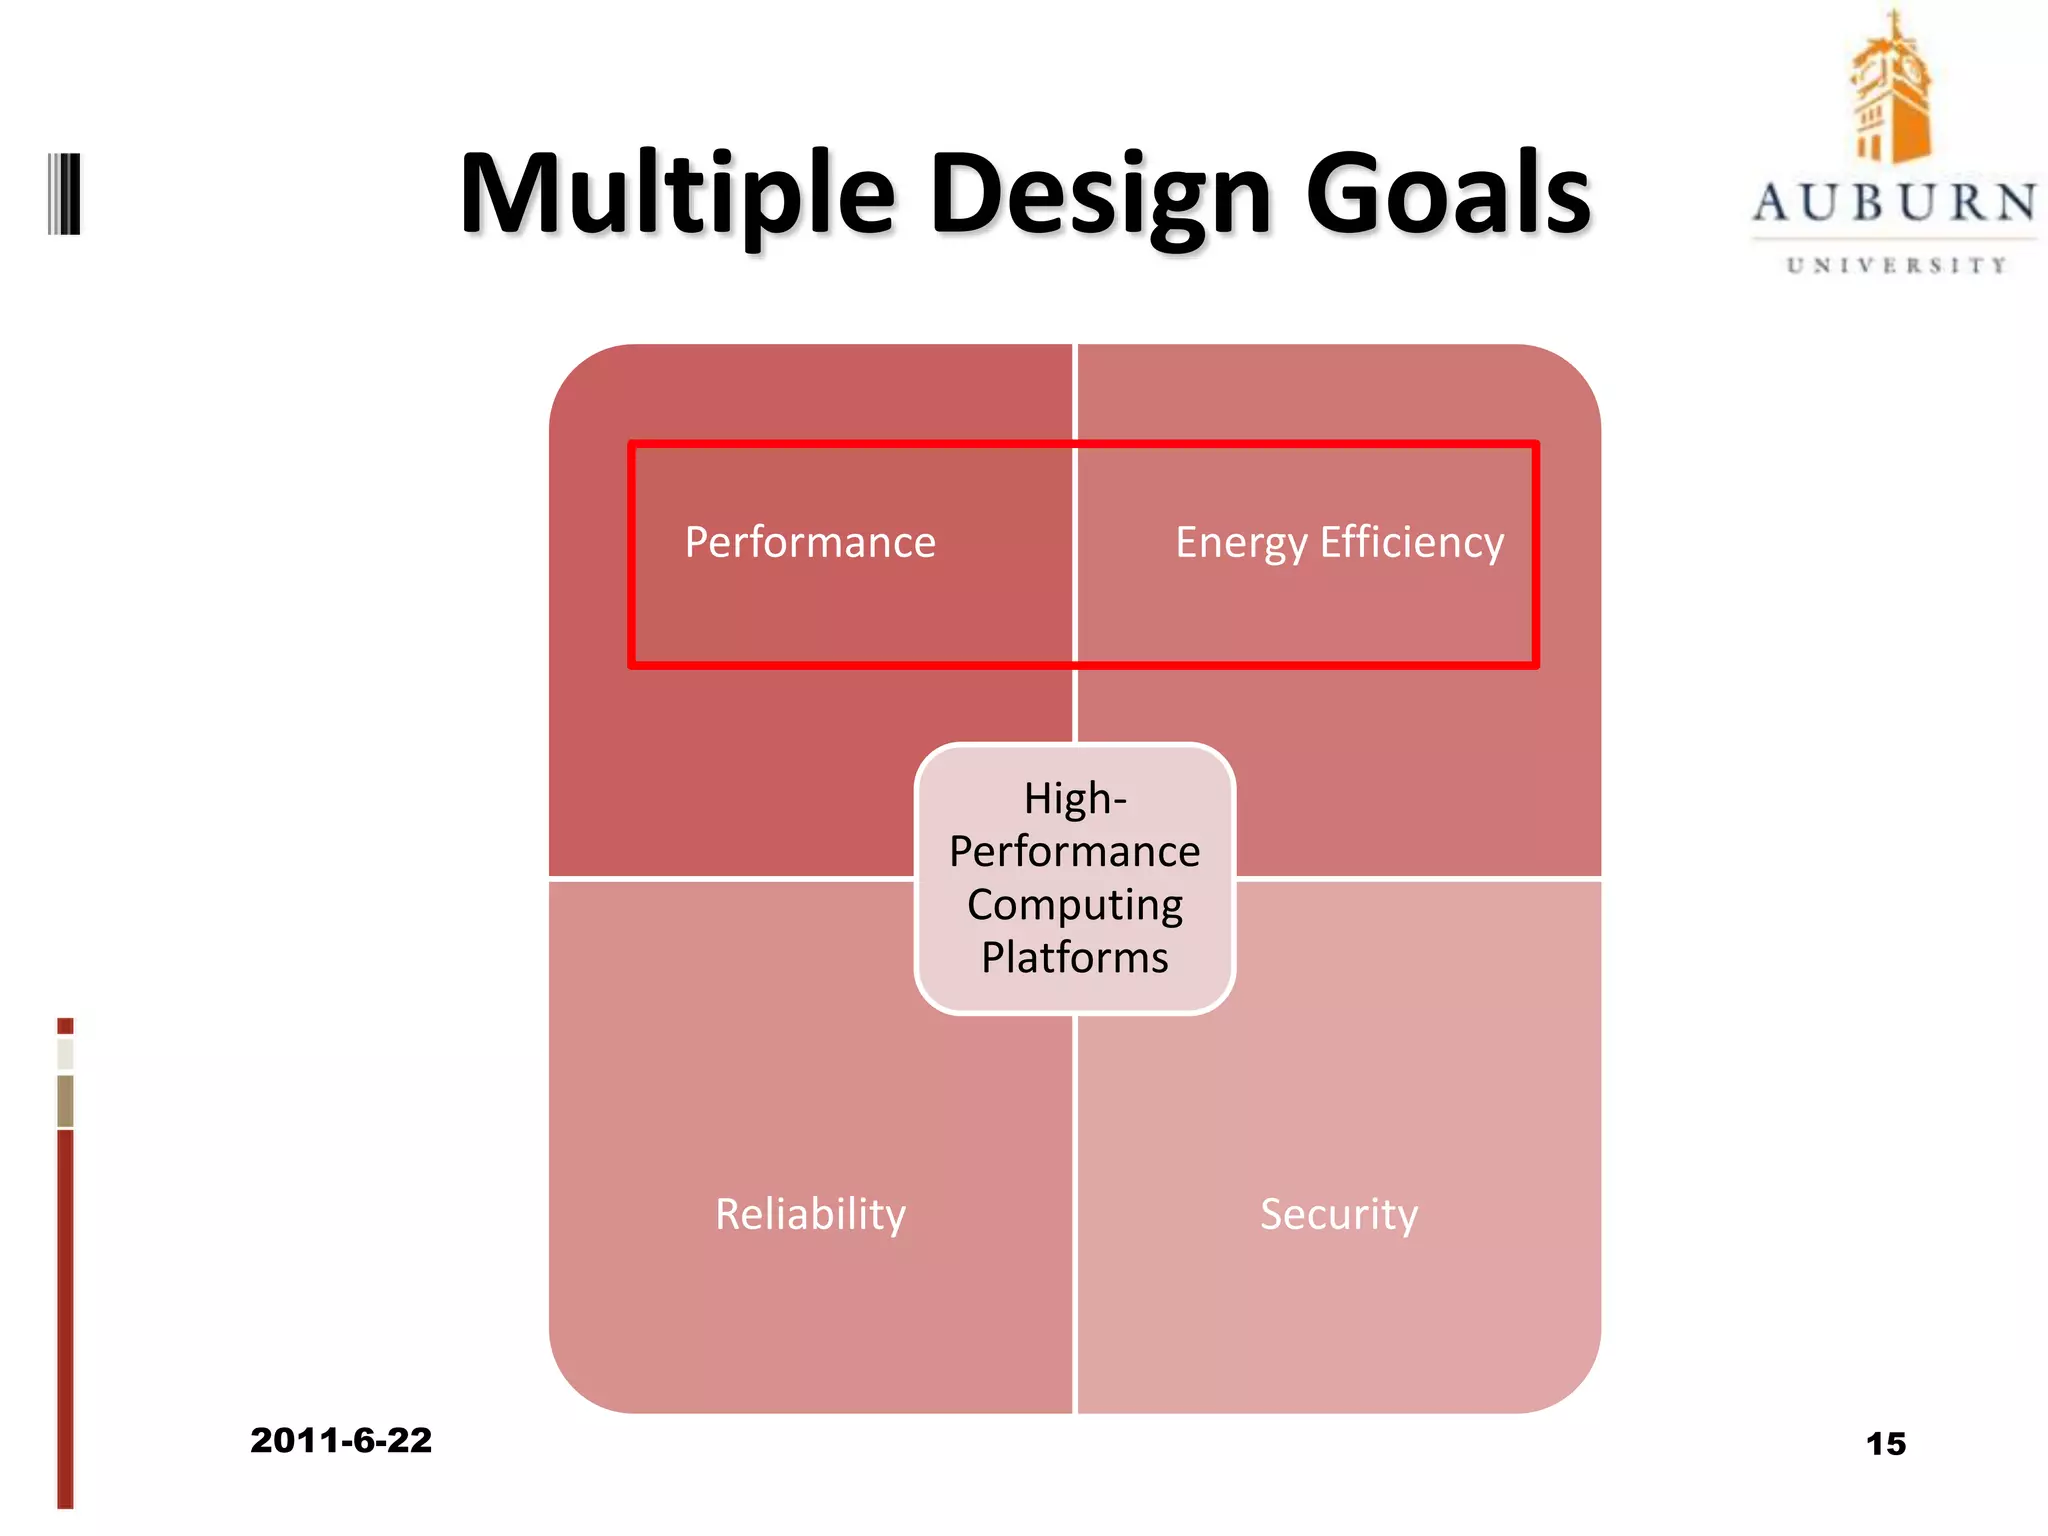
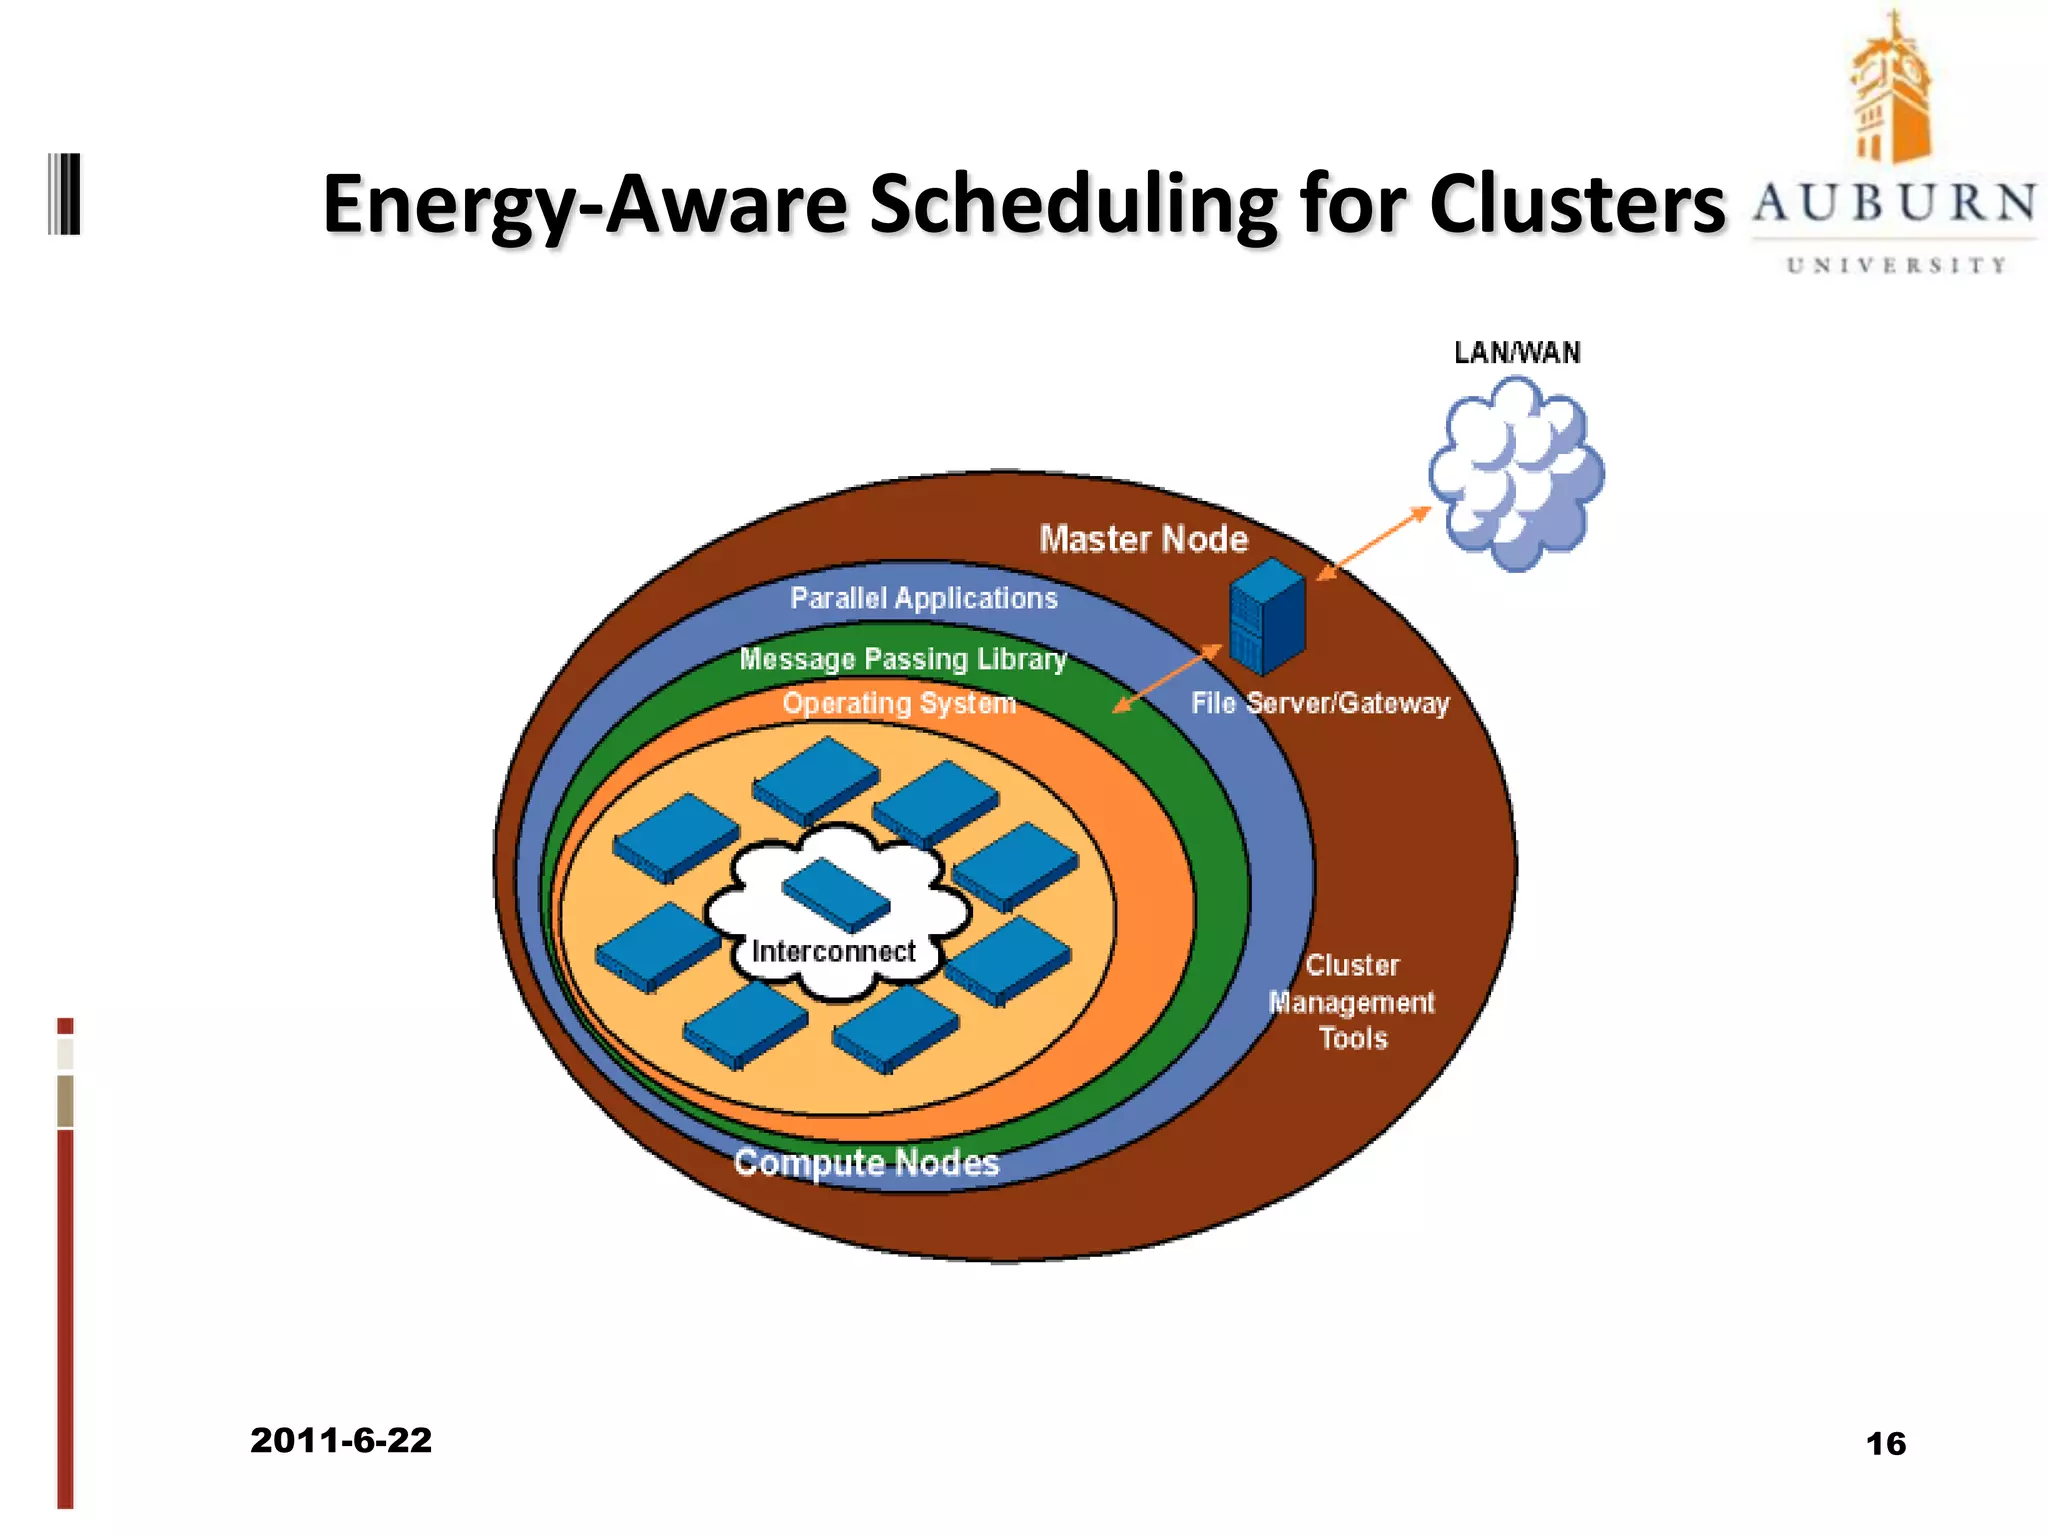
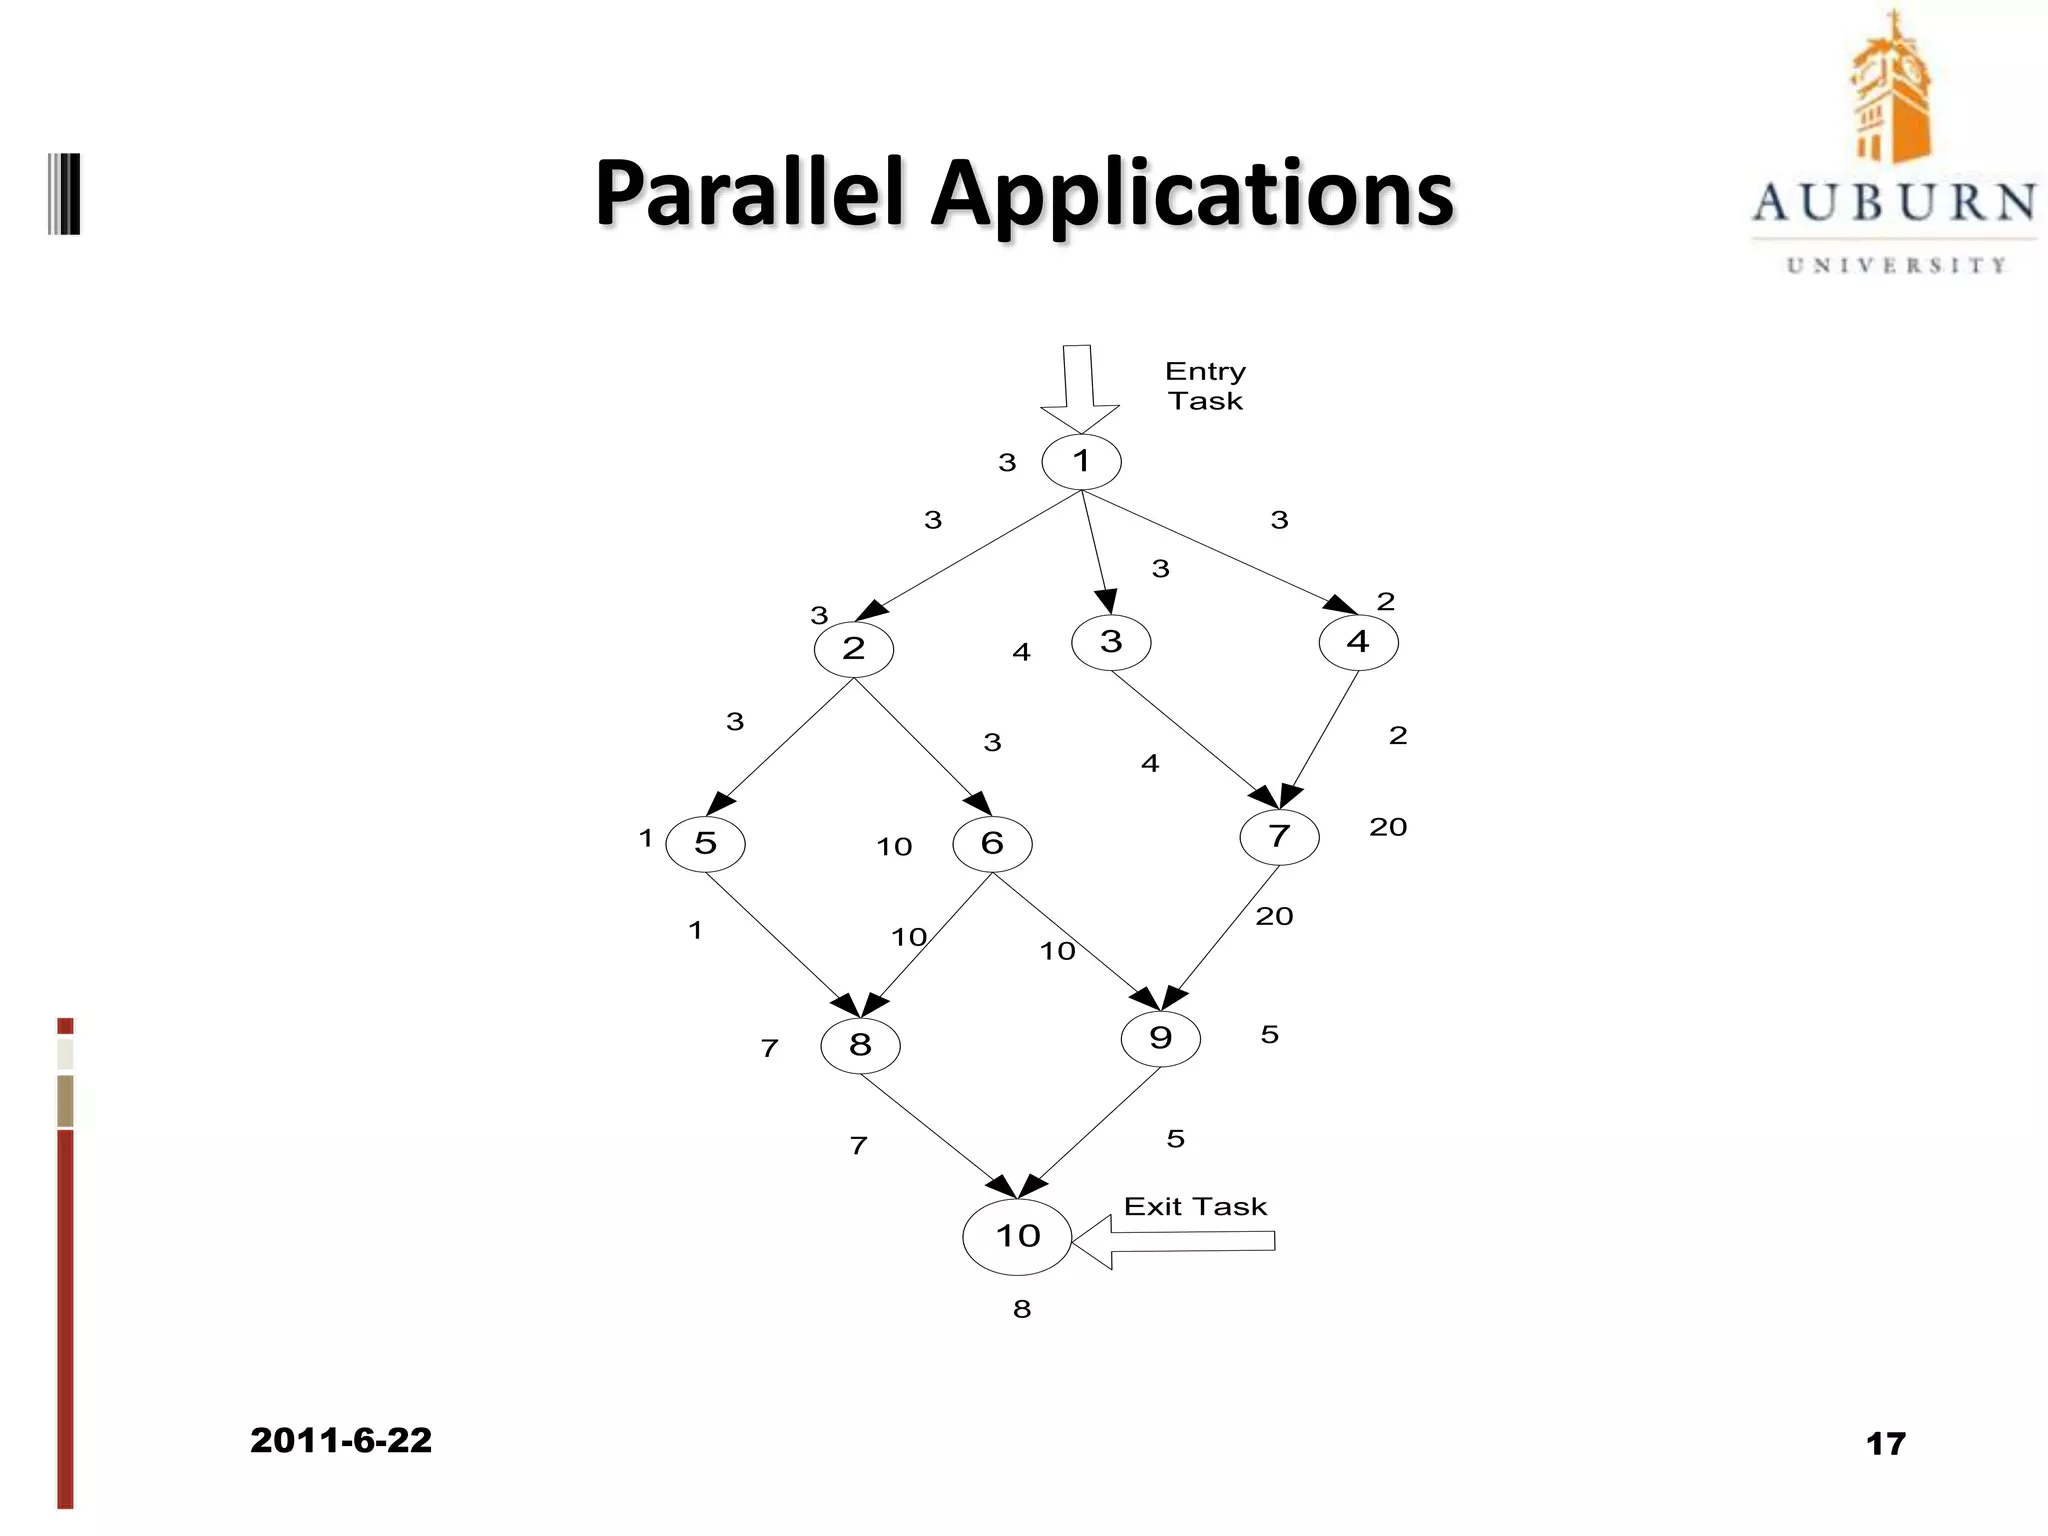
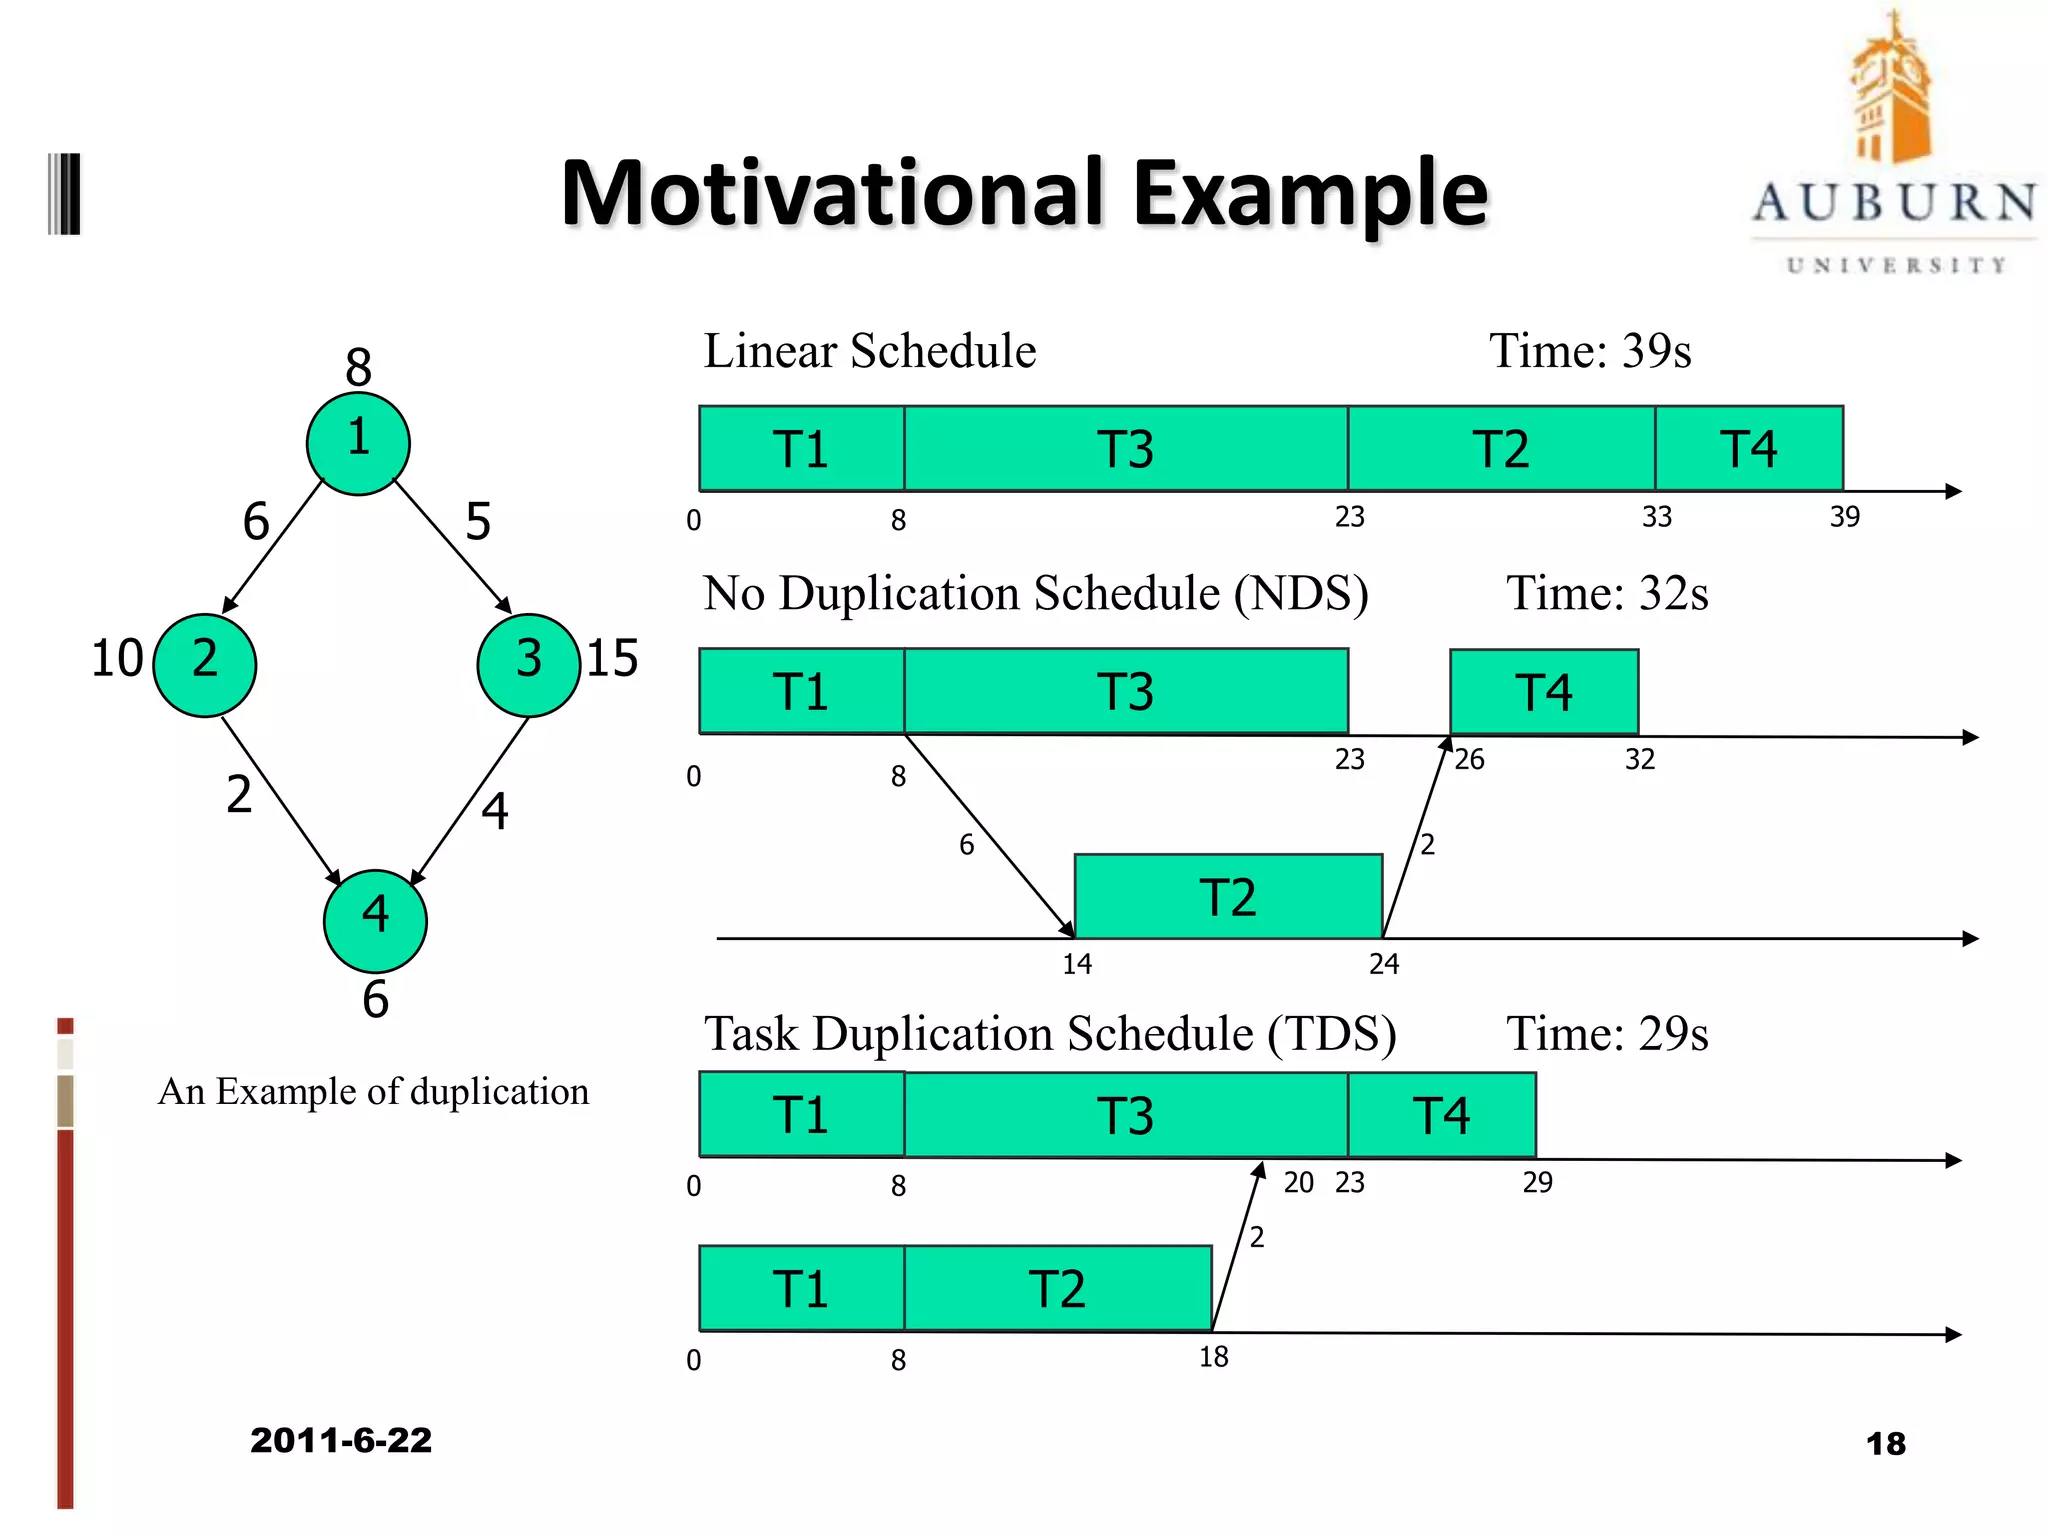
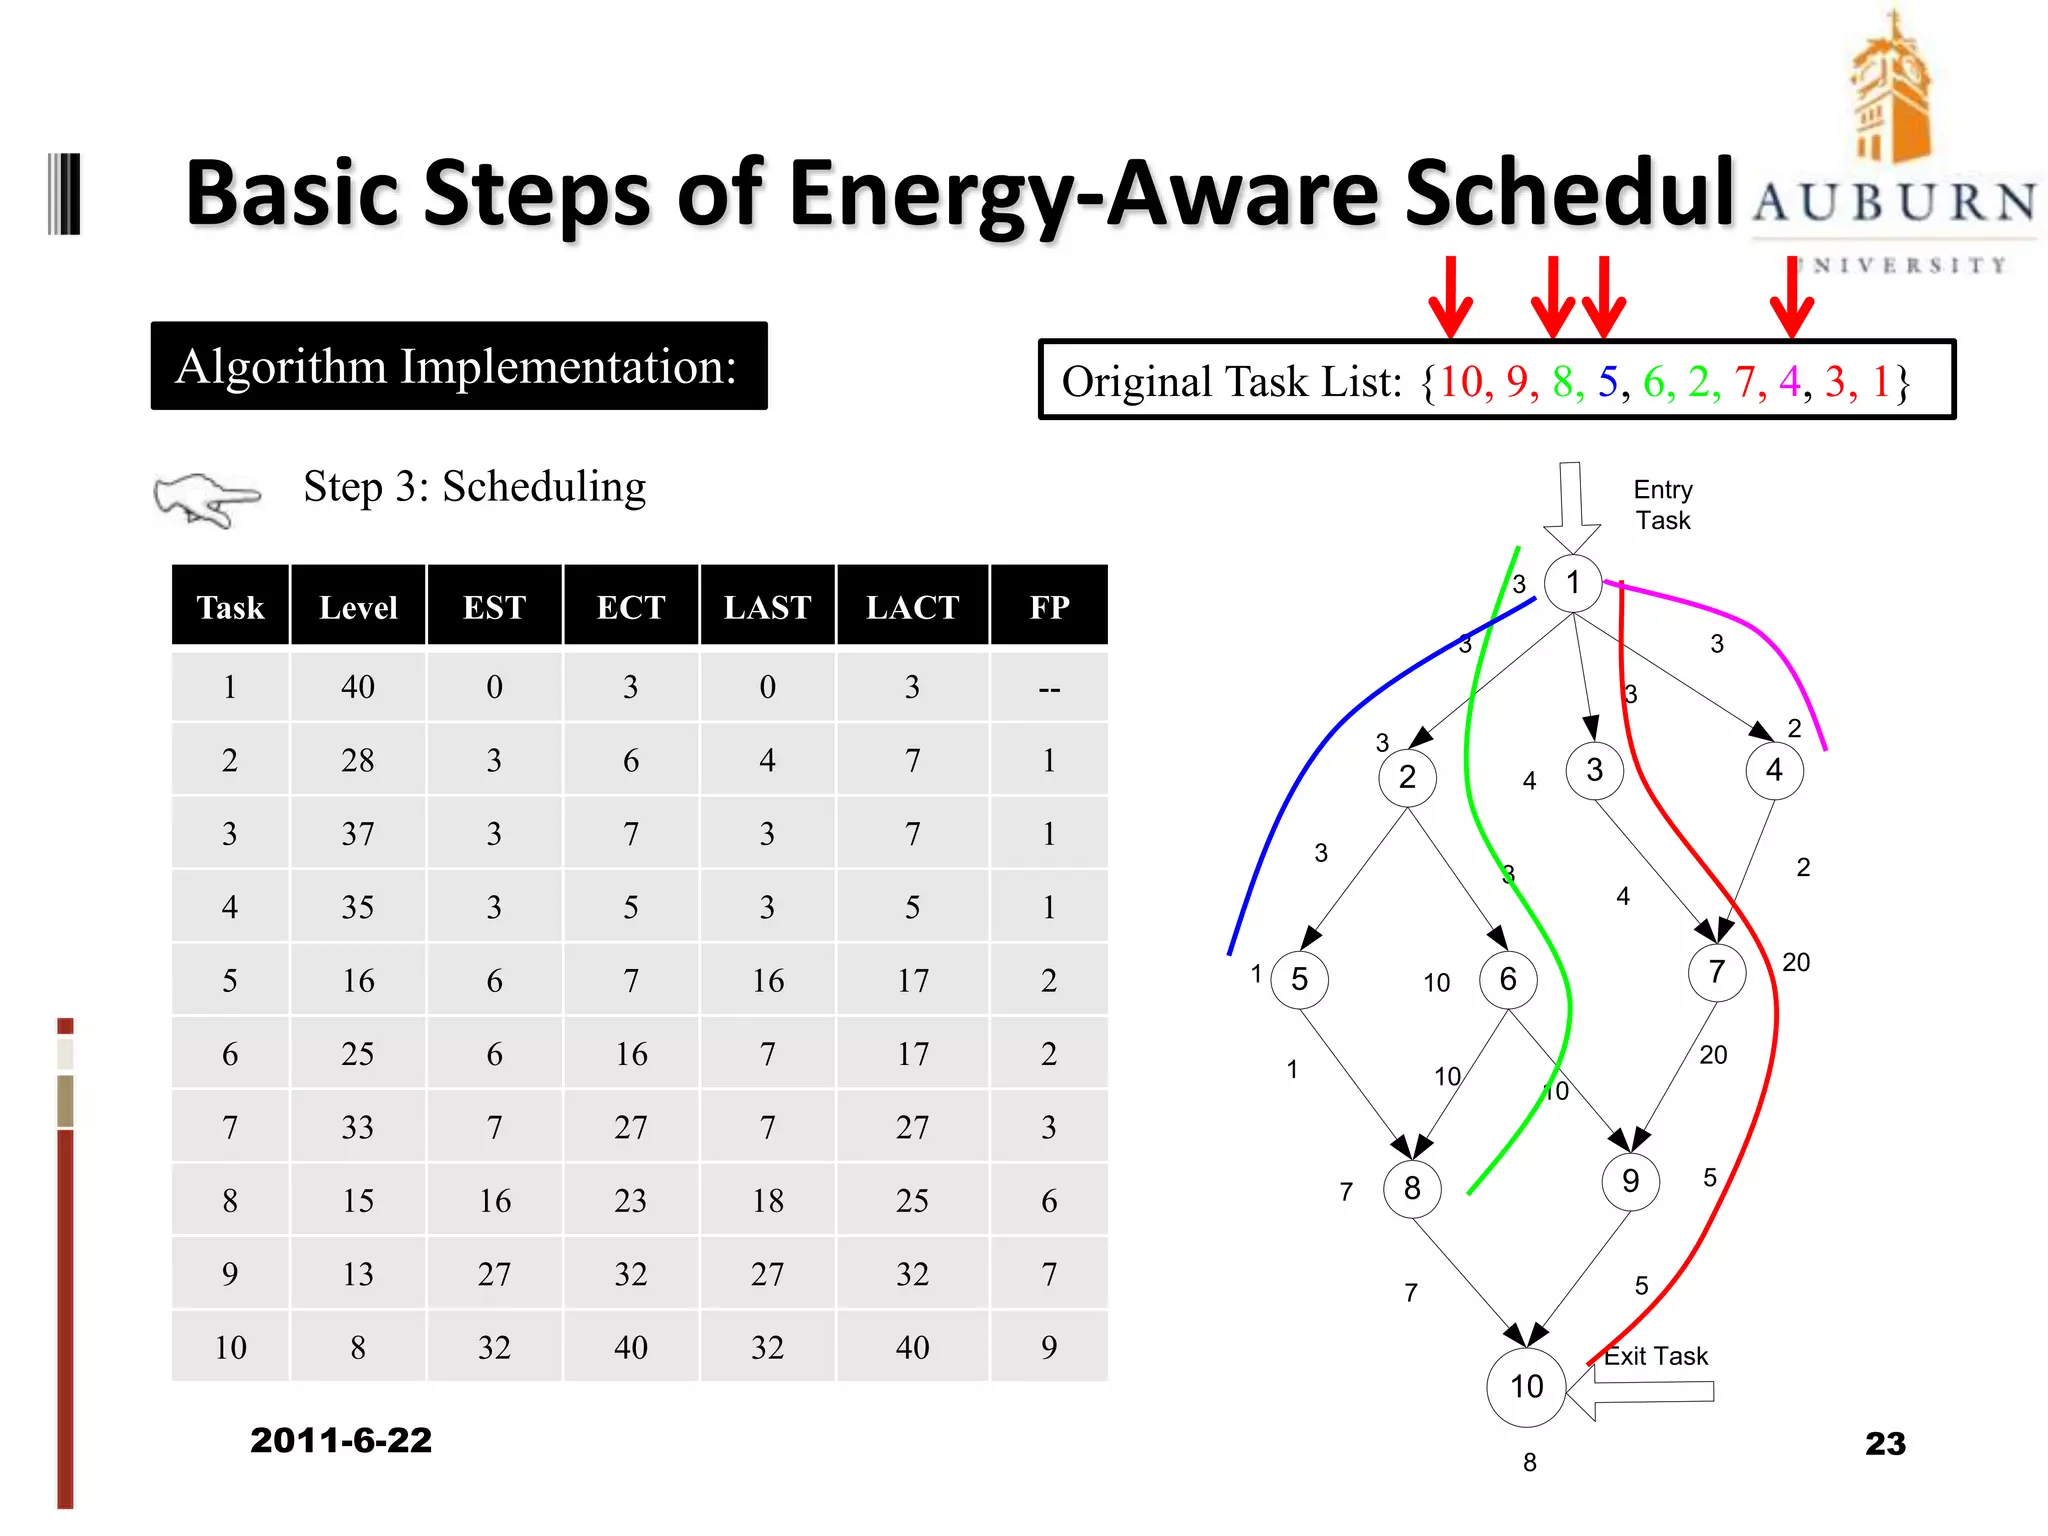
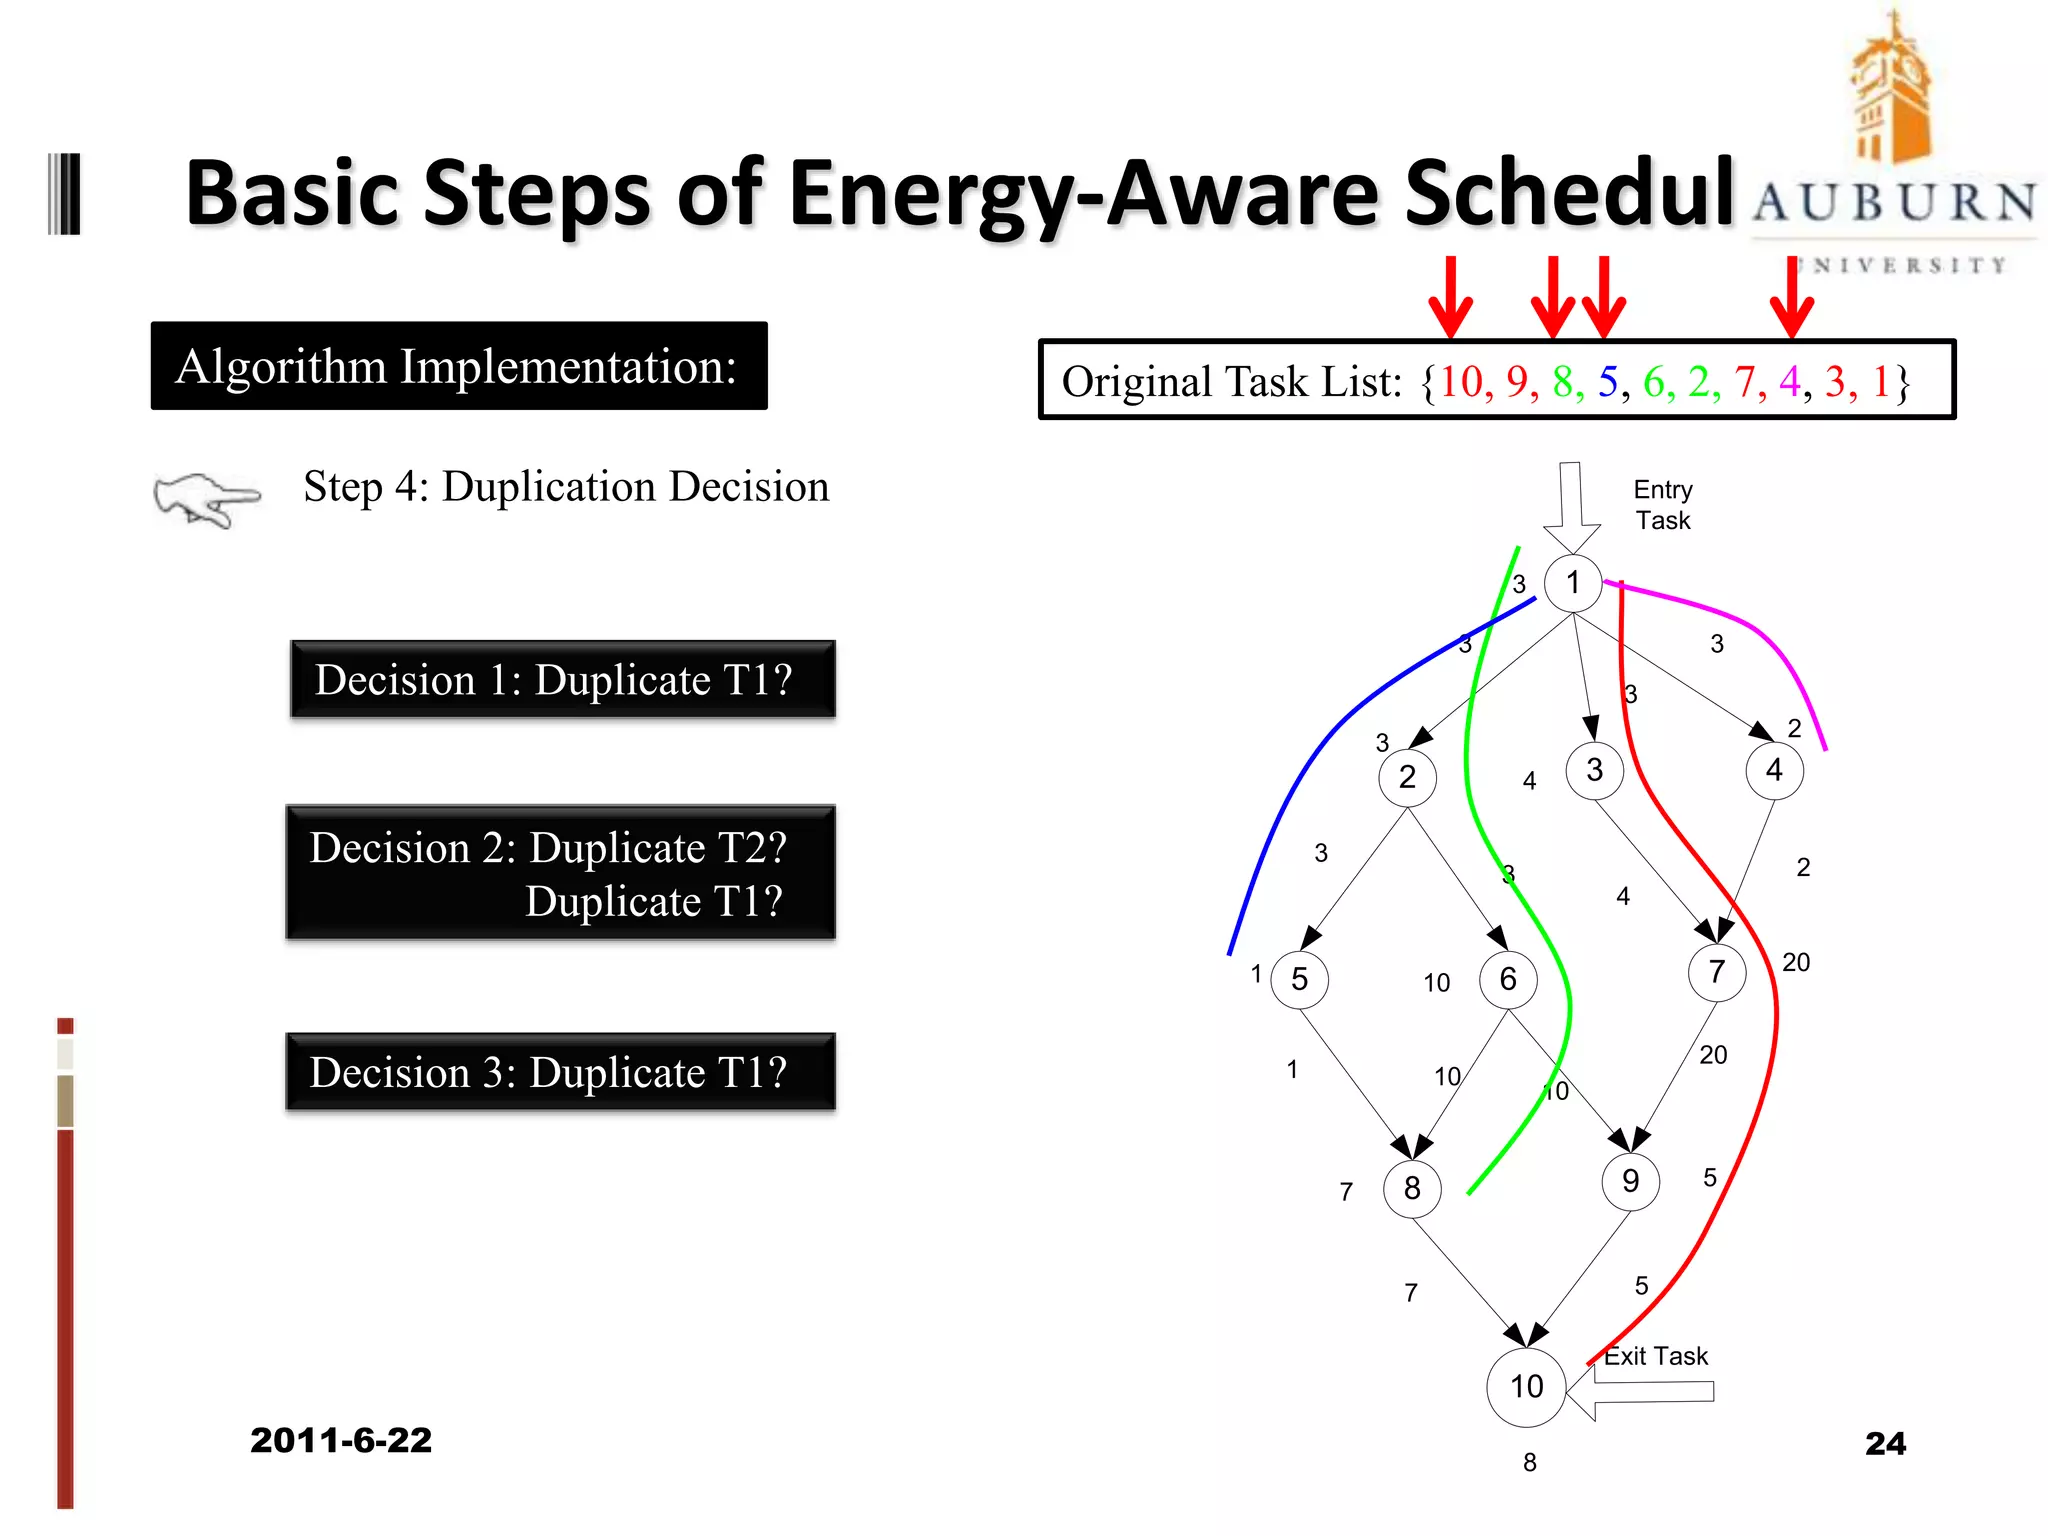
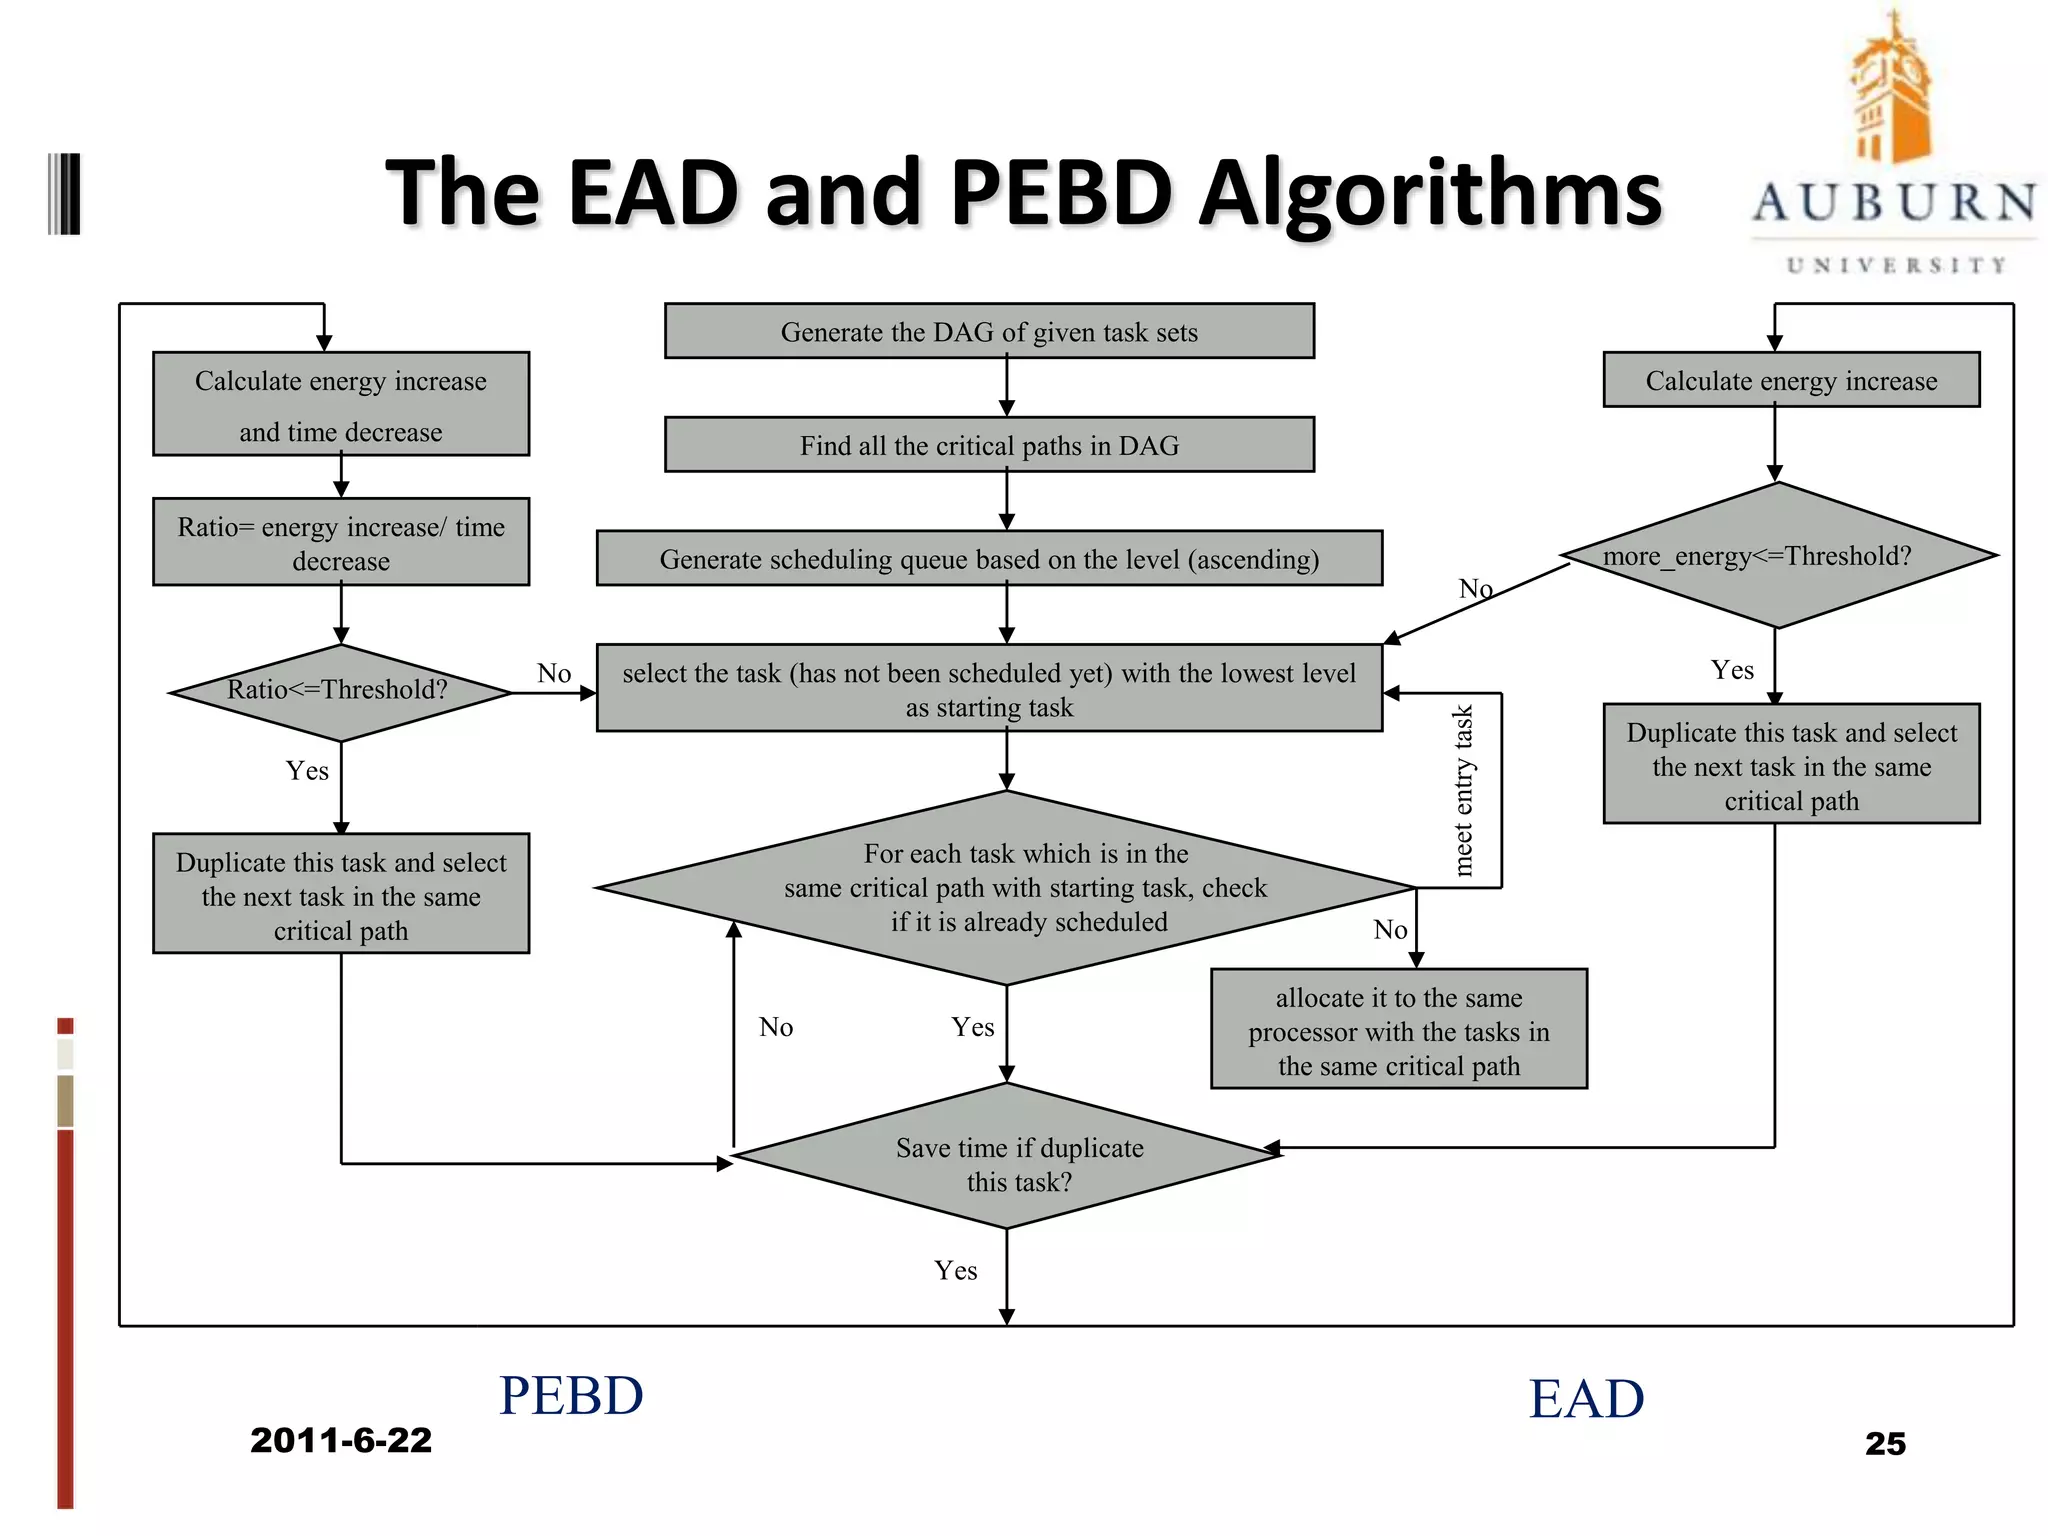
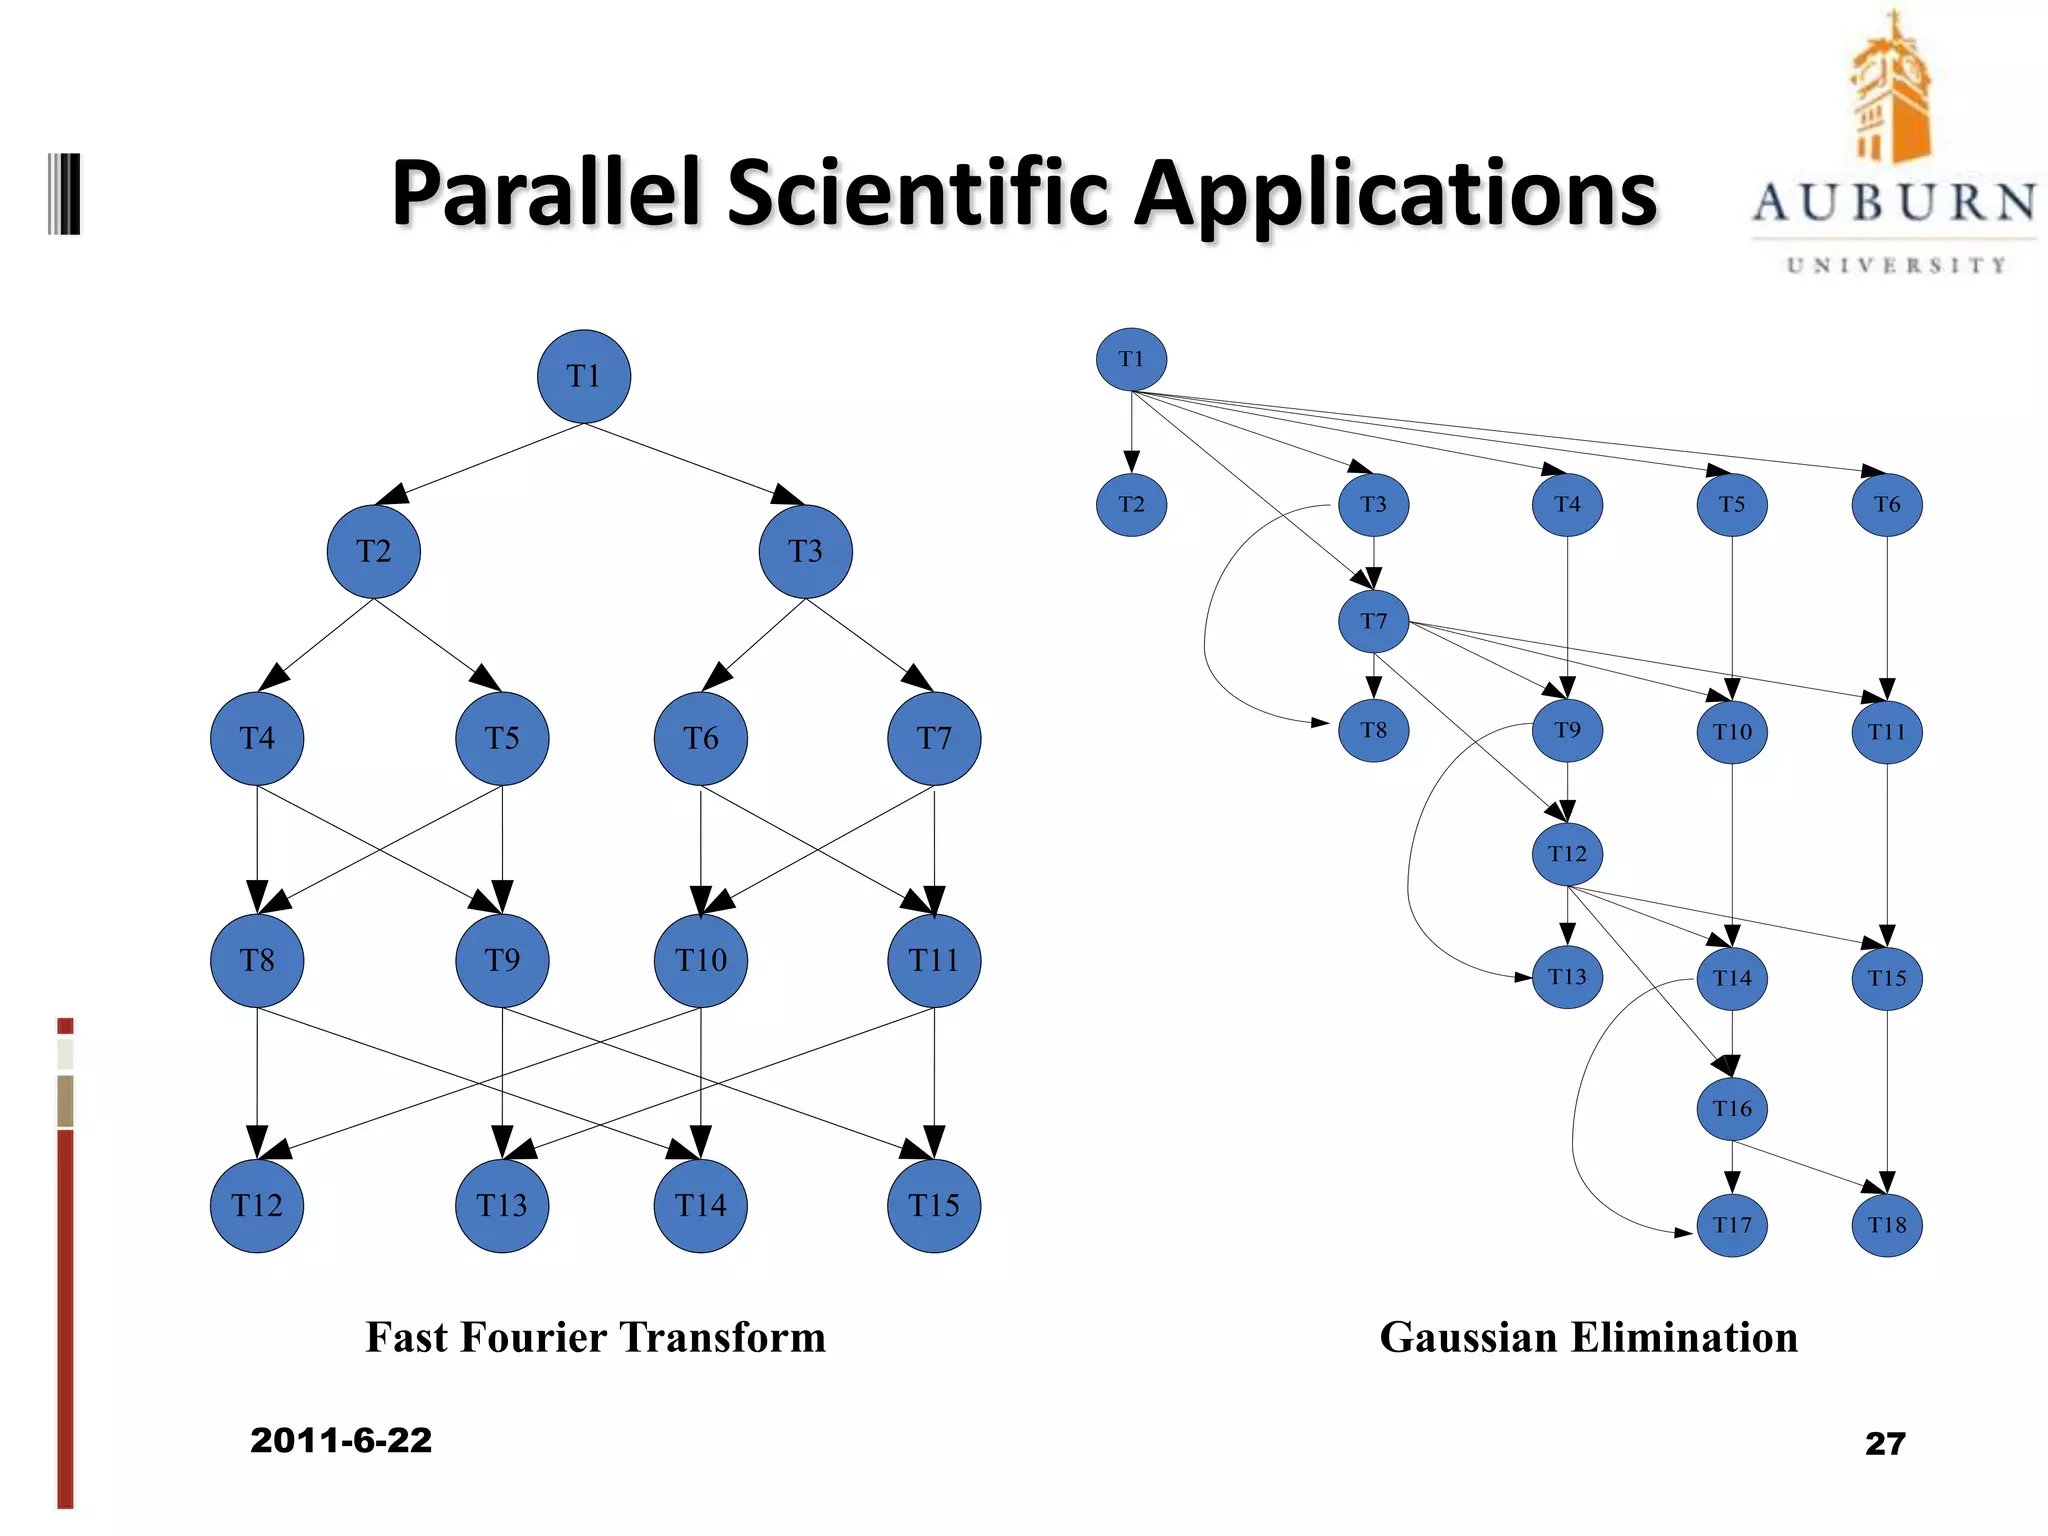
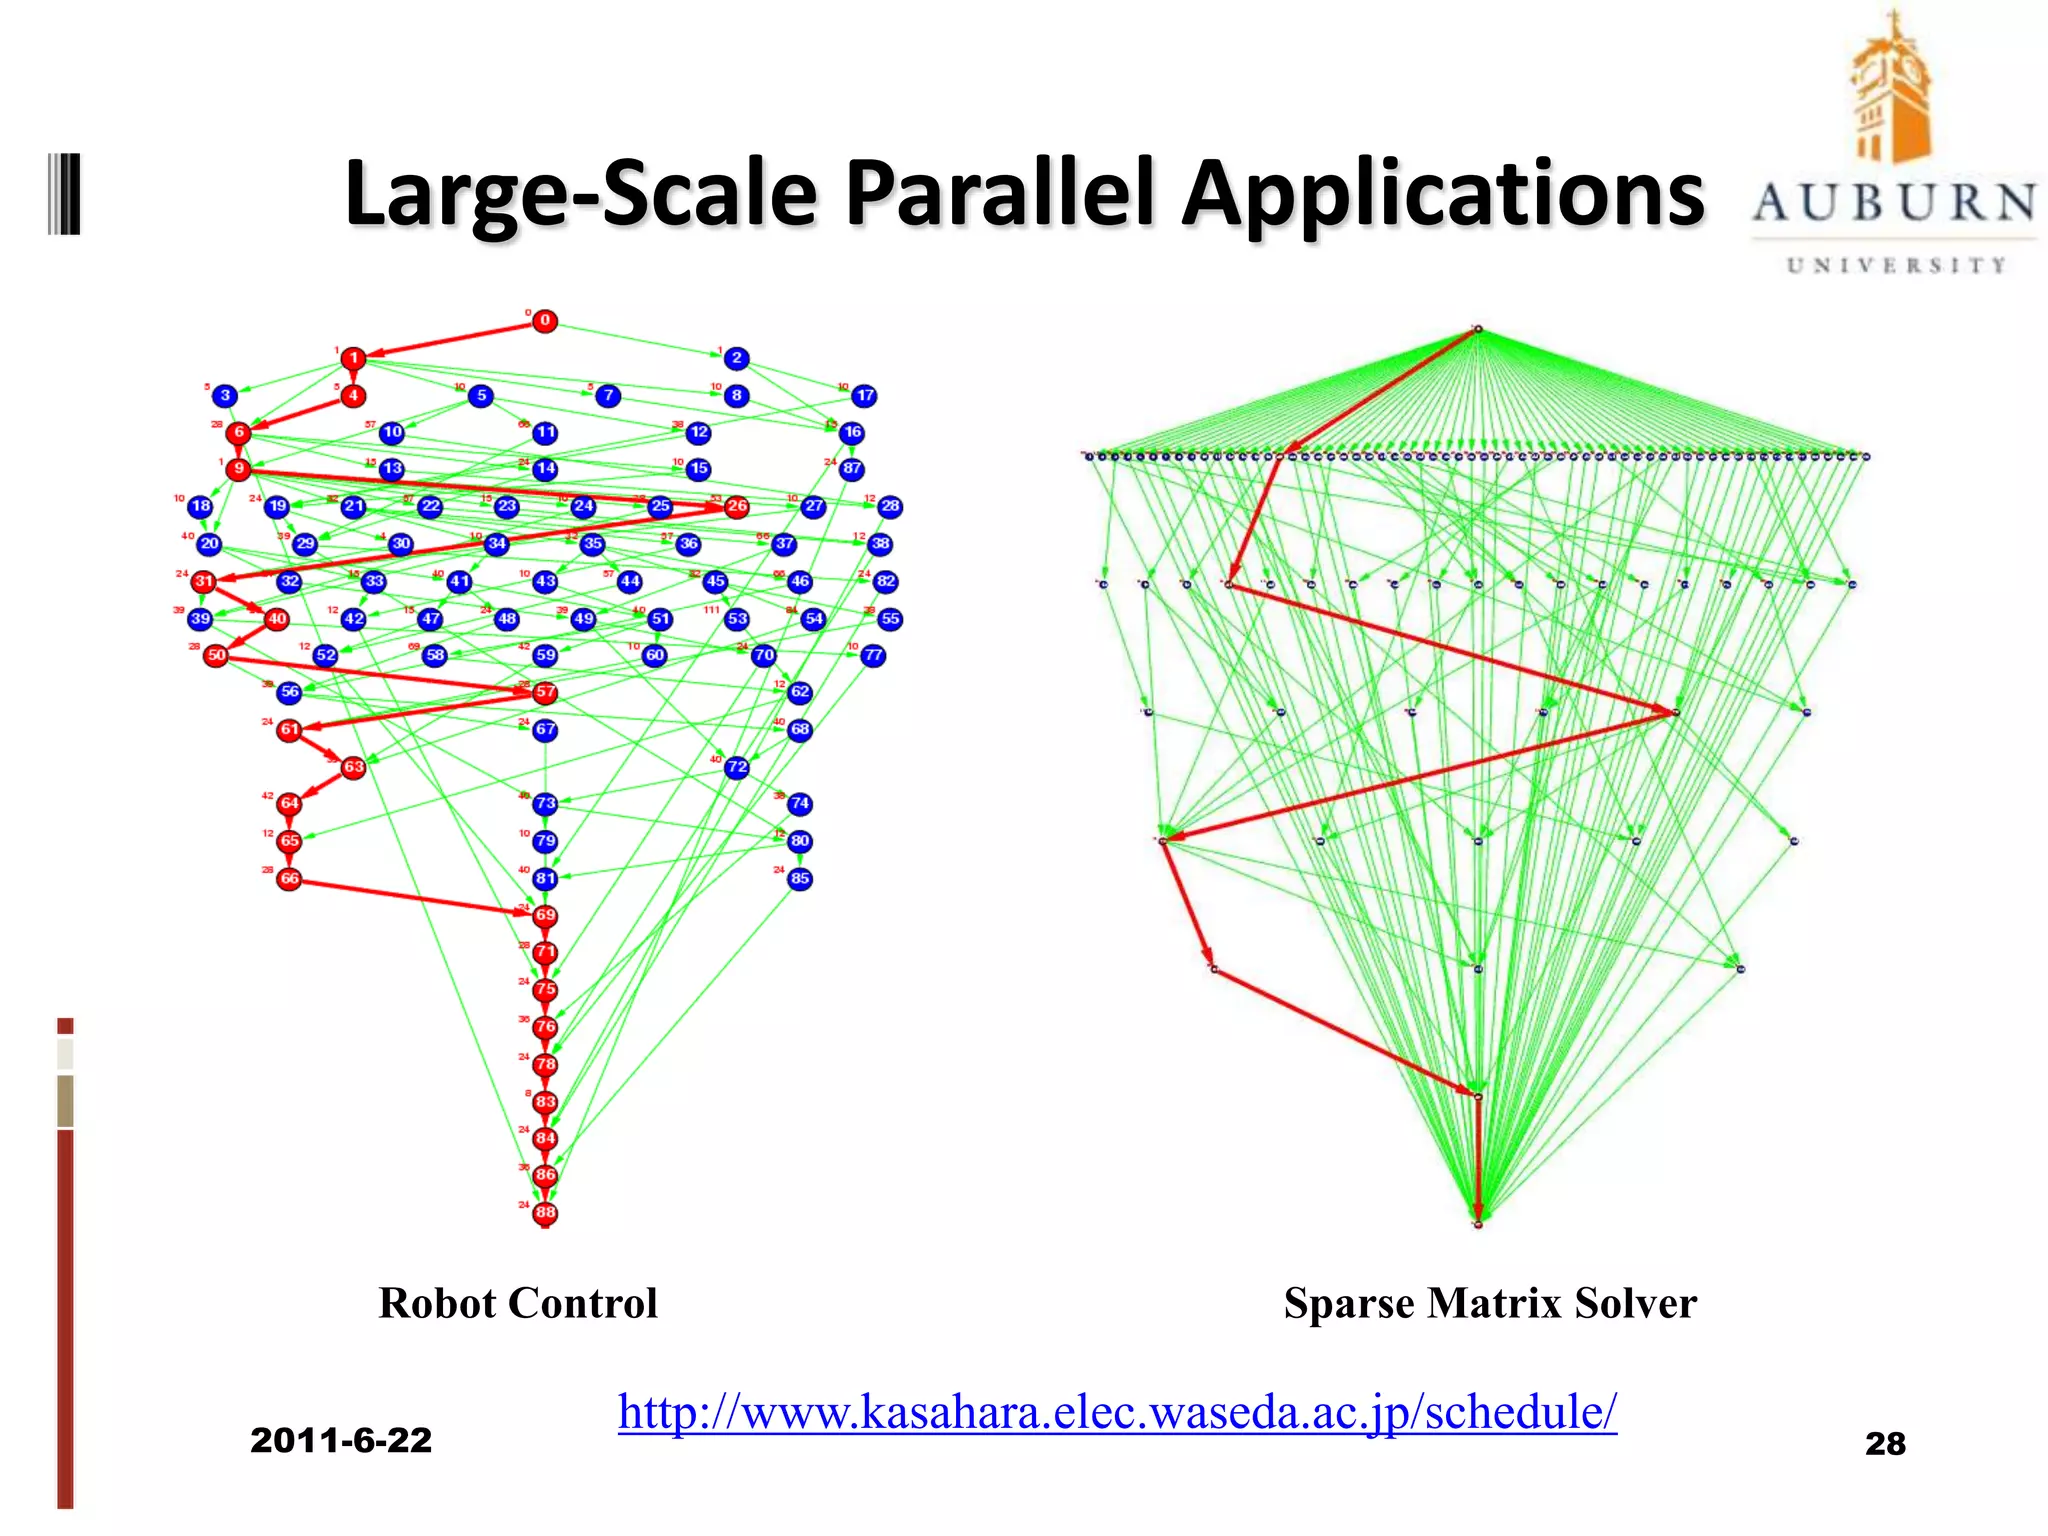
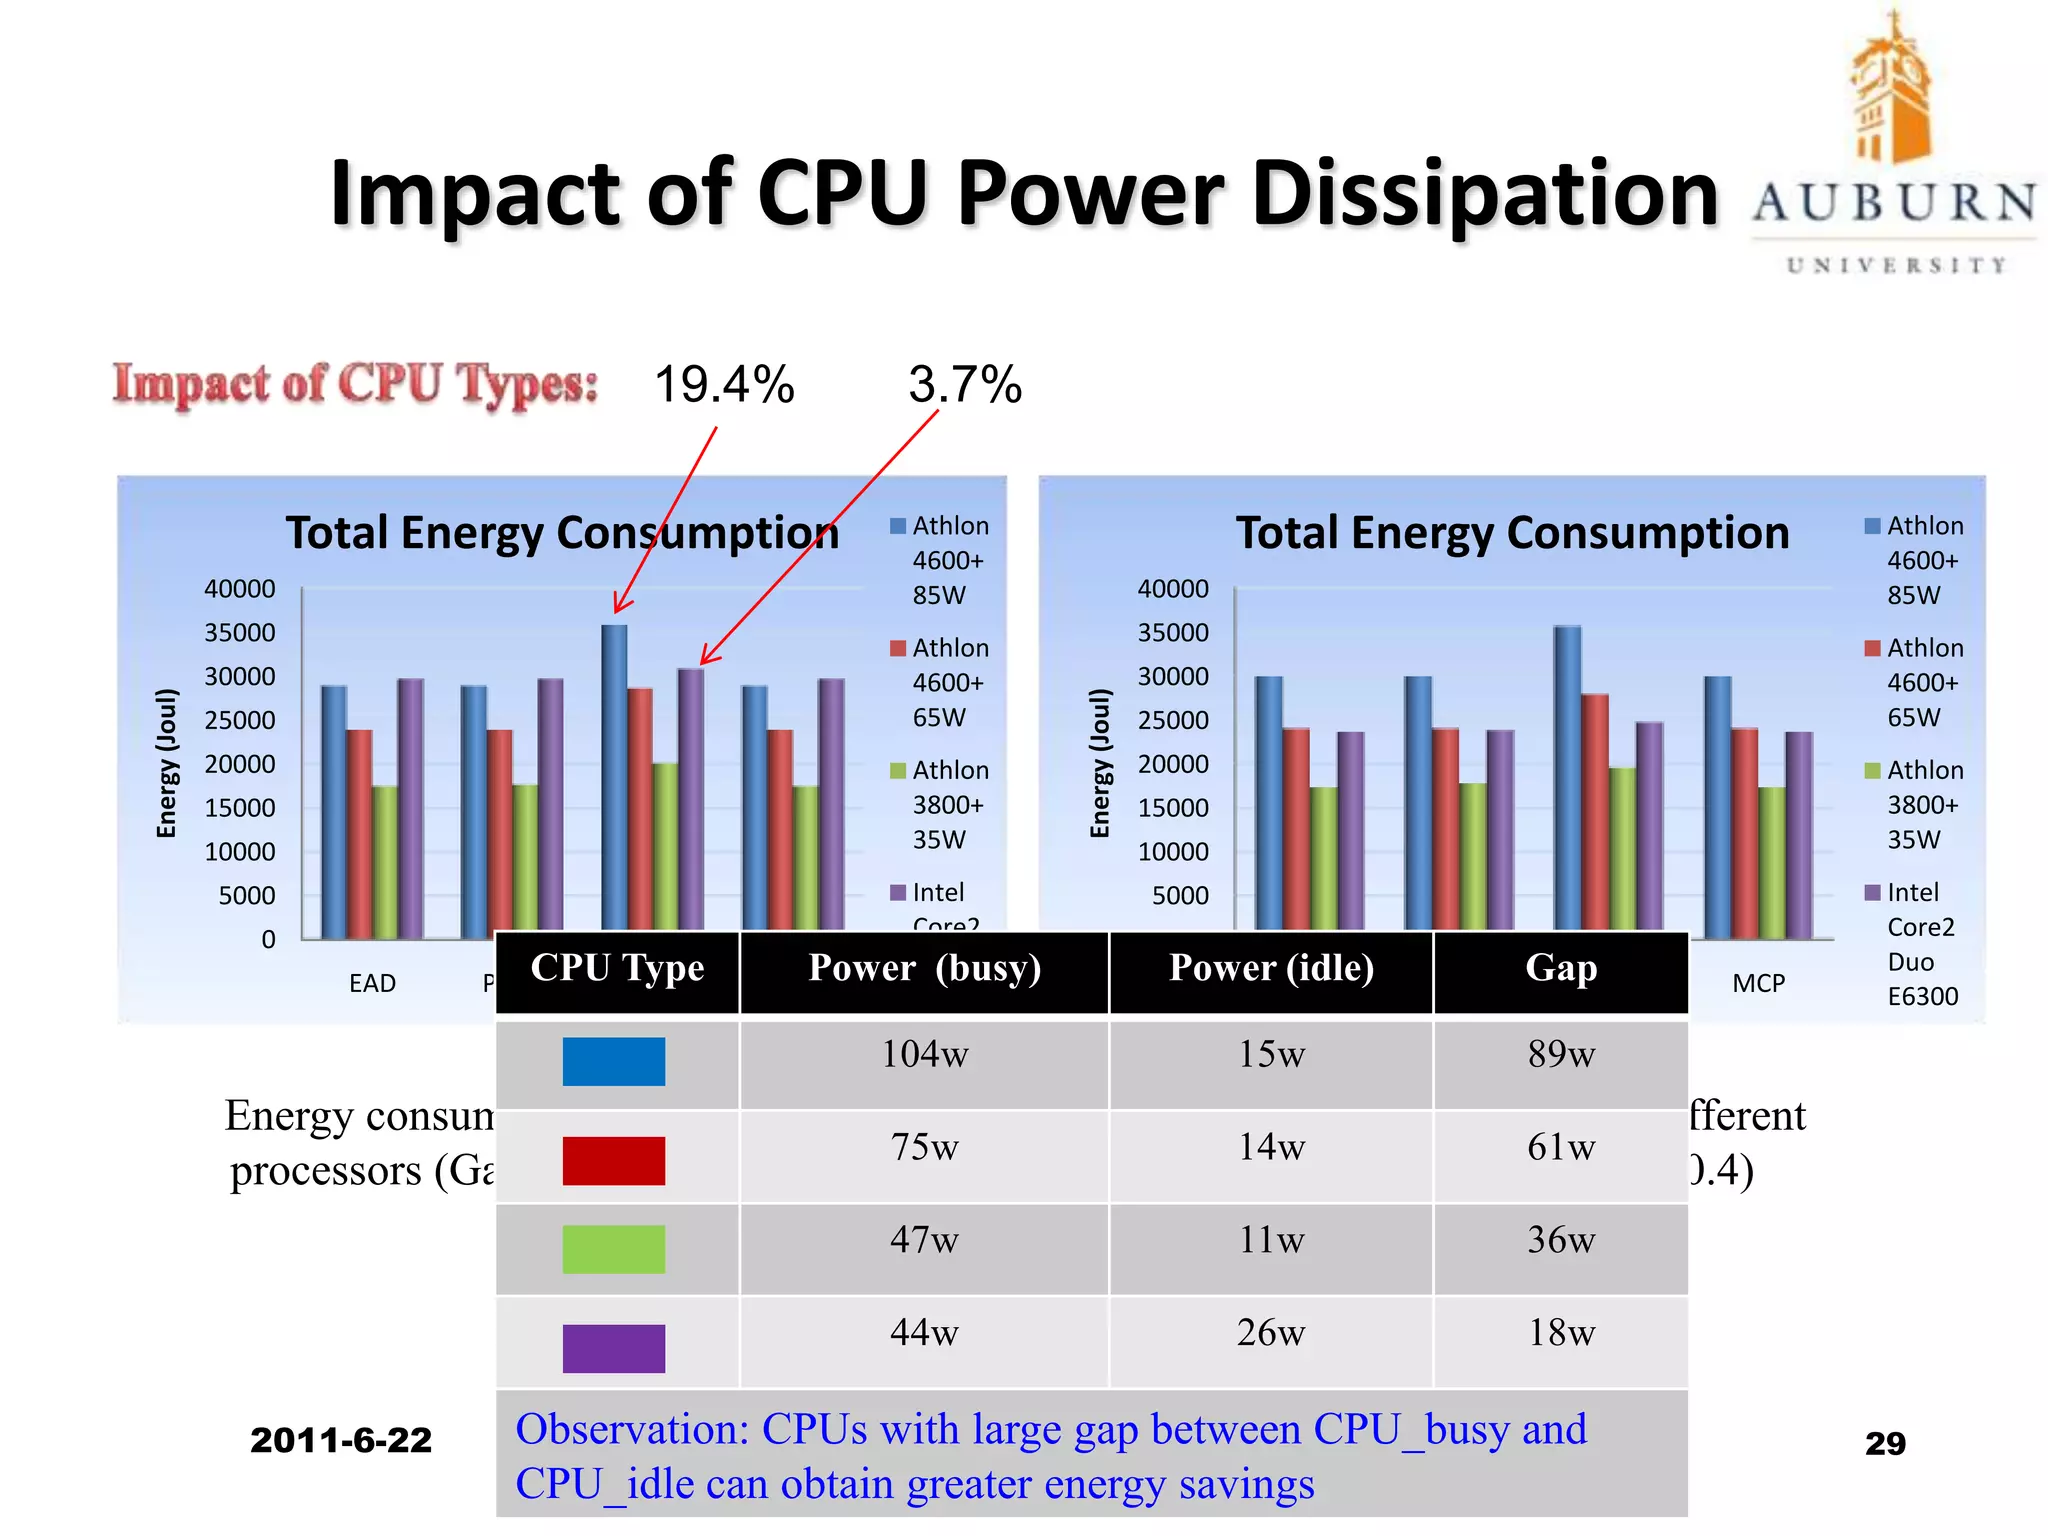
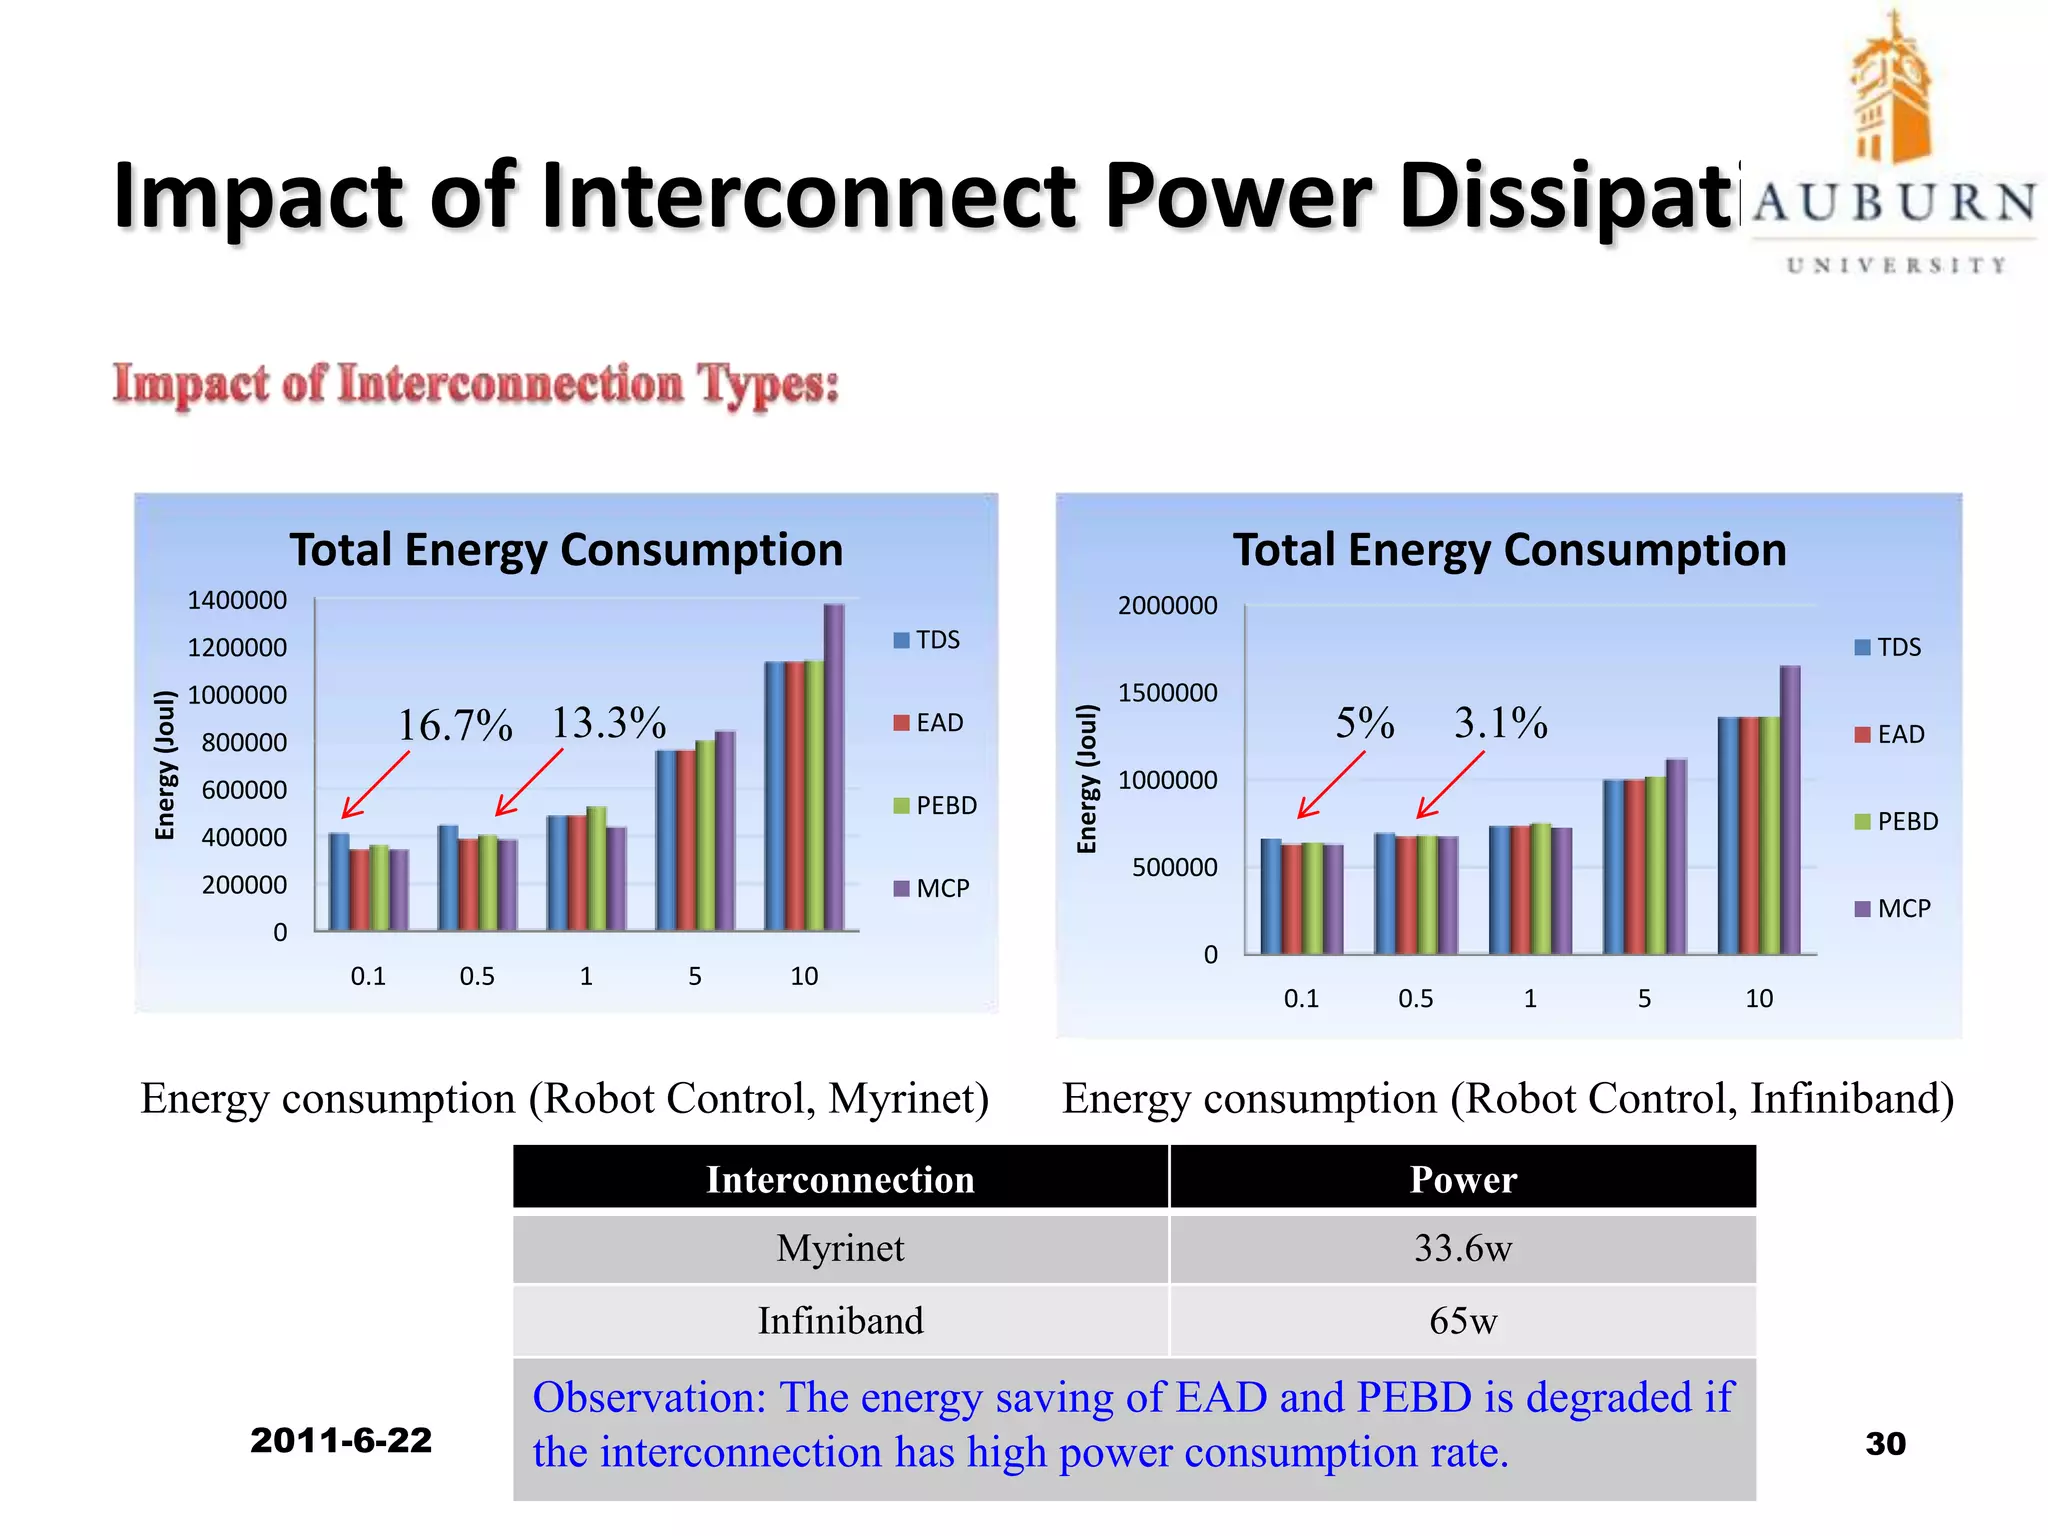
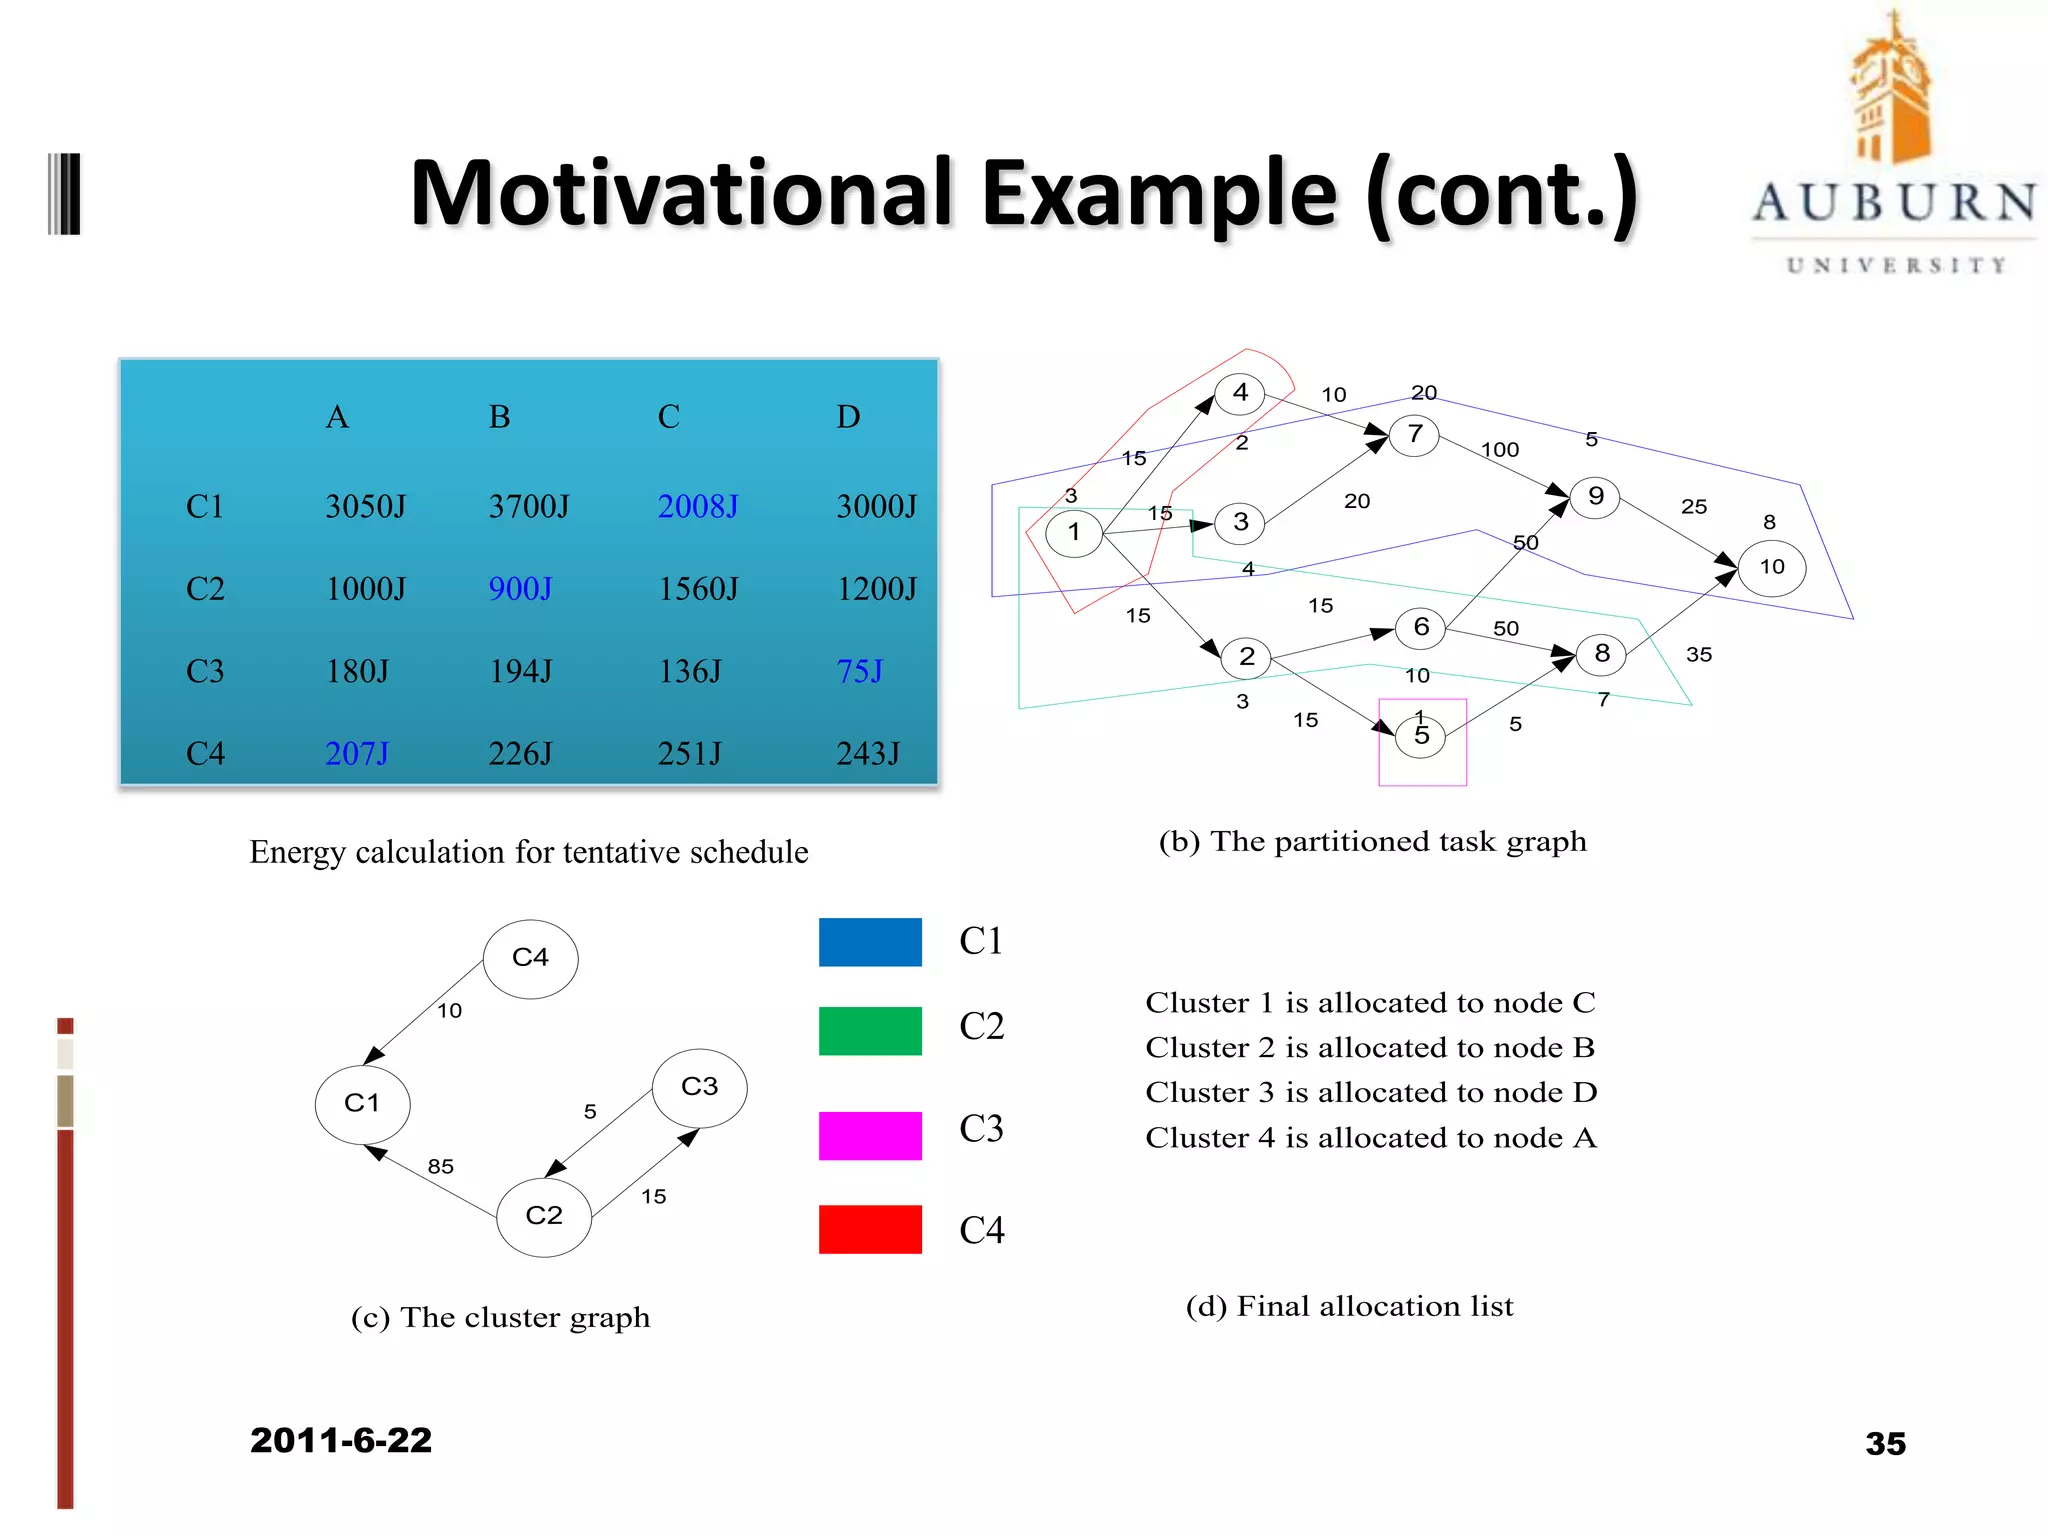
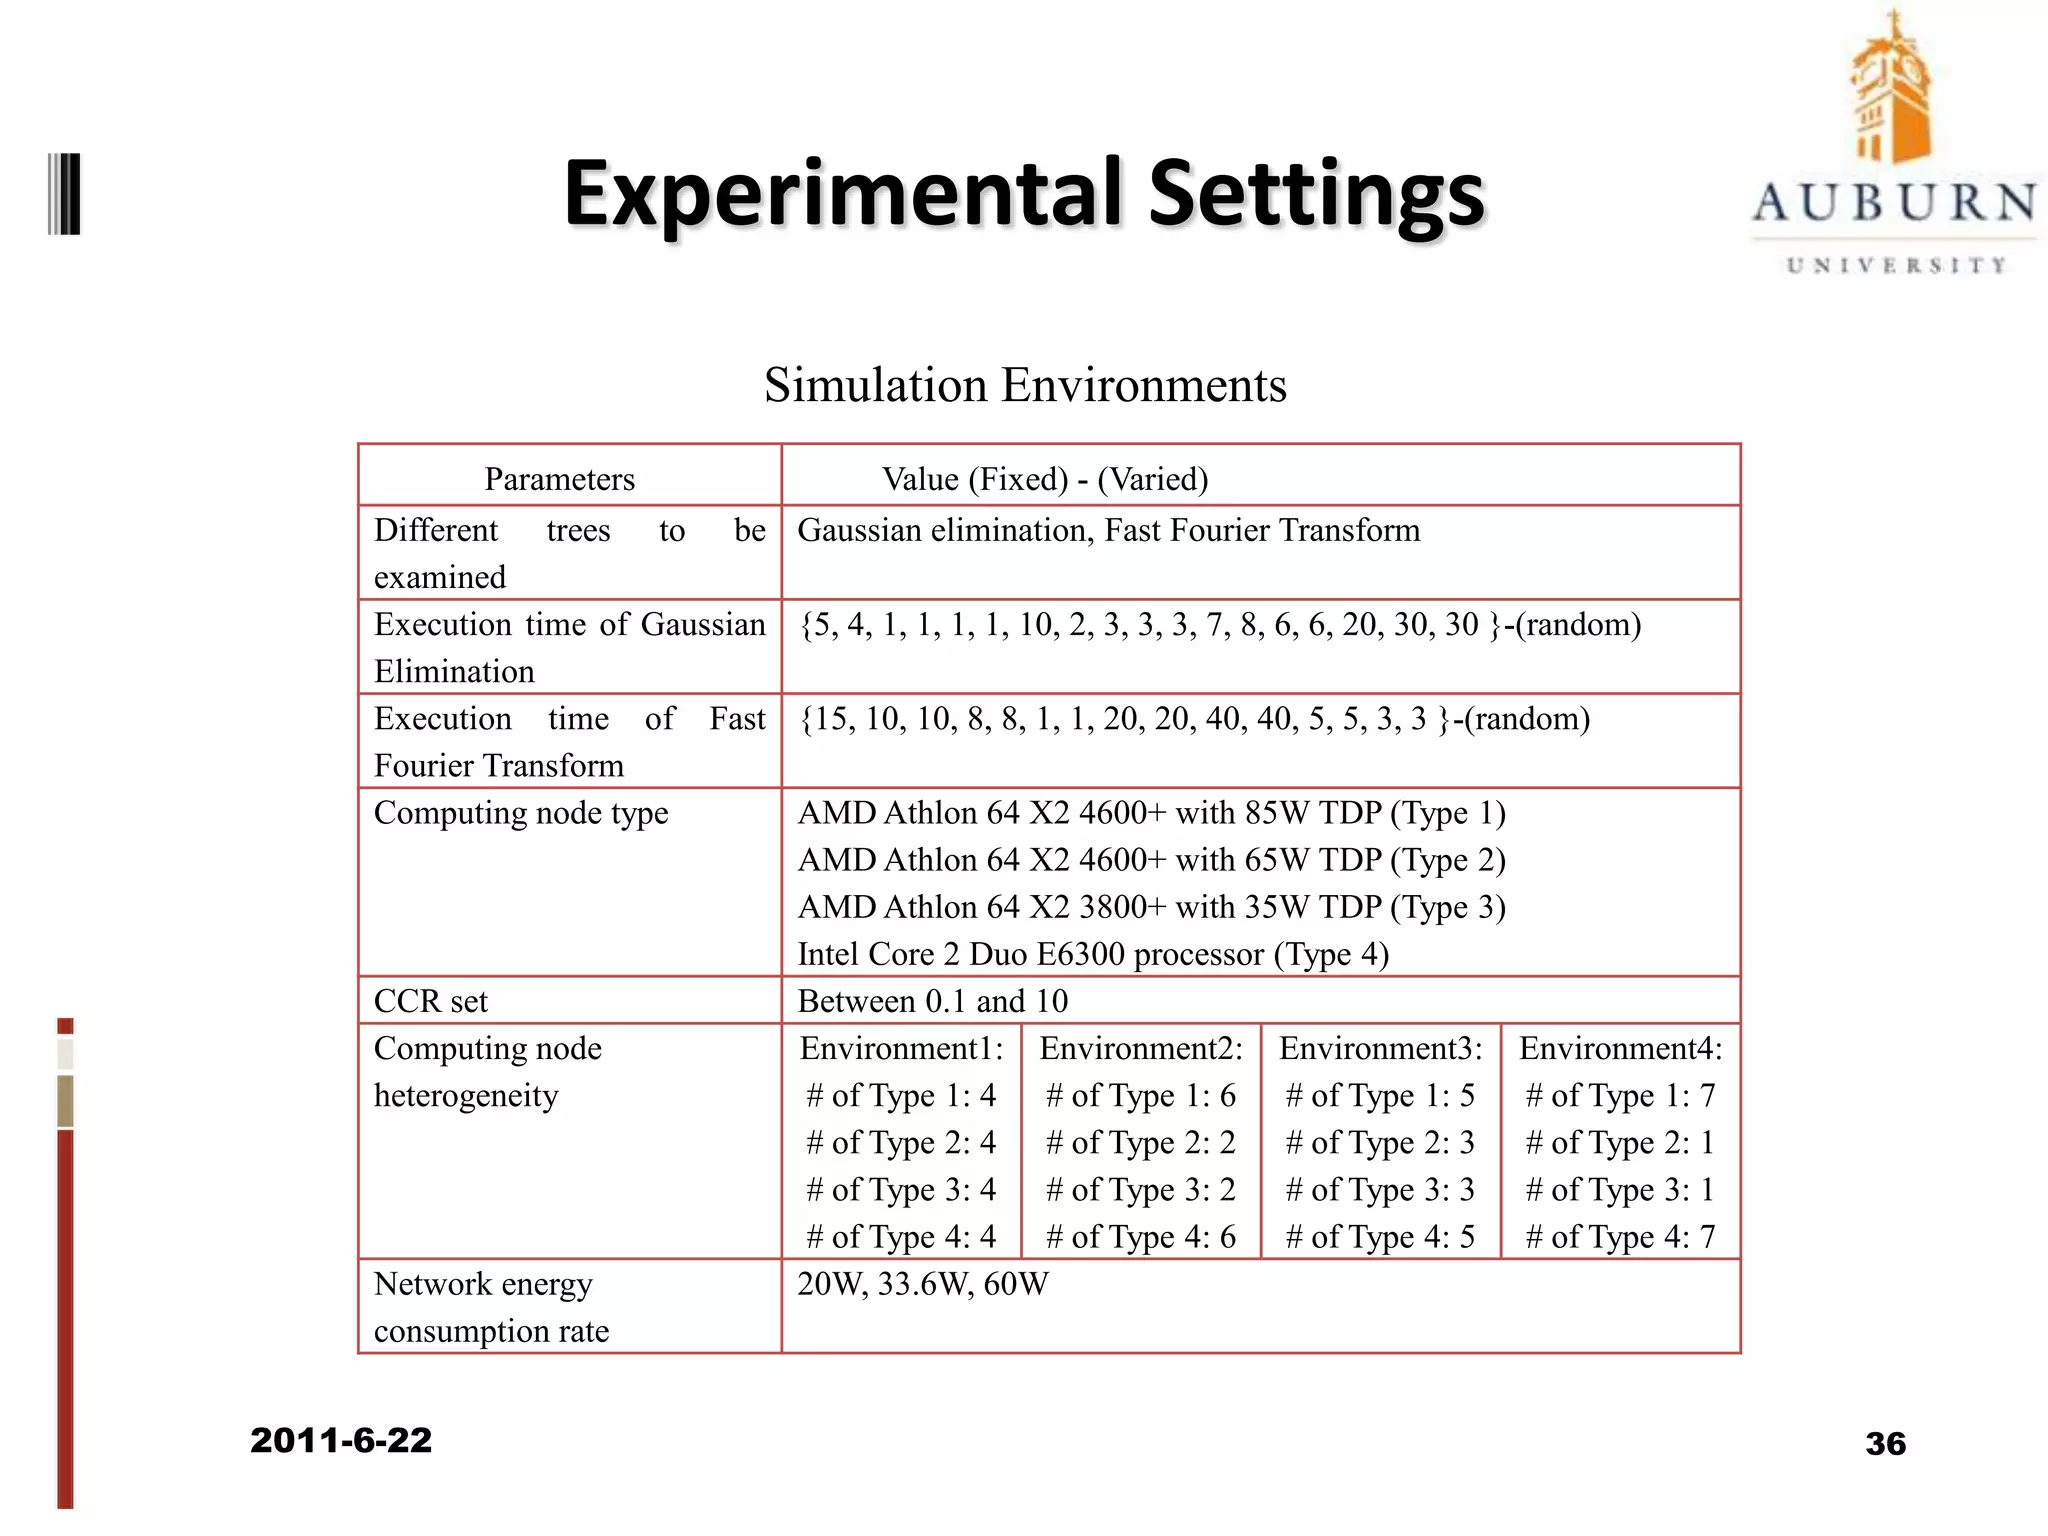
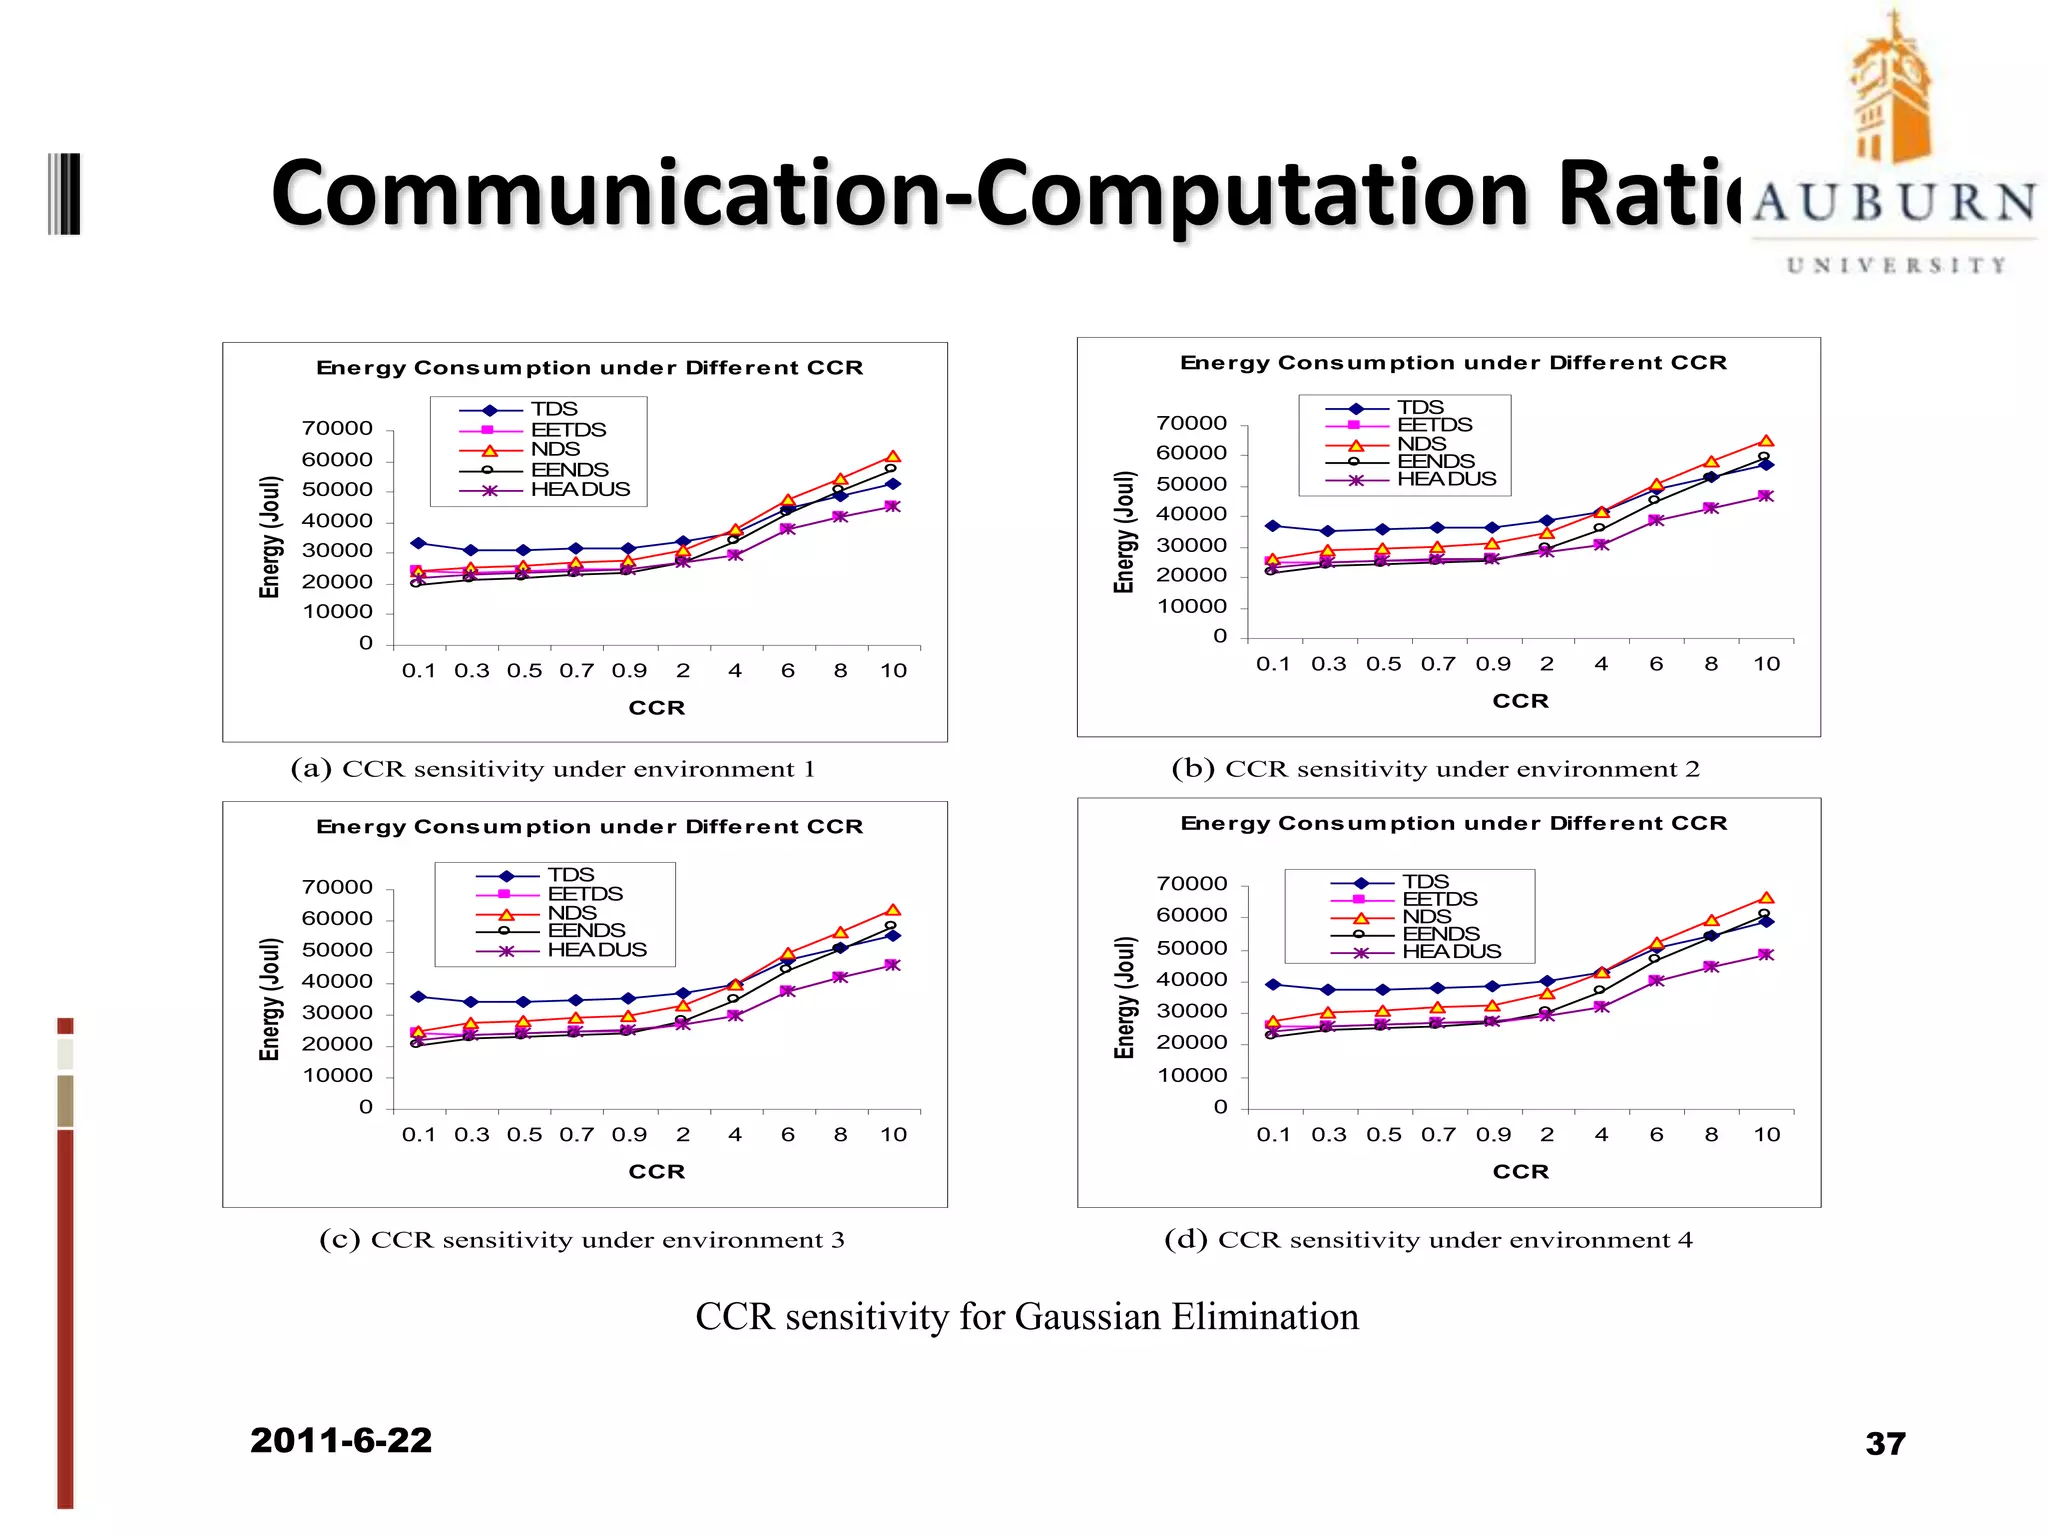
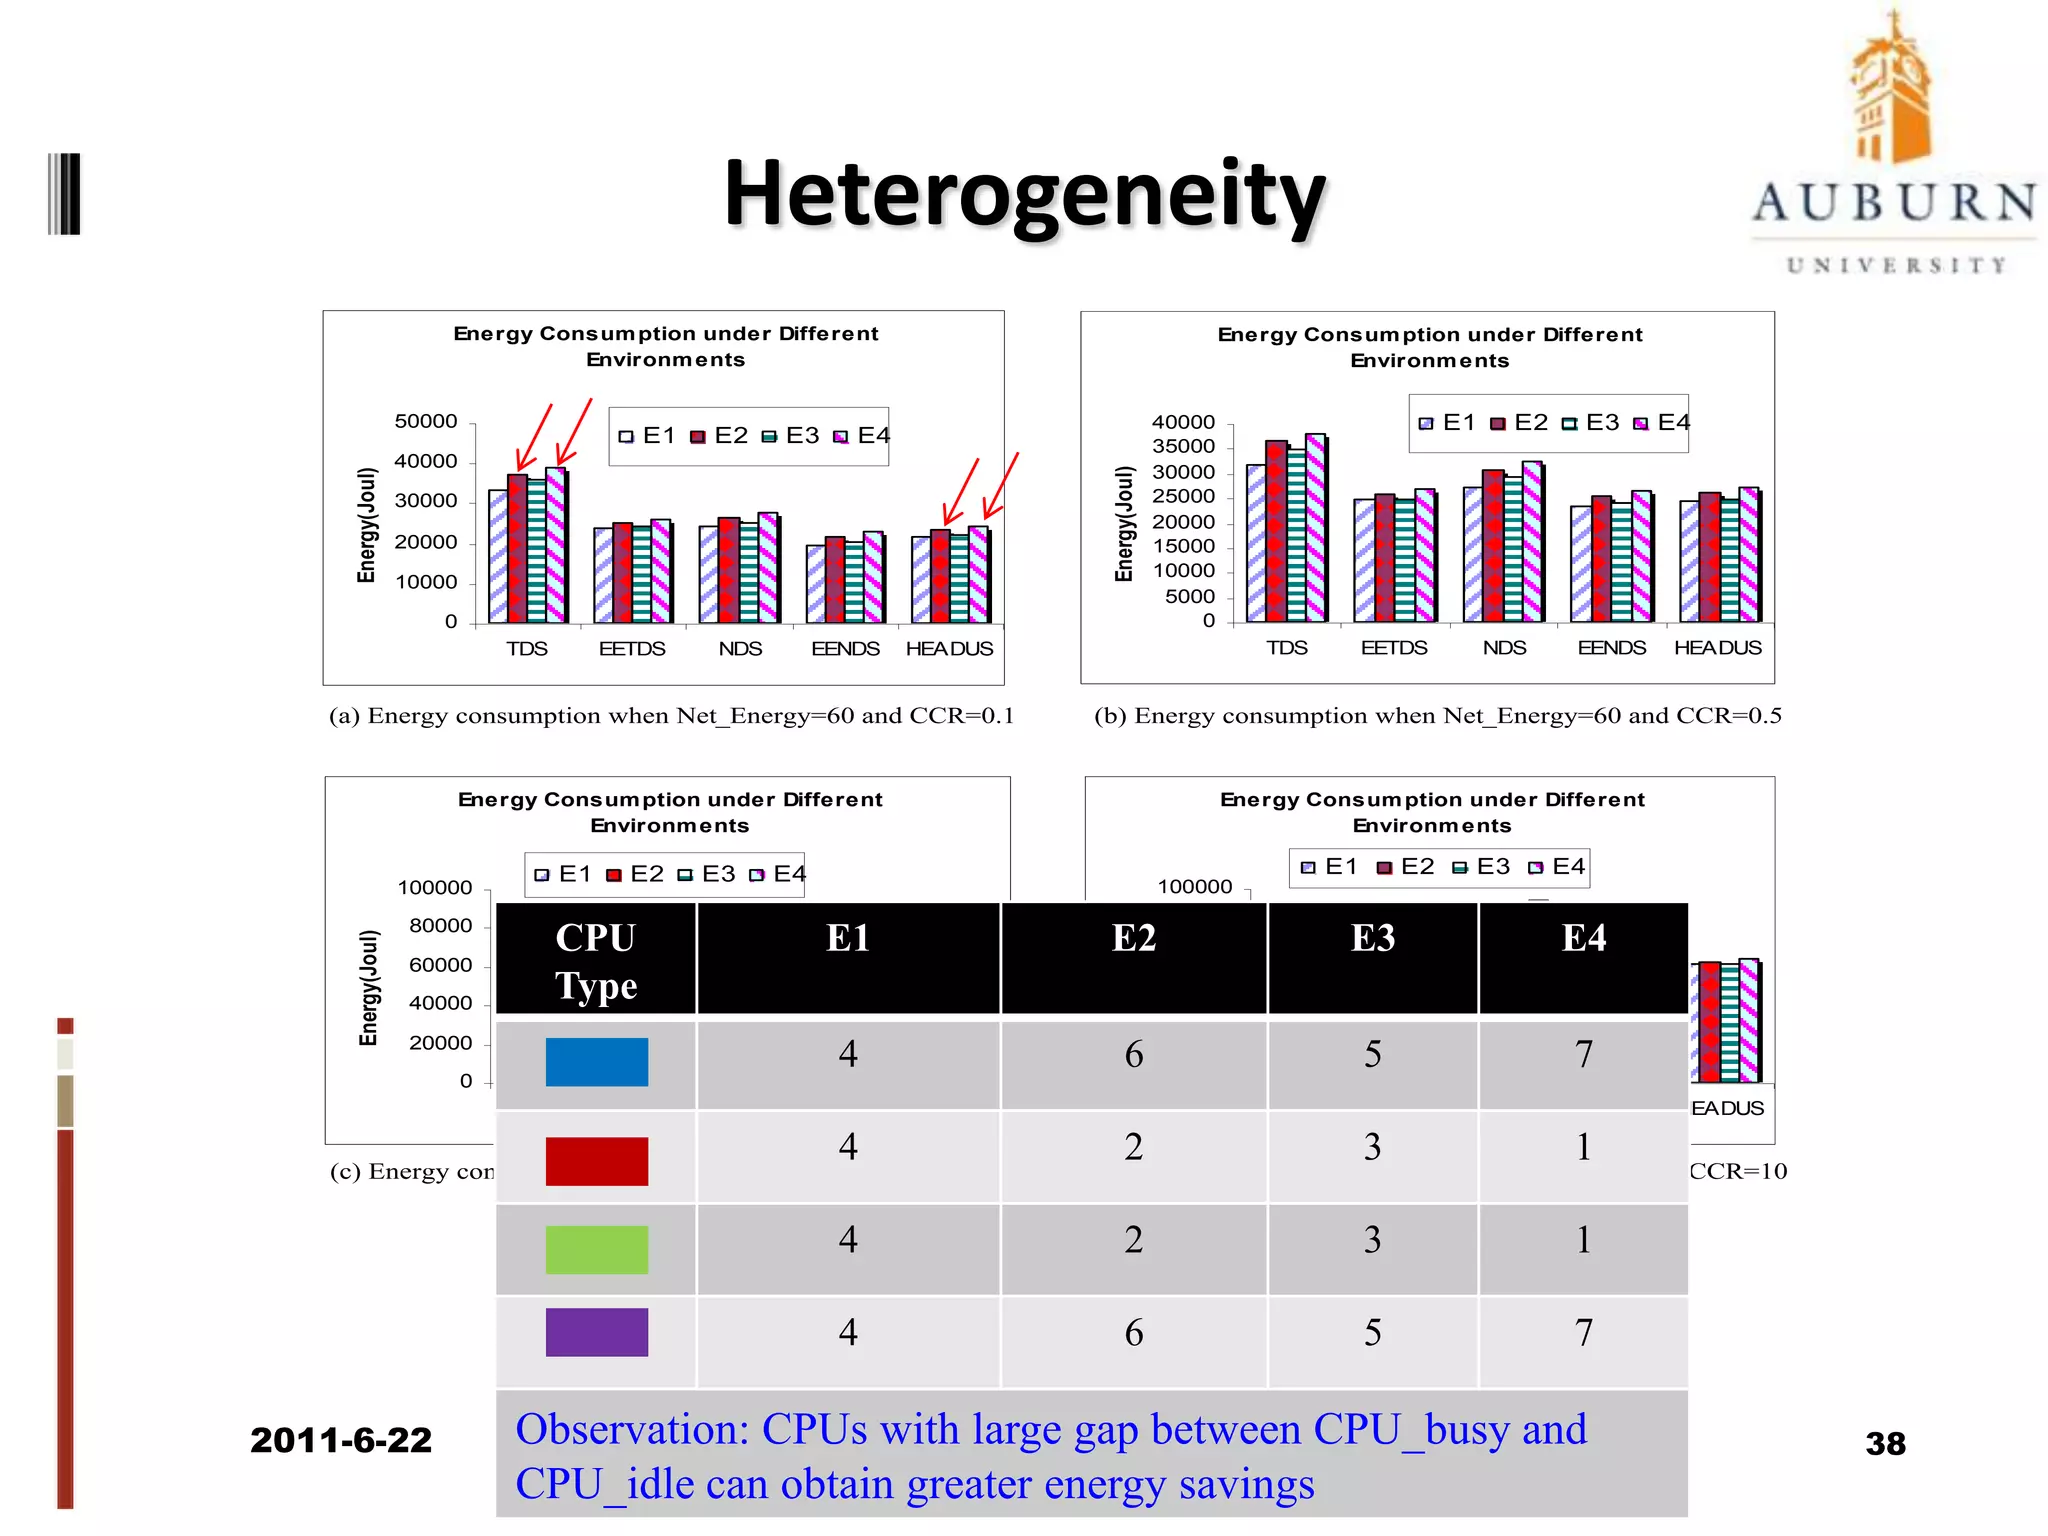
Energy Efficient Scheduling for High-Performance ClustersZiliangZong, Texas State University Adam Manzanares, Los Alamos National Lab Xiao Qin, Auburn University
Where is Auburn University?Ph.D.’04, U. of Nebraska-Lincoln04-07, New Mexico Tech07-now, Auburn University
Storage Systems Research Group at New Mexico Tech (2004-2007)2011/6/223
Storage Systems Research Group at Auburn (2008)2011/6/224
Storage Systems Research Group at Auburn (2009)2011/6/225
Storage Systems Research Group at Auburn (2011)2011/6/226
InvestigatorsZiliangZong, Ph.D. 	Assistant Professor,    Texas State UniversityAdam Manzanares, Ph.D. Candidate Los Alamos National LabXiao Qin, Ph.D. Associate Professor     Auburn University2011/6/227
2011/6/228Introduction - Applications
Introduction – Data Centers2011/6/229
Motivation – Electricity UsageEPA Report to Congress on Server and Data Center Energy Efficiency, 20072011/6/2210
Motivation – Energy ProjectionsEPA Report to Congress on Server and Data Center Energy Efficiency, 20072011/6/2211
Motivation – Design Issues2011/6/2212
Architecture – Multiple Layers2011/6/2213
Energy Efficient Devices2011/6/2214
Multiple Design Goals2011/6/2215
Energy-Aware Scheduling for Clusters2011/6/2216
Parallel Applications2011/6/2217
Motivational Example8T1T3T2T41233339086523T1T3T41015232632086224T2424146T3T4T1T123292008082T218Linear ScheduleTime: 39sNo Duplication Schedule (NDS)Time: 32sTask Duplication Schedule (TDS)Time: 29sAn Example of duplication2011/6/2218
Motivational Example (cont.)(8,48)(6,6)(5,5)T1T3T2T4123333908(15,90)(10,60)23T1T3T4(4,4)(2,2)2326320862T2(6,36)42414T3T4T1T123292008082T218Linear ScheduleTime:39s  Energy: 234J No Duplication Schedule (MCP)Time: 32s  Energy: 242JTask Duplication Schedule (TDS)Time: 29s   Energy: 284JAn Example of duplicationCPU_Energy=6WNetwork_Energy=1W2011/6/2219
Motivational Example (cont.)(8,48)(6,6)(5,5)1(15,90)(10,60)23T1T3T4(4,4)(2,2)2326320862T2(6,36)42414T3T4T1T123292008082T218The energy cost of duplicating T1:CPU side: 48J 	Network side: -6J  	Total: 42JThe performance benefit of duplicating T1: 6sEnergy-performance tradeoff: 42/6 = 7EADTime: 32s  Energy: 242JPEBDTime: 29s   Energy: 284JIf Threshold = 10 Duplicate T1? EAD: NO PEBD: Yes2011/6/2220
Basic Steps of Energy-Aware SchedulingAlgorithm Implementation:Step 1: DAG GenerationTask Description:Task Set {T1, T2, …, T9, T10 }T1 is the entry task;T10 is the exit task;T2, T3 and T4 can not start until T1 finished;T5 and T6 can not start until T2 finished;T7 can not start until both T3 and T4 finished;T8 can not start until both T5 and T6 finished;T9 can not start until both T6 and T7 finished;T10 can not start until both T8 and T9 finished;2011/6/2221
Basic Steps of Energy-Aware SchedulingAlgorithm Implementation:Total Execution time from current task to the exit taskEarliest Start TimeEarliest Completion TimeLatest Allowable Start TimeLatest Allowable Completion TimeFavorite PredecessorStep 2: Parameters Calculation2011/6/2222
Basic Steps of Energy-Aware SchedulingAlgorithm Implementation:Original Task List: {10, 9, 8, 5, 6, 2, 7, 4, 3, 1} Original Task List: {10, 9, 8, 5, 6, 2, 7, 4, 3,1} Original Task List: {10, 9, 8, 5, 6, 2, 7, 4, 3,1} Original Task List: {10, 9, 8,5, 6, 2, 7, 4, 3,1} Original Task List: {10, 9, 8,5, 6, 2, 7,4, 3,1} Step 3: Scheduling2011/6/2223
Basic Steps of Energy-Aware SchedulingAlgorithm Implementation:Original Task List: {10, 9, 8, 5, 6, 2, 7, 4, 3, 1} Original Task List: {10, 9, 8, 5, 6, 2, 7, 4, 3,1} Original Task List: {10, 9, 8, 5, 6, 2, 7, 4, 3,1} Original Task List: {10, 9, 8,5, 6, 2, 7, 4, 3,1} Original Task List: {10, 9, 8,5, 6, 2, 7,4, 3,1} Step 4: Duplication DecisionDecision 1: Duplicate T1?Decision 2: Duplicate T2?                   Duplicate T1?Decision 3: Duplicate T1?2011/6/2224
The EAD and PEBD AlgorithmsGenerate the DAG of given task setsCalculate energy increaseand time decreaseCalculate energy increaseFind all the critical paths in DAGRatio= energy increase/ time decreasemore_energy<=Threshold?Generate scheduling queue based on the level (ascending)NoYesselect the task (has not been scheduled yet) with the lowest level as starting task NoRatio<=Threshold?Duplicate this task and select the next task in the same critical pathYesmeet entry taskDuplicate this task and select the next task in the same critical pathNoallocate it to the same processor with the tasks in the same critical pathYesNoFor each task which is in the same critical path with starting task, check if it is already scheduled Save time if duplicate this task?YesPEBDEAD2011/6/2225
Energy Dissipation in Processorshttp://www.xbitlabs.com2011/6/2226
Parallel Scientific ApplicationsFast Fourier TransformGaussian Elimination2011/6/2227
Large-Scale Parallel Applications Robot ControlSparse Matrix Solverhttp://www.kasahara.elec.waseda.ac.jp/schedule/2011/6/2228
Impact of CPU Power DissipationImpact of CPU Types:19.4%3.7%Energy consumption for different processors (Gaussian, CCR=0.4) Energy consumption for different processors (FFT, CCR=0.4) 2011/6/2229
Impact of Interconnect Power DissipationImpact of Interconnection Types:5%3.1%16.7%13.3%Energy consumption (Robot Control, Myrinet) Energy consumption (Robot Control, Infiniband) 2011/6/2230
Parallelism DegreesImpact of Application Parallelism:6.9%5.4%17%15.8%Energy consumption of Sparse Matrix (Myrinet)Energy consumption of Robert Control(Myrinet)2011/6/2231
Communication-Computation RatioImpact of CCR:Energy consumption under different CCRsCCR: Communication-Computation Rate2011/6/2232
PerformanceImpact to Schedule Length:Schedule length of Gaussian EliminationSchedule length of Sparse Matrix Solver2011/6/2233
Heterogeneous Clusters - Motivational Example2011/6/2234
Motivational Example (cont.)Energy calculation for tentative scheduleC1C2C3C42011/6/2235
Experimental SettingsSimulation Environments2011/6/2236
Communication-Computation RatioCCR sensitivity for Gaussian Elimination2011/6/2237
HeterogeneityComputational nodes heterogeneity experiments2011/6/2238
ConclusionsArchitecture for high-performance computing platforms
Energy-Efficient Scheduling for Clusters
Energy-Efficient Scheduling for Heterogeneous Systems
How to measure energy consumption? Kill-A-Watt2011/6/2239
Source Code Availabilitywww.mcs.sdsmt.edu/~zzong/software/scheduling.html2011/6/2240

Energy efficient resource management for high-performance clusters

Editor's Notes

  • #2 See also: defense_Ziliang.ppt
  • #4 High performance computing platforms have been widely deployed for intensive data processing and data storage. The impact of high performance computing platforms could be found in almost every domain: financial services, scientific computing, bioinformatics, computational chemistry, and weather forecast.
  • #5 High performance computing platforms have been widely deployed for intensive data processing and data storage. The impact of high performance computing platforms could be found in almost every domain: financial services, scientific computing, bioinformatics, computational chemistry, and weather forecast.
  • #6 High performance computing platforms have been widely deployed for intensive data processing and data storage. The impact of high performance computing platforms could be found in almost every domain: financial services, scientific computing, bioinformatics, computational chemistry, and weather forecast.
  • #7 High performance computing platforms have been widely deployed for intensive data processing and data storage. The impact of high performance computing platforms could be found in almost every domain: financial services, scientific computing, bioinformatics, computational chemistry, and weather forecast.
  • #8 High performance computing platforms have been widely deployed for intensive data processing and data storage. The impact of high performance computing platforms could be found in almost every domain: financial services, scientific computing, bioinformatics, computational chemistry, and weather forecast.
  • #9 High performance computing platforms have been widely deployed for intensive data processing and data storage. The impact of high performance computing platforms could be found in almost every domain: financial services, scientific computing, bioinformatics, computational chemistry, and weather forecast.
  • #10 This slide shows a typical high-performance computing platform, which was built by Google in the Oregon state. There is no doubt that they have significantly changed our lives and we all benefit from the great services provided by these super computing platforms . However, these giant machines consume a huge amount of energy.
  • #11 This figure comes from the report of Environmental Protection Agency submitted to the congress last year. Based on their report, the total power usage of servers and data centers in United States is 61.4 billion kwh in 2006. This is more than doubled the energy usage for the same purpose in 2000. If we look at the trend, from 2000 to 2006, the energy consumed by servers and data centers rapidly increased from 28.2 billion kwh all the way up to 61.4 billion kwh.
  • #12 Even worse, the EPA predicts that the power usage of servers and data centers will be doubled again within 5 years if the historical trends are followed. Even we follow the current efficiency trends, the power usage will exceed 100 billion kwh in 2011. This is a huge amount of energy.
  • #13 However, most pervious research primarily focus on the performance, security and reliability issues of high-performance computing platforms. The energy consumption issue was ignored. Now the energy problem has become so serious and I believe it is time for us to highlight the energy efficiency research of high-performance computing platforms.
  • #14 In our architecture, we have four layers: application layer, middleware layer, resource layer, network layer. In each layer, we can incorporate energy-aware techniques. For example, in the application layer, we can reduce the unnecessary access to hardware when writing the code. In the middleware layer, we can schedule parallel tasks in more energy-efficient ways. In the resource and network layers, we can do energy-aware resource management.
  • #15 This slide shows some typical hardware in the resource and network layers like CPU, main board, storage disk, network adapter, switch and router.
  • #16 One thing I would like to emphasize here is that any energy-oriented research should not scarify other important characters like performance, reliability or security. Although there must be some tradeoff once we introduce energy-aware techniques, we do not want to see significant degradation in other characters. In other words, we would like to make our research compatible with existing techniques. For my research, I mainly focus on the tradeoff between performance and energy.
  • #17 Before we talk about the algorithms, let’s see the cluster systems first. In a cluster, we have the master node and slave nodes. The master node is responsible to schedule tasks and allocate them to slave nodes for parallel execution. All slave nodes are connected by high speed interconnections and they communicate with each other through message passing.
  • #18 The parallel tasks running on clusters are represented using Directed Acyclic Graph , or DAG for short. Usually, a dag has one entry task and one or multiple exit tasks. Dag shows the task number and the execution time of each task. It also shows the dependence and communication time among tasks. Explain a little bit…
  • #19 Weakness 1: Do not consider energy conservation in memoryWeakness 2: Energy can’t be conserved even then network interconnects are idleIn order to improve performance, we use duplication strategy. This slide shows why duplication can improve performance. Here we have 4 tasks represented by the DAG in the left side. If we use linear scheduling, all four tasks will be allocated in 1 CPU and the execution time will be 39s. However, we noticed that we can schedule task 2 to the 2nd CPU so that we do not need to wait the completion of task 3. In that way, the total time will shortened to 32s. We also noticed that 6s are wasted in the 2nd CPU because task 2 has to wait the message from task 1. If duplicate task 1 in the 2nd CPU, we can further shorted the schedule length to 29s. Obviously, the duplication could improve performance.
  • #20 However, if we calculate the energy, we will find that duplication may consume more power. For example, if we set the energy consumption for CPU and network 6w and 1w, the total energy consumption of duplication will be 42J more than NDS and 50J more than linear schedule. That is mainly because task 1 are executed twice. Here I would like to mention that I will use NDS(MCP) to represent no duplication schedule and use TDS to represent task duplication schedule. You will see a lot of them in the simulation results.
  • #21 So we have to consider the tradeoff between performance and power consumption. We propose two algorithms to consider the tradeoff. One is called energy-aware duplication or EAD for short. The other one is called performance-energy balanced duplication or PEBD for short. In EAD, we only calculate the energy cost for duplicating a task. For example, if we duplicate T1, we will pay the 48J energy cost in the CPU side because we have to execute T1 twice . At the same time, we can save 6J energy in the network side because we do not need send message from T1 to T2. So the total cost will be 42J. In PEBD, we also calculate the performance benefit. If we duplicate T1, we can shorten schedule length 6s in maxim. So the ration between energy and performance will be 7. If we set duplication threshold to be 10, EAD will not duplicate while PEBD will duplicate.
  • #22 Now let’s look at how to implement the algorithms using a concrete example. Step1, we will generate the DAD based on the task description, which should be provided by users.
  • #23 Next, we are going to calculate the important parameters based on the equations 14-19 shown in Chapter4. The level means…
  • #24 Once we have these parameters, we can obtain the original task list by sorting the level in an ascending order. We will start from the first unscheduled task in the list, which is 10, and follow the favorite predecessor to the entry task. All tasks on this path will form a critical path. Here the first critical path will be 10-&gt;9-&gt;7-&gt;3-&gt;1; Then, these tasks will be marked as scheduled. In the next iteration, the algorithm will pick up the next unscheduled task as the start task and form the second critical path. Then, the third one and the fourth one. The algorithm will not terminated until all tasks have been scheduled.
  • #25 The algorithms also have to make the duplication decision. Explain…
  • #26 This diagram summarize the steps we just talked about. I will just skip it.
  • #27 Now we are going to discuss the simulation results. We implement our own simulator using C language under Linux system. The CPU power consumption parameters come from the xbitlabs. We simulate 4 different CPUs, 3 of them are AMD and one is Intel.
  • #28 This slide shows the structure of two small task set. The left one is Fast Fourier Transform and the right one is Gaussian Elimination.
  • #29 The slide shows the DAG structure of two real-world applications. The left one is Robot Control and the right one is Sparse Matrix Solver.
  • #30 This slide shows the impact of CPU types. Recall that I simulate 4 different CPUs, which are represented in 4 different colors. We found that the CPU with blue color can save more energy compares with other 3 CPUs. For example, we can save 19.4% energy using blue CPU while we only can save 3.7% for the purple CPU. The indication behind is that these 4 CPUs have different gaps between CPU_busy and CPU_idle. This table summarize the difference. The gap for the blue CPU is 89w but the gap for the purple CPU is only 18w. So our observation is…
  • #31 This slide shows the impact of interconnections. The left one is the simulation results for Myrinet and the right one is the simulation results for the Infiniband. We can save 16.7% and 13.3% energy when CCR is 0.1 and 0.5 respectively using Myrinet. However, the number drops down to 5% and 3.1% for Infiniband. We found that the only difference between these two simulation sets are the network power consumption rate. The Myrinet is 33.6w and the Infiniband is 65w. So our observation is that…
  • #32 We also observe the impact of application parallelism. The left figure shows the experimental results for Robot Control and the right one shows the results for Sparse. We noticed that we can save 17% and 15.8% energy for robot but only save 6.9% and 5.4% energy for sparse when CCR is the same. That is because the parallelism of robot is less than sparse. So our observation is…
  • #33 This slide shows our observation to the impact of CCR. Read...
  • #34 This group of simulation results show the impact to performance. The left one is for Gaussian and the right one is for Sparse. This table summarize that the overall performance degradation of EAD and PEBD is 5.7% and 2.2% compared with TDS for Gaussian. For Sparse, the number is 2.92% and 2.02%. Our observation is …
  • #35 For example, we designed a mapping matrix to represent the execution time of tasks in different processors. As you can see, for the same task T1, the execution time are 6.7, 3.9, 2.0 respectively. If a task could not be executed in a processor, we will put a infinite sign.
  • #38 We compared our HEADUS algorithm with other 4 algorithms and found that HEADUS can obtain the best overall energy savings in all of the 4 different environments.
  • #39 We also observed that HEADUS can same more energy under environment 2 and 4.