
Recommended
Recommended
More Related Content
What's hot
What's hot (17)
Viewers also liked
Viewers also liked (18)
Similar to TOC Approach for Improving Supply Chain Performance in Indian Foundries
Similar to TOC Approach for Improving Supply Chain Performance in Indian Foundries (20)
More from Waqas Tariq
More from Waqas Tariq (20)
Recently uploaded
Recently uploaded (20)
TOC Approach for Improving Supply Chain Performance in Indian Foundries
- 1. Brijesh Ainapur, Dr.Ritesh Singh & Dr.P.R.Vittal International Journal of Business Research and Management (IJBRM), Volume (2) : Issue (4) : 2011 163 TOC Approach for Supply Chain Performance Enhancement Brijesh Ainapur brijeshainapur@rediffmail.com Research Scholar, BIT Mesra, Ranchi, India Dr.Ritesh Singh riteshsingh@bitmesra.ac.in Dept of Production Engineering, BIT Mesra, Ranchi, India Dr.P.R.Vittal vittal_ramaseshan@yahoomail.com Dept of Statistics University of Madras, Chennai, India Abstract Many foundries are operating at lower levels than the installed capacities. Study of 56 foundries across India has shown that only 68% of installed capacities are being utilized. This is mainly because of lack of co-ordination among the supply chain partners. This study is an effort in identifying these gaps using TOC approach which will help in supply chain performance enhancement. Field of Supply Chain Management witnessed rapid growth in recent past and proved to be a successful tool for organizations growth. Success of supply chain improvement initiative lies in selection of appropriate Key Performance Indicators (KPIs) using best suitable supply chain framework. These performance indicators are to be measured, monitored and controlled with proper review mechanism. This study presents a methodology for identification of the KPI’s from the supply chain metrics suitable for foundries. Selection of the KPI’s is done using Supply Chain Operations Reference (SCOR) framework. Analytical Hierarchy Process (AHP) is used for decomposing the goal into micro level for analyzing and prioritizing KPIs. In order to study the gap between as-is-state and as-to-be state, benchmarking is carried by comparing foundry industry KPIs with global best practice industry average. To optimize the supply chain performance, Goal Programming function is formulated using AHP ratings and solved using WINQSB software. Theory of Constraint (TOC) management philosophy is applied for finding the constraints, on improving these constraints supply chain performance enhancement is achieved. Key Words: SCOR, KPI, TOC, AHP, GP 1. INTRODUCTION In last few decades, concept of supply chain has witnessed widespread acceptability in the industry. Prior to that, functions like procurement, operations, logistics and distribution are being studied as independent disciplines. A supply chain (SC) is a wide (national/global) network of suppliers, manufactures, warehouses, distribution centres and retailers through which raw materials are acquired, transformed and delivered to customers. Supply chain management (SCM) deals with the coordination of manufacturing and logistic activities between autonomous decision making units (Wong et al., 2004). Optimizing supply chain activities is critical to all industries since it saves money, increases throughput, decreases inventory levels and increases revenues, thereby improving the organizations financial status.
- 2. Brijesh Ainapur, Dr.Ritesh Singh & Dr.P.R.Vittal International Journal of Business Research and Management (IJBRM), Volume (2) : Issue (4) : 2011 164 Thus, Integration of various business processes is an integral part of building supply chain initiative. This cross functional integration is needed for four basic reasons Viz Competitive Advantage, Effective use of technology, effective planning and finally improved customer service and response time. This necessitates the need of building proper framework and evaluation methodology for managing supply chain, which eventually termed as supply chain management. This forms the basis for this research work to identify, measure, benchmark and find out the constraints which prevents SC from achieving its goal. Anything which we want to monitor or improve needs a measurement system. Supply chain performance is measured using KPI’s, often referred as Key Success Indicators (KSI). KPI’s are quantifiable measurements and helps an organization to define and measure progress towards achieving goals (John Reh, 2011). Many organizations identify the KPI’s which are internal to the organization and does not include the performance of the supply chain members. Performance measures of supply chain which are traditional, concentrating on the individual performance are irrelevant to the maximization of the supply chain profit (Simatupang et.al, 2002). Supply chain performance is measured in oversimplified manner focusing mainly on cost reduction method. By this, Supply chain limits itself to local measures of performance, which does not work together in an integrated manner. There is need for identifying the performance metrics which measures the overall supply chain performance rather than the performance of the individual members. Co-relating to this many foundries found measuring local metrics as their performance measures rather than concentrating on the entire stretch of supply chain. Commonly used performance metrics in foundries are Liquid Metal Tonnage per Day, Good Castings Tonnage per Day, Internal Rejections %, Units per Ton of Good Castings, Customer End Rejections and Dispatch Tonnage per Day. KPI must be quantifiable and should reflect the organizational goals. KPI determines the success of supply chains, it is better not to measure than measuring wrong KPI. British Telecom wanted to measure the effectiveness of their customer service representatives who attends the customer complaints over telephone. Initially they fixed customer satisfaction as the performance measure and each caller has to rate in 1-10 scale, 10 being the best. Everyone tried to solve the customer query and they took maximum time for clearing each caller queries. This made other callers to wait in the queue for longer times and most often they fail to get their lines connected. In order to solve this British Telecom changed the performance measurement as number of callers attended per day. Now every representative started answering fast and tried to cut the calls without clearing the queries. This necessities the urgency in formulating a methodology in identifying the appropriate supply chain performance (SCP) metrics (Douglas et al. 2001). Lack of proper metrics for a SCP measurement will result in failure to meet consumer/end user expectations & there is no evidence that meaningful performance measures that span the supply chain actually exists. This study is intended to address all the issues in selection of the right KPI, measurement of the KPI, Benchmarking and finding the constraint KPI in the supply chain performance. Many management tools are available for measurement of KPI’s , Supply Chain Operation Reference Model (SCOR), Balanced Score Card (BSC), Global Supply Chain Forum Frame work (GSCF) , Process Classification Framework (PCF) and Three levels model are few to name.(Douglas M.Lambert et al. 1998) Once the KPI’s are identified, measured and compared with benchmarks, next step is identification of the constraint KPI’s which are preventing the SC from achieving the benchmarks. The constraint KPI’s are identified using the concepts of theory of constraint (TOC) supported with analytical hierarchy process (AHP) and goal programming (GP). Problem is decomposed into micro levels using AHP, weights for the individual KPI’s are derived from the survey results and GP is formulated for constraint identification. AHP provides a framework to deal with multiple criteria situations involving intuitive, rational, quantitative and qualitative aspects (Alberto, 2000). Goal Programming attempts to combine the logic of optimization in mathematical programming with the decision maker’s desire to satisfy several goals, which justifies the use of AHP-GP combination in this research work.
- 3. Brijesh Ainapur, Dr.Ritesh Singh & Dr.P.R.Vittal International Journal of Business Research and Management (IJBRM), Volume (2) : Issue (4) : 2011 165 The area selected for the study is Indian Foundries. Foundry is the industry which manufactures castings of different shapes and sizes. These foundries are classified as ferrous and non-ferrous foundries. This study is restricted to ferrous foundries in India. India is the fourth largest producer of castings in the world. But the emphasis on this industry is very less when compared to other industries like steel, coal, petroleum, IT etc. There are endless opportunities to grow and improve the system. Lot of technological up-gradation has taken place in the foundry industry, starting with manual moulding changed to moulding machines and now with high pressure moulding lines capable of producing 120 moulds per hour with flask and 360 moulds per hour without flask moulds. But there is no or little evidence that has taken place in managerial decision making and importance to entire supply chain as a whole. Whenever, decisions are taken for up gradation of plant facilities without looking into supply chain partners, they resulted in either scarcity of raw materials or excess of finished goods. Survey of 56 foundries across India has shown that capacity utilization is 68% of their total installed capacities. 18 foundries are going for expansions, to meet their customer schedules without actually looking into the opportunity available with the existing plant. Hau Lee ( Hau Lee et.al, 2002) states that “Technology investments alone will provide only minimal benefits. Organization Successes confirm the power and importance of SCPM as a cornerstone concept and practice within SCM.” So, this research work has been taken up to address this issue of improving the supply chain performance through constraint identification and elimination. This research work develops a framework for identification, measurement, and elimination of constraint KPI’s to enhance the supply chain performance in Indian iron and steel foundries. 2. CONTRIBUTIONS The main contributions of this article are: a) Supply chain performance measurement is formulated as multiple criteria decision making problem for constraint identification and enhancement of the supply chain performance. b) KPI’s for 5 attributes of supply chain are proposed suitable for foundry operations c) Benchmarking values are collected from the leading supply chain benchmarking agencies d) TOC has been applied with the support of AHP and GP tools for identifying the constraint KPI. e) Elimination of constraint KPI using AHP and GP is proposed first time by the authors. Other literature survey suggested that constraints lies inside or outside the system, this is a new concept proposed which suggests the constraint in the measurement system itself. f) Weights are attached to each KPI and Attributes using AHP, for formulation of GP function. The article is organized as follows: Brief literature review on KPI’s and tools used in this research are provided in Section-3. Section-4 deals with proposed methodology. Flow diagram of the proposed methodology is discussed in this section. Data collection and analysis of the data are given in Section-5. The final section is dedicated to tabulate the research findings and conclusion. 3. LITERATURE REVIEW Literature Review of many researchers and Eliyahu Goldratt, founder of concept TOC, in his book “GOAL” have emphasized that constraint is the limiting factor for achieving the organizations goal. The chain is as strong as its weakest link, which he termed as constraint. It is most important to identify this constraint, exploit constraint, sub-ordinate the constraint with all other ways, elevate the constraint and repeat these steps for next available chain members, because there is every possibility that constraint shifts from one point to another. These objectives are meet only if we are able to formulate a strong measuring, monitoring and controlling system using KPI’s. Shoshanah Cohen et.al (2007) in his research work expressed that supply chain metrics are difficult to define and even more difficult to measure. Measurement is the only way to understand whether process performance is improving or worsening and whether action is required. SCOR model proposes the best set of metrics for measurement of supply chain performance. The metrics embedded in the SCOR model are consistent with the premise of the
- 4. Brijesh Ainapur, Dr.Ritesh Singh & Dr.P.R.Vittal International Journal of Business Research and Management (IJBRM), Volume (2) : Issue (4) : 2011 166 supply chain as an end-to-end process. These difficulties in selection of metrics are addressed in the present research. Ge Wang et.al (2004) employed the concepts of KPI selection through SCOR model and applied AHP-GP combination. Eon Kyung Lee et.al (2001) applied the concepts of KPI and AHP in selection of supplier. Manoj Kumar et.al (2003) carried out his research of supply chain vendor selection using GP. Amin Amid (2008) extended these concepts of supply chain- supplier selection and applied AHP-GP using weighted goal programming for finding the best supplier among the given bunch of suppliers. Elif Kongar et.al (2000) employed GP approach for remanufacturing supply chain model. Yeliz Ekinci (2007) solved the problem of Demand Assignment in the supply chain using AHP-GP. These papers restricted only up to part of the supply chain and KPI’s are not focused on the entire stretch of supply chain. A number of researchers have applied combined AHP-GP approach in the various aspects of managerial decision making and problem solving. Schniederjans and Garvin(1997) for evaluation and selecting the best combination of cost drivers, Kwak and Lee (1998) applied for allocating higher education institutions resources to IT- based projects, Radasch and Kwak (1998) utilized this tool for planning, list goes on and literature review of over 150 articles by William Ho(2007) revealed that 33 articles used the concept of integrating AHP with mathematical programming techniques, including linear programming(LP) , integer linear programming (ILP), mixed integer linear programming (MILP) and goal programming (GP), out of this 16 have used AHP-GP goal programming combination. Ge Wang et al.(2004) applied this combination of AHP-GP in supplier selection, Eon Kyung Lee (2001) applied AHP for supplier selection, Manoj Kumar et al(2004) applied goal programming for supplier selection, Amin Amid(2008) applied GP for supplier selection, Yeliz Ekinci (2007) used the concept of goal programming in demand assignment, Rupesh Pati et al.(2008) applied GP for paper recycling system, Chandra Mohan Reddy et al.(2007) used the concept of GP for distributor selection, but none of the researches have used AHP-GP combination along with TOC for supply chain performance enhancement, they have either used only for supplier selection or scheduling or planning. They have not considered on the aspect of supply chain performance along the entire stretch of supply chain. Another research survey revealed that, the urgency in formulating a methodology in identifying the appropriate SCP metrics. Douglas et al. (2001) feels that lack of proper metrics for a SCP measurement will result in failure to meet consumer/end user expectations and his research reveals that, there is no evidence that meaningful performance measures that span the supply chain actually exists. This research work has addressed the issue of proper identification of measurement metrics. Metrics are selected after comparing the best available measurement systems viz., Supply Chain Operation Reference Model (SCOR), Balanced Score Card (BSC), Global Supply Chain Forum Frame work (GSCF), Process Classification Framework (PCF) and Three levels model. Though many organizations are adopting SCM practices, what distinguish are those who succeed and those who fail? Most of SCM practices may take the organization to the higher level of performance, if all the SCM activities are measured and monitored. So it is evident that a better performance measurement tool is required for the success of SCM. Another study by David Simchi-Levi et al.(2008) infers that supply chain performance affects the ability to provide customer value, from the most basic dimension of availability of products. Therefore, there is a need to develop independent criteria to measure supply chain performance. The need for well defined measures in the supply chain stems from the presence of many partners in the process and the requirement of a common language. This is precisely the motivation behind standardisation initiatives such as SCC reference model. In order strengthen this finding, in this research study, selection of supply chain performance measure metrics is adopted from SCC reference model SCOR.
- 5. Brijesh Ainapur, Dr.Ritesh Singh & Dr.P.R.Vittal International Journal of Business Research and Management (IJBRM), Volume (2) : Issue (4) : 2011 167 Elliot Bendoly et al. (2007) assert that “Performance Metrics identification and measurement are critical elements in translating an organisations mission or strategy into reality.” Too many metrics will lead to uncertainty, cognitive loads, local biases, misaligned decisions and ultimately poor strategic execution. So the basic question is how can a firm develop the right portfolio of performance metrics to bolster its strategy and thus ultimately generate financial benefits? This concept is used to select appropriate metrics from SCOR model which are relevant to the Foundry Industry, which is scope of this research study. The Theory of Constraints (TOC) has been widely known as a management philosophy coined by Eliyahu Goldratt(2006) in his book “GOAL”(1984), since then it has become so popular that most of the organisations have successfully implemented his concept to reap the benefits of constraint elimination. Goldratt concept has also undergone tremendous changes in the last two and half decades up to 20th Edition in 2006, “GOAL-A PROCESS OF ONGOING IMPROVEMENT”. Goldratt applied TOC for the manufacturing process, with a step extension, this research work applies TOC for the entire supply chain stretch. R.K.Singh et al. (2005) infers that TOC is a new manufacturing strategy that aims to make money in the present as well as in future by eliminating weak (constraint) links throughout manufacturing processes. This concept of TOC was mainly used in the manufacturing processes, in this research an attempt is made to use TOC concept in improving SCP through constraint KPI identification and elimination. As stated earlier, effective supply chain design calls for robust analytical models and design tools. Previous works in this area are mostly Operation Research oriented without considering entire supply chain aspects. Decision-making processes should be guided by a comprehensive set of performance metrics. Ge Wang et al.(2004) states that , Adopting supply chain operations reference (SCOR) model level I performance metrics as the decision criteria for selecting KPI’s and an integrated analytic hierarchy process (AHP) and preemptive goal programming (PGP) based multi-criteria decision-making methodology will take into account both qualitative and quantitative factors in supply chain management. Eon-Kyung Lee et al. (2001), concludes his research work on supply chain performance stating that, “Study is needed to develop a system that would suggest the detailed action plan to implement the best practices with respect to each managerial criterion in supply chain performance measurement.” Study by Rueben Slone et al.(2007) infers that ,”If you’re disengaged from supply chain management, you run the risk of sabotaging partner strategy and customer relations—and leaving money on the table now and for the long term”. With this thorough insight into literature review justifies the need of a robust performance measurement and analysis system to enhance the supply chain performance, which forms the basis of this research work. 4. RESEARCH METHODOLOGY Many researchers have applied concept of TOC in the areas of manufacturing, logistics and distribution. In this section research methodology proposed is emphasized. Concept of TOC was first coined by Eliyahu Goldratt as early as during 1980’s. TOC aims at improving the performance by eliminating the weakest link in the process. This is accomplished either using five focusing step methodology or think process depending on the constraint type, physical or non-physical respectively. Mark J.Woeppel (2001) outlines two distinct approaches for building an organization- Craftsman approach and System approach. Craftsman approach relies heavily on experts (craftsmen) to accomplish the organizational objectives. Systems approach is not as dependent on the experts. Management strives to create a repeatable process for managing the organization- a process that can be taught to others. TOC helps in creating a
- 6. Brijesh Ainapur, Dr.Ritesh Singh & Dr.P.R.Vittal International Journal of Business Research and Management (IJBRM), Volume (2) : Issue (4) : 2011 168 successful organization using systems approach. It helps in increasing the throughput (T), reducing inventory (I) and operating expenses (OE). This research work is carried out to enhance the supply chain performance on these guidelines of systems approach using five focusing step methodology. 5 steps are, a) IDENTIFY the system constraint(s) b) decide how to EXPLOIT the identified constraint(s) c) SUBORDINATE everything else in the system to step 2 d) ELEVATE the system’s constraint e) overcome INERTIA, go back to step 1. In order to apply TOC concepts to enhance the supply chain performance, we should primarily identify and measure the performance indicators. These performance indicators of supply chain are termed as KPI’s and measured under 5 attribute heads, Supply Chain Reliability, Responsiveness, Flexibility, Costs and Asset Management. 24 KPI’s applicable for foundries are identified under these 5 attributes using SCOR model. The entire research goal has been decomposed to the micro level in 3 layer decomposition model proposed by Thomas Saaty (2008). This decomposition model will help in prioritizing the variables at each levels. KPI priorities are different for different foundries. Survey response has shown wide range of priorities across these 24 KPI’s. Macro objective- Supply Chain Performance Enhancement forms the first layer in the decomposition model, followed by 5 attributes in the second layer and finally all the 24 KPI’s in the third layer. This model was proposed by Thomas saaty (1985) and coined as Analytical Hierarchy Process(AHP). The AHP tree for the present research is shown in fig.1
- 7. Brijesh Ainapur, Dr.Ritesh Singh & Dr.P.R.Vittal International Journal of Business Research and Management (IJBRM), Volume (2) : Issue (4) : 2011 169 FIGURE 1: AHP decomposition model for Supply Chain Performance Guidelines taken from Ge Wang et.al International Production Economics 2004, 1-15 Level 1 form the top most layer and is the final goal – supply chain performance enhancement Level 2 is the middle layer and forms the first layer of decomposition, where we find 5 attributes for supply chain performance enhancement – Reliability, Responsiveness, Flexibility, Costs and Asset Management. Level 3 is the last layer and the micro layer of the entire AHP tree. In this layer all the 24 KPI’s of the 5 attributes are listed and overall goal achievement depends mainly on this layer. This layer is the foundation layer for the entire process. AHP Weights are calculated based on the ratings and these AHP weights are used in formulation of GP equation. All the steps involved in achieving the supply chain performance enhancement are shown in the following flow diagram shown in fig 2. OVERALL SUPPLY CHAIN EFFICIENCY SUPPLY CHAIN COST SUPPLY CHAIN ASSET MANAGEMENT SUPPLY CHAIN RESPONSE LEVEL 1 OVERALL OBJECTIVE LEVEL 3 KEY PERFORMANCE INDICATORS LEVEL 2 ATTRIBUTES SUPPLY CHAIN RELIABILITY REL1 REL2 REL3 REL4 REL5 RES1 RES2 RES3 RES4 COS1 COS2 COS3 COS4 COS5 SUPPLY CHAIN FLEXIBILITY FLE1 FLE2 FLE3 ASM1 ASM2 ASM3 ASM4 ASM5 ASM6REL6
- 8. Brijesh Ainapur, Dr.Ritesh Singh & Dr.P.R.Vittal International Journal of Business Research and Management (IJBRM), Volume (2) : Issue (4) : 2011 170 FIGURE 2: Flow diagram of the research work Quite often the systems constraint will be our measurement system itself. It is better not to measure than measuring a wrong KPI. Performance levels are calculated using GP software WINQSB by removing each KPI at a time. Constraint KPI is the one, which increases the systems performance in its absence.(IDENTIFY AND EXPLOIT). AHP weights are calculated again for the remaining KPI’s.(SUBORDINATE). Constraint KPI is analysed for finding the root cause (ELEVATE) and addressed all the possible causes for making particular KPI as constraint KPI.(Overcome INERTIA). Goal Programming equations are formulated using the following steps. Steps involved in the formulation of GP starts with identifying the variables Two types of variables are part of any GP equation formulation… The decision variables, x and The deviation variables, d There are 6 steps in formulating the GP , they are , STEP 1: Define Goal / Goals STEP 2: Define Decision variables for goal programming Using theory of constraint and goal programming principles, supply chain effectiveness will measured by eliminating each KPI at a time, to know which KPI is limiting the supply chain performance (constraint KPI). STEP 1: Identification of Supply Chain Framework Identification of supply chain frame work from the available frameworks, namely SCOR, GSFC, 3 level model, PCF and others. STEP 2: Define Supply Chain in Foundries and Identify KPI’S Based on framework selected, defining supply chain environment for foundry industry, defining supply chain process and identifying KPI’S using SCOR Model STEP 3: Measurement and Benchmarking Preparation of Questionnaire, Survey, Measurement of Identified KPI’s and comparing with Benchmark data collected from APQC- Benchmarking Agency of Supply Chain Council. STEP 4: Framing Goal Programming Function using AHP Using Analytical Hierarchy Process, weights are added for the KPI’s and Goal Programming Function is formulated, constraints are defined for goal programming function STEP 5: Using Theory of Constraints and Goal Programming
- 9. Brijesh Ainapur, Dr.Ritesh Singh & Dr.P.R.Vittal International Journal of Business Research and Management (IJBRM), Volume (2) : Issue (4) : 2011 171 STEP 3: Define Deviation variables for goal programming STEP 4: State Constraints STEP 5: Determine the preemptive priorities incorporating AHP weights STEP 6: Find Optimal solution using WINQSB Let us explore these steps in detail with specific to this research. STEP 1: Define Goal / Goals G1, G2, G3, G4, G5 be the five goals of supply chain performance Where G1: REL :Reliability G2: RES :Responsiveness G3: FLE :Flexibility G4: COS :Costs G5: ASM :Asset Management G : SCP :Overall goal –to enhance supply chain performance Ef : Amount of overachievement of goal f ( where f=1,2,3,4,5) Uf : Amount of underachievement of goal f ( where f=1,2,3,4,5) Xi : AHP ratings of corresponding attribute (where i=1,2,3,4,5) GP equation is formulated to “MAX G” MAXIMISE=SCP=G=X1REL+X2RES+X3FLE+X4COS+X5ASM-EREL+UREL- ERES+URES-EFLE+UFLE- ECOS+UCOS-EASM+UASM -------------------- (1) STEP 2: Define Decision variables for goal programming RELx : decision variables for goal 1 where x= 1,2,3,4,5,6 RESy : decision variables for goal 2 where y= 1,2,3,4 FLEm : decision variables for goal 4 where m= 1,2,3 COSz : decision variables for goal 3 where z= 1,2,3,4,5 ASMn : decision variables for goal 5 where n= 1,2,3,4,5,6 STEP 3: Define deviation variables for goal programming Ef : Amount of overachievement of goal f ( where f=1,2,3,4,5) Uf : Amount of underachievement of goal f ( where f=1,2,3,4,5) Each goal has one or more decision variables and each of these will have deviation variables (metrics) as Efa and Ufa . For example E11 is amount of overachievement of goal 1 and decision variable 1 U11 is amount of underachievement of goal 1 and decision variable 1 GP equation for reliability attribute will be MAX G1 = ∑= +− 6 1 11 i iUiEXiRELi ----------------------(2) where ‘i’ is the KPI number of attribute1-Reliability ‘X’ is AHP rating MAX G1=X1REL1+X2REL2+X3REL3+X4REL4+X5REL5+X6REL6-E11+U11 -E12+U12-E13+U13-E14+U14-E15+U15-E16+U16 --------------------(3)
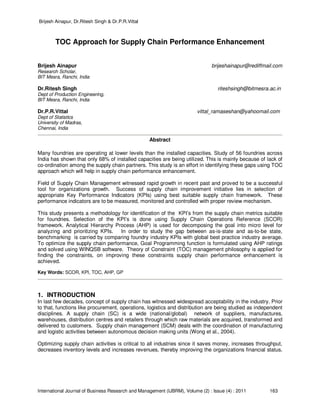
- 10. Brijesh Ainapur, Dr.Ritesh Singh & Dr.P.R.Vittal International Journal of Business Research and Management (IJBRM), Volume (2) : Issue (4) : 2011 172 similarly GP equations for other 4 attributes will be formulated. STEP 4: State Constraints Aim is to achieve benchmark levels from the present levels. Parity benchmark levels are added, sum of all the GP solution performance levels should not exceed these performance levels, and this will be RHS of the constraint For Ex: For Supply Chain Reliability, constraint is ∑∑ == ≤ 6 1 6 1 ji RELjRELi --------------------(4) RELj are the parity benchmark values of the corresponding REL KPI’s REL1+REL2+REL3+REL4+REL5+REL6 ≤ 554 --------------------(5) Present performance levels forms the lower limits and parity benchmark levels forms the upper limits in the goal programming equation formulation. STEP 5: Determine the preemptive priorities incorporating AHP weights AHP weights for each of these KPI’s are calculated and used in the GP equation. STEP 6: Find Optimal solution using WINQSB By using commercial software tool for goal programming, such as WinQSB, Lingo etc., the optimal solution to the goal programming can be obtained. In this present research work WinQSB is used. The optimal solution will decide, which KPI is preventing from achieving the maximum and it will be treated as constraint KPI. All these steps are evaluated using research data in the next section. 5. DATA ANALYSIS Data has been collected from the 56 leading iron and steel foundries in India for the financial year 2009- 2010. These are classified as large , medium and small scale foundries based on the volumes they produce. Classification is based on following criteria. a) Large scale : > 15,000 Metric Tonnes / Annum b)Medium Scale : From 5,000 to 15,000 Metric Tonnes / Annum c)Small Scale : < 5,000 Metric Tonnes / Annum Total Questionnaire sent : 85 Total responses received : 56 % Response received : 65.88% Large Scale Foundries : LS : 21 Medium Scale Foundries : MS : 26 Small Scale Foundries : SS : 09
- 11. Brijesh Ainapur, Dr.Ritesh Singh & Dr.P.R.Vittal International Journal of Business Research and Management (IJBRM), Volume (2) : Issue (4) : 2011 173 FIGURE 3 Survey Response SURVEY RESPONSE 38% 46% 16% LS MS SS 38% of the responses were from large scale foundries, 46% of the responses were from medium scale foundries and 16% of the responses were from small scale foundries. Primary Data: 15(27%) responses were from direct personal interview, 21(37%) responses were through telephonic interviews and 20(36%) responses were received by email. Secondary Data: Indian Institute of foundry men journals and websites Supply chain council websites Aberdeen Group Benchmark reports Scormark Survey reports Data collected for supply chain reliability attribute is tabulated in the below table. TABLE 1 Reliability Attribute Measured Values ATTRIBUTE KPI DIRECTION UNIT % BENCH MEASURED VALUES % PERFORMANCEMARK KPI PRIORITY SUPPLY CHAIN RELIABILITY PERFECT ORDER FULFILLMENT MAX % 90 77.79 0.17 85.3 ORDERS DELIVERED IN FULL MAX % 80.5 82.58 0.17 ORDER FILL RATE MAX % 95 79.23 0.17 DELIVERY PERFORMANCE TO CUSTOMER COMMIT DATE MAX % 90 72.29 0.18 DELIVERED IN PERFECT CONDITION MAX % 99 98.23 0.15 DOCUMENT ACCURACY MAX % 99 98.95 0.17
- 12. Brijesh Ainapur, Dr.Ritesh Singh & Dr.P.R.Vittal International Journal of Business Research and Management (IJBRM), Volume (2) : Issue (4) : 2011 174 From the above table 1, research survey shows the supply chain reliability attribute performance as 85.3%. From the benchmarks given by supply chain council and Aberdeen group shows that supply chain reliability attribute is 92% for parity, 95% for advantage, and 98% for superior. In order to improve the system performance to reach these benchmarks from the present level, we have to identify the constraint KPI from the system, we have to remove each KPI at a time and calculate the corresponding AHP weights and GP output. These are shown in the following table 2. TABLE 2: AHP Ratings ATTRIBUTE KPI RATING AHP WEIGHTS W/O KPI 1 2 3 4 5 6 SUPPLY CHAIN RELIABILITY PERFECT ORDER FULFILLMENT 6.73 0 0.205 0.204 0.207 0.202 0.204 ORDERS DELIVERED IN FULL 6.66 0.204 0 0.202 0.205 0.2 0.202 ORDER FILL RATE 6.55 0.2 0.199 0 0.201 0.196 0.198 DELIVERY PERFORMANCE TO CUSTOMER COMMIT DATE 6.95 0.212 0.212 0.211 0 0.208 0.211 DELIVERED IN PERFECT CONDITION 6.05 0.185 0.184 0.184 0.186 0 0.184 DOCUMENT ACCURACY 6.55 0.2 0.199 0.198 0.201 0.196 0 Using AHP weights for finding the REL without KPI REL1, GP equation will be MAX G1=0 x REL1+ 0.204 x REL2+ 0.2 x REL3+ 0.212 x REL4+ 0.185 x REL5+ 0.2 x REL6 -E12+U12- E13+U13-E14+U14-E15+U15-E16+U16 --------------------(6) Constraints will be REL2+REL3+REL4+REL5+REL6≤ 464 --------------------(7) When equation (7) is solved using WINQSB, supply chain performance level has increased to 92.62% from 85.3%. Similar analysis has been done by removing one KPI at a time and performance levels are calculated. Summary of these results are shown in table 3. TABLE 3: Goal Programming results ATTRIBUTE GOAL PROGRAM RESULTS W/O KPI CONSTRAINT KPI1 2 3 4 5 6 SUPPLY CHAIN RELIABILITY 92.62 93.95 91.84 92.96 91.18 90.67 KPI 2 ORDERS DELIVERED IN FULL
- 13. Brijesh Ainapur, Dr.Ritesh Singh & Dr.P.R.Vittal International Journal of Business Research and Management (IJBRM), Volume (2) : Issue (4) : 2011 175 Table 3 signifies that , in the absence of second KPI, Supply Chain Reliability Performance is maximum and nearer to advantage position in the benchmarks. Results of GP infer that KPI 2- Orders Delivered in Full is the constraint KPI and needs to be improved. Without the constraint KPI 2 , Supply Chain Reliability improved from 85.3 % to 93.95%. Next step is to study were the constraint lies, inside the system or outside the system or in both. This can be done using any of the statistical tools such as Ishikawa diagram (fish bone diagram), 5W1H format or 8D formats, Drum Buffer Rope, Think Process, Evapourating Clouds, Current Reality Tree, Future Reality Tree etc., in this research work systems constraint is exploited using Ishikawa diagram, so that it will be useful for the shop floor people to understand. This is shown in fig 4. FIGURE 4: Root Causes for constraint KPI2 Root Causes for the constraint KPI2-Orders Delivered in Full , are shown in the Ishikawa Diagram in fig 4. If this constraint KPI2 improves, overall Supply Chain Reliability of the system improves. Similar analysis has been carried out for improving the other attributes of Supply Chain and overall supply chain performance has improved from 63.17% to 71.03%. 6. CONCLUSION We would have not seen or rarely seen in any foundry , who are using fish bone diagram for supply chain KPI’s. It is the requirement and demand of the day for giving importance to the supply chain partners to enhance their effectiveness. Technological inputs and Capital infusion will help in capacity expansions but cannot improve capacity utilizations. Supply Chain Performance monitoring and controlling helps in increasing the capacity utilizations and increase the market share of the company by properly identifying, measuring and
- 14. Brijesh Ainapur, Dr.Ritesh Singh & Dr.P.R.Vittal International Journal of Business Research and Management (IJBRM), Volume (2) : Issue (4) : 2011 176 controlling the KPI’s. A concrete effort has been made in this research work to address these issues. Once the constraint KPI is removed from the system, system has shown significant improvement and performance levels of reliability attribute increased from 85.3% to 93.95% which is nearer to the benchmark values. Further going one step forward, we can study the system for more than one constraint, but as per the TOC principles, we have addressed constraints one by one instead of addressing more than one constraint at a time. Once the present constraint is addressed , constraint may shift to the other point, this can be taken up as further scope and future prospectus of this research work. So further scope for research is kept open by eliminating two or more KPI’s and measuring the performance levels. REFERENCES [1] Alberto Petroni, (2000)” Vendor selection using principal component analysis”, Journal of Supply Chain Management, pp 63-69 [2] Amin Amid and S.H.Ghodsypour, (2008) “ An additive weighted fuzzy programming for supplier selection problem in supply chain”, International Journal of Production Engineering and Production Research, pp 1-8 [3] American Productivity and Quality Council, (2010), www.apqc.org [4] Chandra Mohan Reddy, (2007) “Application of fuzzy goal and additive fuzzy goal programming approaches to distributor selection in supply chain”, Journal of Engineering and applied sciences, pp 1533-1538. [5] David ,Philip,Edith Simchi-Levi and Ravi Shankar, (2008), ”Designing and Managing the Supply Chain”, 3 rd Edition, McGraw Hill,pp 393-394. [6] Douglas M.Lambert and Terrance L.Pohlen, (2001), “Supply Chain Metrics,” International Journal of Logistics Management, Vol.12,No.1, pp 1-4. [7] Douglas.M. Lambert, Martha C Cooper and Janus.D.Pagh, (1998) “Supply Chain Management – Implementation Issues and Research Opportunities”, The International Journal of Logistics Management, pp 2-4 [8] Eliyahu M.Goldratt and Jeff Cox, (2006), ”The Goal-A Process of Ongoing Improvement,” 20th Edition, P & Q Publishing. [9] Elliot Bendoly, Eve Rosenzweig and Jeff, (2007), “ Performance Metric Portfolios:A Framework and Empirical Analysis,” Production and Operations Management Society, Vol.16,No.2, pp 257-259. [10] Eon-Kyung Lee, Sungdo Ha, and Sheung-Kown Kim, (2001), ” Supplier Selection and Management System Considering Relationships in Supply Chain Management,” IEEE Transactions on Engineering Management, Vol. 48, No.3, pp-307-318 [11] Ge Wang, Samuel H. Huang, John P. Dismukes, (2004), ” Product-driven supply chain selection using integrated multi-criteria decision-ma king methodology,” International Journal on Production Economics, Elseveir Publications , pp 1-15. [12] Hau L.Lee and Jason Amaral, (2002), “Continuous and Sustainable Improvement Through Supply Chain Performance Management,” Stanford Global Supply Chain Management Forum, pp 7-9.
- 15. Brijesh Ainapur, Dr.Ritesh Singh & Dr.P.R.Vittal International Journal of Business Research and Management (IJBRM), Volume (2) : Issue (4) : 2011 177 [13] James B.Ayer, (2000), “ A premier on supply chain management”, Information Strategy – The executives journal [14] James B Ayer, (2004), “ Supply Chain Project Management- A structured collaborative and measurable approach” – St.Lucie Press, pp 15,48,49 and 109 [15] James R. Holt, (accessed, 2010) , “TOC in Supply Chain Management”, www.vancouver.wsu.edu/fac/holt/em530/supchain.htm pp 1-4 [16] John Reh ,(2011),” Key Performance Indicators: How an organisation defines and measures progress toward its goals”, Western Sydney Institute, Technical Report in About.com, pp. 1-3. [17] Kwak, N.K., Lee, C.W., (1998), “ A multicriteria decision-making approach to university resource allocations and information infrastructure planning”, European Journal of Operational Research , 234–242. [18] Manoj Kumar, (2004), “ A fuzzy goal programming approach for vendor selection in supply chain”, Computers and Industrial Engineering Journal, pp 69-85 [19] Mark.J.Woeppel,(2001), “Manufacturers guide to implementing the theory of constraints”, pp 1-21 [20] Mentzer J.T, Dewitt W, Fall (2001), “ Defining Supply Chain Management”, Journal of Business Logistics, pp 163 [21] Mohanty R.P and Desmukh S.G, ( 2005), “ Supply Chain Management-Theories and Practices”. [22] Pano’s M Pardalos, Athanasios Migdalas, (2004), “ Supply Chain and Finanace”. [23] Peter L Grieco Jr, (1995), “ Supply Management Toolbox, How to manage your suppliers”, PT publications, pp 12-11 [24] Radasch, D.K., Kwak, N.K.,(1998), “An integrated mathematical programming model for offset planning”, Computers and Operations Research , 1069–1083. [25] R.K.Singh, Prakash,S.Kumar,M.K.Tiwari, (2005), ”Psycho-clonal based approach to solve a TOC product mix decision problem,” International Journal on Advanced Manufacturing Technology- Springer . [26] Dr.Richard Moore., (1998), ”Theory of Constraints and Lean Manufacturing;Friends or Foes?” .,Chesapeake Consulting Firm research paper., pp 3-5 [27] Reuben E. Slone, John T. Mentzer, and J. Paul Dittmann, (2007), ”Are You the Weakest Link in Your Company’s Supply Chain?”, Harvard Business Review, pp-1-2 [28] Rupesh Kumar Pati, Prem Vrat and Pradeep Kumar, (2008), “ A goal programming model for paper recycling system”, The International Journal of Management Sciences, pp 405-417. [29] Simatupang and Sridharan, (2002), “The Collaborative Supply Chain,” The International Journal of Logistics Management, Vol 13, No.1, pp 15-17.
- 16. Brijesh Ainapur, Dr.Ritesh Singh & Dr.P.R.Vittal International Journal of Business Research and Management (IJBRM), Volume (2) : Issue (4) : 2011 178 [30] Schniederjans and Garvin., (1997), “Using the analytic hierarchy process and multi-objective programming for the selection of cost drivers in activity-based costing”, European Journal of Operational Research , pp 72–80. [31] Simatupang, Wright and Sridharan, (2004), ”Applying the Theory of constraints to supply chain collaboration,” Supply Chain Management, Emerald publications, Vol.9, No.1, pp 57-58 [32] Saaty, T.L. and Kearns, K.P, (1985), “ Analytical Planning: The Organization of Systems,” Pergamon Press [33] Saaty Thomas, (2008), “Decision Making with the Analytical Hierarchy Process”, International Journal Services Sciences, Vol 1, pp 83-97. [34] Shoshanah Cohen and Joseph Roussel, (2007), ”Strategic Supply Chain Management “, McGraw Hill, pp187-283. [35] Supply Chain Council, (2010), www.supply-chain.org [36] William Ho, (2007), “Integrated Analytic Hierarchy Process and its applications- A literature review”, European Journal of Operations Research, pp 211-228. [37] Wong C.Y., Johansen J. and Hvolby H.H., (2004),”Supply chain coordination problems: literature review. Working Paper, No. 08-04. [38] Yeliz Ekinci, (2007), “Demand Assignment: A DEA and goal programming approach”, International conference paper on applied mathematics, Cairo, pp 394-397.