
Recommended
Recommended
More Related Content
Similar to A Supply Chain Design Approach to Petroleum Distribution
Similar to A Supply Chain Design Approach to Petroleum Distribution (20)
More from Waqas Tariq
More from Waqas Tariq (20)
Recently uploaded
Recently uploaded (20)
A Supply Chain Design Approach to Petroleum Distribution
- 1. Avninder Gill International Journal of Business Research and Management (IJBRM), Volume (2) : Issue (1) : 2011 33 A Supply Chain Design Approach to Petroleum Distribution Avninder Gill agill@tru.ca School of Business & Economics Thompson Rivers University Kamloops, British Columbia, 900 McGill Road, V2C 5N3, Canada Abstract Product distribution account for a significant portion of the logistical costs of a product. Distribution activities are repetitive in nature and they impact the delivery lead time to customers. A well designed supply chain network can substantially improve these costs and lead times. This paper presents a supply chain network design approach for distribution of petroleum products of a retailer by identifying the depot locations and gas station allocations. A heuristic procedure to solve large sized problems is also recommended. Finally, concluding remarks and recommendations for further research are presented. Keywords: Supply Chain; Petroleum Distribution; Mathematical Programming. 1. INTRODUCTION Supply chain managers frequently come across location and allocation problems at the design phase of a supply chain that involves determining the number of warehouses and assigning retail allocations. It appears imperative to treat the location and allocation decisions simultaneously. But due to the complexity of the problem, a breakdown into two stages i.e. location and allocation, helps to manage the complexity of large sized problems. The location decision involves substantial investment. Since it can’t be changed frequently, therefore, it has long term implications. The warehouse location acts as a prelude to the overall process of supply chain design with far reaching effects on the performance of the logistics and distribution system. On the other hand, the allocation decision is more dynamic in nature as these assignments need to reviewed and changed from time to time as the supply chain grows. This is especially true for the natural gas and petroleum products distribution in developing countries where the retail outlets and gasoline fuel stations for such products are mushrooming at an increasing rate. The present paper examines the supply chain network structure of a petroleum retail distributor in the Sultanate of Oman. The company called Al-Maha Distribution Company (AMC), is a national distributor of petroleum products. The company was founded in 1993 by extending the capabilities of Oman Refinery to engage in distribution and marketing of petroleum products. The company started operations in 1994 by opening a gas station in Al-Khuwair and now has more than 100 gas stations to cover most of the Sultanate. The company’s head office is located in Authaibah with branch offices in Khasab, Salalah, Mina Al Fahal and Seeb. The company faces a stiff competition from two other major players: British Petroleum (BP) and Shell Select. Due to substantial investment in refinery and distribution operations, it is hard to exit the petroleum industry. Therefore, being a good competitor and adding value through its supply chain is the way to survive in this competition. The company sells its products through direct sales at gas stations besides catering to the shipping and fishing industries through its marina fuel stations. In he past, AMC has strategically dominated in the capital region Muscat while serving other geographic areas as much as possible. The AMC product line consists of four main categories of products: petroleum, diesel, kerosene and jet fuels, in addition to fuel oils and lubricants. Petroleum products have further
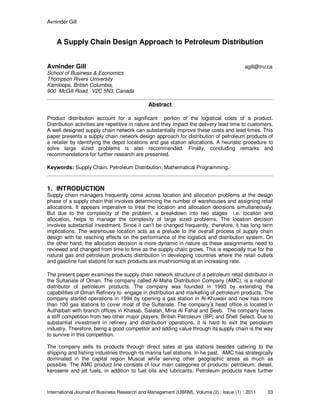
- 2. Avninder Gill International Journal of Business Research and Management (IJBRM), Volume (2) : Issue (1) : 2011 34 product proliferation into 90 Octane and 95 Octane, popularly known as regular and super brands of gasoline. Kerosene & Jet fuels benefit the aviation industry. They consist of higher specifications fuels and require separate trucks for delivery to different airports. The present paper will only focus on the retail segment of petroleum distribution, which is by far the most important operation of the company. It was estimated that 60% of the company sales are from petroleum sales through gas stations, 20% from Government and power companies and the remaining 20% from other buyers. AMC gas stations epitomize retail, operational and engineering efficiency. Different services offered at these gas stations include filling fuel, car-care, car wash and a stop-by shopping facility called “souk”. Apart from its retail business, AMC is also a prominent supplier of fuel and lubricants to a number of Ministries and institutional buyers. Its long client list includes the names of the Ministry of Electricity and Water, the Ministry of Defense, the Royal Air Force of Oman, the Royal Omani Police and Petroleum Development of Oman (PDO). Given the fact that all the three major players in this industry carry good image for their products, possess state-of-the-art technology, meet the required standards, and the price structure that is centrally controlled by the Ministry of Oil; it is evident that the battlefield to gain higher market share would be in the supply chain and distribution area. Therefore, the company is convinced that a sound distribution strategy and an effective supply chain structure holds a great promise for the future and would be a key element of their plans to enjoy a superior market performance. 2. PETROLEUM SUPPLY CHAIN NETWORK Supply chain managers frequently come across location and allocation problems at the design phase of a supply chain that involves determining the number of warehouses and assigning retail allocations. It appears imperative to treat the location and allocation decisions simultaneously. But due to the complexity of the problem, a breakdown into two stages i.e. location and allocation, helps to manage the complexity of large sized problems. The location decision involves substantial investment. Since it can’t be changed frequently, therefore, it has long term implications. The warehouse location acts as a prelude to the overall process of supply chain design with far reaching effects on the performance of the logistics and distribution system. On the other hand, the allocation decision is more dynamic in nature as these assignments need to reviewed and changed from time to time as the supply chain grows. This is especially true for the natural gas and petroleum products distribution in developing countries where the retail outlets and gasoline fuel stations for such products are mushrooming at an increasing rate. Most of the oil wells are situated in Al Fahood and Murmul areas. The crude oil is extracted from the wells by Petroleum Development of Oman (PDO) and is shipped to Government owned refinery. The refinery processes this crude oil into a number of distinct petroleum products. As shown in Figure 1, the Oman Refinery ships these petroleum products to two depots, one located in Mina Al-Fahal near Muscat and the other located in Mina Al-Raysot near Salalah. The third depot in Khasab is not operational yet. AMC has ownership rights for the Raysot depot. The Mina Al Fahal depot has two terminals, one owned by Shell and the other jointly owned by AMC and British Petroleum. While the shipment to the Raysot depot is through sea transportation using a large ship, a pipeline mode of transportation is used for the shipment to Mina Al-Fahal depot.
- 3. Avninder Gill International Journal of Business Research and Management (IJBRM), Volume (2) : Issue (1) : 2011 35 FIGURE 1: Petroleum Supply Chain Network From the terminals, the secondary shipments to various gas stations are through the road transportation. Typically, two different types of trucks are used for this movement: standard four compartment 36,400 liters truck tractors with 9100 liters capacity for each compartment, and the rigid chassis 22,500 liters trucks with three compartments of 9000, 9000 and 4500 liters capacities. Although most of the dispatching decisions are taken by AMC, the actual transportation aspect is contracted out to trucking fleet companies and individual truck owners. This policy decision besides giving Omani businessmen opportunities in the competitive trucking industry, also provides excellent sources of income for individual truck owners and drivers. 3. LITERATURE REVIEW In this section, the literature on location-allocation models has been reviewed. Shycon and Maffei [1] proposed the use of simulation tools for better product distribution. Perl and Daskin [2] considered the integration of transportation planning and location models. Lee and Luebbe [3] presented warehouse location models under multiple criteria. Hall [4] discusses a program to find new multi-facility locations. Brandeau and Chiu [5] provide an extensive review of location research problems. Crainic et. al [6] developed a model for multi-mode multi-commodity location- allocation problems with balancing requirements. Corrnuejols et al [7] discussed the un- capacitated facility location problem. Ho and Pearl [8] addressed the issue of facility location under service sensitive demand. Further work on multi-commodity location allocation problem is presented in Crainic [9] and Gendron and Crainic [10]. Application of tabu search methodology in emergency medical services locations can be found in Gendreau et. al [11]. Ingizio and Cavalier [12] discuss some heuristic approaches to solve set covering type location problems. Ballou [13] reviews and provides an introduction to some fundamental warehouse location models. Klose [14] uses a lagrangean relaxation approach for a two stage capacitated facility location model. Location decisions in light of demand probability have been considered in Berman and Krass [15]. Pal, Tardos and Wexler [16] considers hard capacities for facilities allowing demand splitting. Burkard and Dollani [17] present a restrictive optimal location problem on a tree network. Lin et al. Mina Al Fahal Al Raysot AMC BP Shell Refiner y Gas Statio
- 4. Avninder Gill International Journal of Business Research and Management (IJBRM), Volume (2) : Issue (1) : 2011 36 [18] analysis the location, routing and loading problem for bill delivery systems of a telecommunication company in Hong Kong. Han et al [19] discuss the integration issues at Wal- Mart supply chain in Korea. Zhou et al. [20] proposed a new balanced start spanning forest and genetic algorithm to solve location allocation problem. Syarif et al. [21] modeled and solved a facility location problem using a spanning tree based genetic algorithm. Ghosh [22] describes a tabu-search neighborhood heuristic for un-capacitated facility location model. Amiri [23] modeled the design of distribution network in a supply chain and solved it using a lagrangean relaxation method. Melo et al. [24] provided a mathematical modeling framework for dynamic facility location using decomposition techniques and meta-heuristics. The issue of supply chain design reliability has been addressed in Snyder [25]. Swamy and Kumar [26] propose primal-dual algorithm for multilevel hierarchical location problem. Ageev, Ye and Zhang [27] propose a combinatorial heuristic algorithm for k-level facility location. Gill and Bhatti [28] provided a set covering based model for identifying warehouse locations and a least distance allocation procedure. 4. LOCATION-ALLOCATION SUPPLY CHAIN MODEL The model minimizes the number of depot locations selected (and hence investment) while ensuring that each gas station is assigned to exactly one selected depot location and such an allocation satisfies the maximum permissible distance from a gas station to depot. The model is presented as follows: Find matrix x and vector y so as to j n j yMinimize ∑=1 subject to: n1,2,3,....jm;,1,2,3,....i. max ==∀≤ dxd ijij m,1,2,3,....i1 1 =∀=∑ = n j ijx n1,2,3,....jm;,1,2,3,....i0)( ==∀≤− jij yx j,i,1}0{, ∀∈jij yx where, m = number of gas stations n = number of candidate depot locations. x ij = 1 if gas station i is assigned to depot j, 0 otherwise y j = 1 if depot j is selected, 0 otherwise d ij = Distance of gas station i from depot location j expressed in kms. dmax = Maximum threshold distance beyond which a gas station can not be assigned to a depot due to commuting distance, over-night costs etc. For the reasonable sized problem with 50 gas stations and 10 candidate depot locations , it will give rise to 1050 constraints and 510 variables making it impractical to solve real problems using mathematical programming approach. Hence, the problem is broken down to into location and allocation stages to manage the complexity and size and a heuristic procedure is suggested below which could be applied for large sized practical problems.
- 5. Avninder Gill International Journal of Business Research and Management (IJBRM), Volume (2) : Issue (1) : 2011 37 5. HEURISTIC SOLUTION APPROACH The approach is two folds. First, the depot locations are chosen from the available set of locations which can cover the gas stations based on a pre-assigned maximum threshold distance. Then the gas stations are allocated to these depot locations. The steps of the procedure are as follows: 5.1 Location of Depots The location of depots involves two steps. First to construct a binary coefficient matrix so as to identify the potential locations, then selecting the actual locations using a mathematical programming model. Step 1. Construction of a binary coefficient matrix Based on the maximum permissible distance, dmax , a binary coefficient matrix [α ij] is prepared, which is to be used as an input to the mathematically programming model of step 2. The following relation can be used to construct this binary matrix: n.,1,2,3,....jm;,1,2,3,....iotherwise;0orddif1 maxij ==∀≤=ijα Step 2. Set covering mathematical model Using the binary coefficient matrix in Step 1 as an input, the best depot locations to cover all the gas stations are selected based on the following set covering model (Gill & Bhatti [2007]): Find vector y so as to j n j yMinimize 1 ∑ = subject to: m,1,2,3,....i1. 1 =∀≥∑ = n j jij yα n,1,2,3,....j,1}0{ =∀∈jy The objective function above expresses the minimization of the number of depot locations while the constraint set ensures that each gas station is covered by at least one depot.. 5.2 Allocation of Gas Stations to Depots Gas station allocation is done according to the following procedure. Step 1. Identify a set θ={j} such that yj =1. Step 2. Consider a sub-matrix of distance matrix [d ij] for those j є θ. Step 3. Set i = 1 Step 4. Find dij * = min(vector d ij) for j є θ, i.e., find the minimum entry in the ith row. If the column index for this minimum entry is j*, assign ith gas station to j* depot. Step 5. While i<m, set i=i+1 and repeat step 4, i.e., we continue to repeat step 4 until all the gas stations have been assigned.
- 6. Avninder Gill International Journal of Business Research and Management (IJBRM), Volume (2) : Issue (1) : 2011 38 6. APPLICATION TO PETROLEUM SUPPLY CHAIN DESIGN While analyzing the current distribution system, it became evident that catering to distant and newer gas station locations through a fewer depots results in longer lead time, uncertainties and lost sales. Looking at the tremendous growth in retail volumes over the past few years as well as the potential to grow in the coming years, it was felt that a larger number of inventory holding and forwarding points (depots) would be necessary to serve the interior regions of the Sultanate. Therefore, an important issue is to determine the number and locations of such depots. A major determinant of depot location is the distance to be covered. Apart from the depot locations, other issues that the company need to consider are consolidating demand of different gas stations on single trips, shipment sizes, dispatch rules and routes which are not a part of the current analysis. The decision process consists of hierarchical decisions including: • Deciding on the number and location of depots • Allocation of the demand points to these depots The problem is relatively complex because of the number of different but interrelated decisions that need to be made. The obvious choices are either to decompose the problem into different decision areas or alternately, to consider all the decision areas simultaneously in which case the decision-making process could be more accurate but less manageable. The scenario represents an application of the model presented in this paper. 6.1 Data Requirements The first step in evaluating the data requirements for this case, is to identify the depot candidate locations. Based on a number of factors such as proximity to major towns, communication facilities, infrastructural considerations, driver availability; Sohar, Suwayk, Muscat, Dank, Nizwa, Sur, Mahawt, Marmul and Salalah were selected to be good candidates for depot locations. The next step required choosing a maximum distance between a depot and its allocated gas stations. After much deliberations and considering the driver’s comfort, a maximum one way distance of 400 kilometers (800 Km round trip) seemed reasonable. As a driver has to deliver to gas station and make a return trip to the depot, a maximum total distance of 800 kilometers on a trip was considered reasonable. The distances between depot locations and gas stations as well as distances between gas stations posed a problem. Considering the geographical structure of the Sultanate and its road network that is still evolving after Guno cyclone, the difficult desert as well as mountainous terrain, it becomes evident that the concepts of geographic coordinate distances were not directly applicable in this case. The Sultanate of Oman has nine geographic regions: The Governorate of Muscat, Al-Batinah, Governorate of Musandam, Al-Dhahirah, Al-Dakhliyah, Ash-Sharqiyah, Al-Wusta, and the Governorate of Dhofar. Unfortunately, these geographic divisions didn’t help because within the same geographic division, the terrains could be quite non- uniform making it impossible to apply the traditional approaches. Therefore, the entire region was divided into 18 different zones with the guiding principle that it was either possible to know the actual road distance between zonal centers from existing road maps or the intra-zonal distances were relatively easier to compute due to a uniform bed within a zone. Inter-zonal distances were calculated based on actual road distance. This effort resulted in the data regarding distances between potential depot locations and the gas stations and between the gas stations which is summarized in Tables 1 and Table 2. All the gas stations have been coded from 1 through 59.
- 7. Avninder Gill International Journal of Business Research and Management (IJBRM), Volume (2) : Issue (1) : 2011 39 Z 1 Z 1 0 Z 2 Z 2 250 0 Z 3 Z 3 312 62 0 Z 4 Z 4 367 117 63 0 Z 5 Z 5 410 160 106 47 0 Z 6 Z 6 488 238 184 125 90 0 Z 7 Z 7 534 284 230 171 136 52 0 Z 8 Z 8 616 366 312 253 218 134 94 0 Z 9 Z 9 467 217 163 104 69 113 159 241 0 Z 10 Z 10 507 257 235 199 242 347 367 449 299 0 Z 11 Z 11 636 386 332 273 238 154 174 256 261 367 0 Z 12 Z 12 600 350 296 237 202 118 138 220 225 229 36 0 Z 13 Z 13 799 549 495 436 401 317 337 419 424 492 299 263 0 Z 14 Z 14 880 630 576 517 482 398 418 500 505 509 316 280 543 0 Z 15 Z 15 940 690 636 577 605 521 541 623 628 498 381 403 587 436 0 Z 16 Z 16 1390 1140 1086 1027 1055 971 991 1073 1078 948 831 853 1037 886 450 0 Z 17 Z 17 1345 1095 1147 982 1010 928 946 1028 1033 903 786 808 992 1428 405 855 0 Z 18 Z 18 1422 1172 1118 1059 1087 1003 1023 1105 1110 980 863 885 1069 1505 482 932 77 0 TABLE 1: Inter-zonal Distances (in KMs)
- 8. Avninder Gill International Journal of Business Research and Management (IJBRM), Volume (2) : Issue (1) : 2011 40 GS Sohar Suwayq Muscat Dank Nizwa Sur Mahawt Marmul Salalah 1 313 411 535 508 637 800 881 1391 1423 2 292 390 514 487 616 779 860 1370 1402 3 231.5 329.5 453.5 427 555.5 719 799.5 1309.5 1341.5 4 55.5 153.5 277.5 251 379.5 543 623.5 1133.5 1165.5 5 17 106 230 235 315 478 559 1069 1101 6 5 106 230 235 327 490 571 1081 1113 7 10 106 230 235 322 485 566 1076 1108 8 13.5 106 230 235 345.5 509 589.5 1099.5 1131.5 9 28 12 136 164 238 401 482 992 1024 10 34.5 18.5 142.5 171 244.5 408 488.5 998.5 1030.5 11 43 27 151 179 253 416 497 1007 1039 12 73 57 181 209 283 446 527 1037 1069 13 94.5 11.5 124.5 231 226.5 390 470.5 1043.5 1075.5 14 114 8 144 250 246 409 490 1063 1095 15 129.5 23.5 159.5 266 261.5 425 505.5 1078.5 1110.5 16 169 75 37 332 139 302 383 956 988 17 204 110 72 367 174 337 418 991 1023 18 205 111 73 368 175 338 419 992 1024 19 192 98 60 355 162 325 406 979 1011 20 197.5 103.5 65.5 361 167.5 331 411.5 984.5 1016.5 21 212.5 118.5 80.5 376 182.5 346 426.5 999.5 1031.5 22 215.5 121.5 83.5 379 185.5 349 429.5 1002.5 1034.5 23 203.5 109.5 26.5 321 147.5 311 391.5 964.5 996.5 24 216.5 122.5 13.5 334 160.5 324 404.5 977.5 1009.5 25 237 143 7 354 181 344 425 998 1030 26 318.5 224.5 100.5 456 262.5 426 506.5 1079.5 1111.5 27 169.5 75.5 165.5 306 267.5 431 511.5 1084.5 1116.5 28 186.5 193.5 318.5 48.5 318.5 444 460.5 899.5 931.5 TABLE 2: Distance Matrix Between Depot Locations and Gas Stations (GS)
- 9. Avninder Gill International Journal of Business Research and Management (IJBRM), Volume (2) : Issue (1) : 2011 41 Table 2. continued…. GS Sohar Suwayq Muscat Dank Nizwa Sur Mahawt Marmul Salalah 29 227 234 359 8 359 484 501 940 972 30 275 282 407 40 407 532 549 988 1020 31 282 289 414 47 414 539 556 995 1027 32 325 238 167 360 7 292 309 824 856 33 307 238 149 342 25 274 291 806 838 34 303 238 145 338 29 270 287 802 834 35 282 238 124 317 50 249 266 781 813 36 361 238 203 396 29 328 345 860 892 37 386 292 228 319 126 353 370 943 975 38 313 219 155 246 53 280 297 870 902 39 359 265 201 292 99 326 343 916 948 40 382 288 224 315 122 349 366 939 971 41 502 408 344 499 306 7 453 1044 1076 42 572 478 414 569 376 77 523 1114 1146 43 554 460 396 551 358 59 505 1096 1128 44 488 394 330 485 292 7 439 1030 1062 45 579 485 421 576 383 84 530 1121 1153 46 398 304 240 395 202 97 349 940 972 47 576 482 418 509 316 543 0 886 1505 48 668 574 510 601 408 635 92 978 1597 49 626 595 531 488 371 577 426 440 472 50 1091 1060 996 953 836 1042 891 5 937 51 1145 1114 1050 1007 890 1096 945 59 991 52 1238 1101 1037 994 877 1083 1519 946 168 53 1332 1195 1131 1088 971 1177 1613 1040 262 54 984 953 889 846 729 935 1371 798 134 55 1044 1013 949 906 789 995 1431 858 74 56 1140 1109 1045 1002 885 1091 1527 954 22 57 1135 1104 1040 997 880 1086 1522 949 17 58 1101 1070 1006 963 846 1052 1488 915 17 59 1091 1060 996 953 836 1042 1478 905 27 6.2 Model Application In this section, we apply the approach presented in section 5. Identifying Locations for Depots Step 1. Binary Coefficient Matrix Based on the maximum permissible distance of 400 KMS as discussed earlier, we prepared a binary coefficient matrix [α ij], which is used as an input to the mathematical programming model. Step 2. Solving the Mathematical Model Using the binary coefficient matrix, the best depot locations to cover all the gas stations are selected based on the set covering model given in Gill and Bhatti (2007). Although such a model theoretically has m constraints and n variables but in the context of the present problem,
- 10. Avninder Gill International Journal of Business Research and Management (IJBRM), Volume (2) : Issue (1) : 2011 42 a number of redundant constraints can be eliminated. Solving the above mathematical model resulted in the following depot locations: Sohar, Mascut, Nizwa, Mahawat, Marmul and Salalah. Note that the Salalah and Muscat depots are already operating. Allocation of Gas Stations to Depots Step 1. Identify a set of candidate locations θ. From solving the mathematical model, θ={Sohar, Mascut, Nizwa, Mahawat, Marmul, Salalah}. Step 2. Consider a sub-matrix of distance matrix [d ij] for those j є θ. Therefore, we consider matrix [d ij] of Table 1 relevant to Sohar, Mascut, Nizwa, Mahawat, Marmul and Salalah. Step 3. Set i = 1 Step 4. Find dij * = min(vector d ij) for j є θ and assign i th gas station to depot j*. Step 5. While i<m, set i=i+1 and repeat step 4, i.e., we continue to repeat step 4 until all the gas stations have been assigned. This procedure resulted in the following allocation of gas stations to the depots as given in Table 3. Depot Allocated Gas stations Number Sohar 1 – 15 and 28 - 31 Muscat 16-27 Nizwa 32-46, and 49 Mahawt 47 and 48 Marmul 50 and 51 Salalah 52 - 59 TABLE 3: Depot Locations and Gas Stations Allocations 7. CONCLUDING REMARKS The present paper analyses petroleum products distribution strategy of a company with a view to improve its distribution network for a better area coverage, to identify its major depot locations and allocation of gas stations. It is envisioned that the scope of the analysis could further include issues such as depot capacities. The capacity issues is important if the company has a practice of frequently reviewing its supply chain decisions. The capacity decision was omitted from current analysis based on the assumption that depots with sufficient capacities can be constructed. Secondly, for the existing two depots, capacity had never been a problem.
- 11. Avninder Gill International Journal of Business Research and Management (IJBRM), Volume (2) : Issue (1) : 2011 43 8. REFERNCES 1. Shycon, H. and Maffei, R. (1960), “Simulation tools for better distribution”, Harvard Business Review, Vol. 38, pp. 65-75. 2. Perl, J. and Daskin, M.S. (1984), “A unified warehouse location routing methodology,” Journal of Business Logistics , Vol. 5, No. 1 , pp. 92-111. 3. Lee, S. and Luebbe, R. (1987), “The multi-criteria warehouse location problem revisited,” International Journal of Physical Distribution and Materials Management , Vol. 17, No. 3 , pp. 56-59. 4. Hall, A.E. (1988), “Program finds new sites in multi-facility location problem,” Industrial Engineering, May, pp. 71-74. 5. Brandeau, M. and Chiu, S. (1989), “An overview of representative problems in location research,” Management Science, Vol. 35, No. 6 , pp. 645-674. 6. Crainic, T.G., Delorme, L. and Dejax, P.J.(1989), “Models for multimode multi-commodity location problems with inter-depot balancing requirements”, Annals of Operations Research, Vol. 18, pp. 279-302. 7. Cornuejols, G., Nemhauser, G.L. and Wolsey, L.A. (1990), “ The uncapacitated facility location problem”, in Discreet Location ( R.L. Francis and P.B. Mirchandani eds.), Wiley, Inter-Science, pp. 119-168. 8. Ho, P., and Perl, J. (1995), “Warehouse location under service sensitive demand”, Journal of Business Logistics, Vol. 16, No. 1, pp. 133-162. 9. Crainic, T.G., Delorme, L. and Dejax, P.J. (1993), “A branch and bound method for multicommodity location/allocation with balancing requirements”,European Journal of Operational Research, Vol. 65, No. 3, pp. 368-382. 10. Gendron, B. and Crainic, T.G. (1997), “A parallel branch and bound method for multicommodity location with balancing requirements”, Computers and Operations Research, Vol. 24, No. 9, pp. 829-847. 11. Gendreau, M. , Laporte, G. and Semet, F. (1997), “Solving an ambulance location model by tabu search”, Location Science, Vol. 5, No. 2, pp. 75-88. 12. Ignizio, J.P. and Cavalier, T.M. (1994), Linear Programming , Prentice Hall Inc., New Jersey. 13. Ballou, R.(1999), Business Logistics Management, 4th International Edition, Prentice Hall Inc., New Jersey, 483-500. 14. Klose, A. (2000), “A lagrangean relax-and-cut approach for the two stage capacitated facility location problem”, European Journal of Operational Research, Vol. 126, pp. 408-421. 15. Berman,O. and Krass, D.(2001), Facility location problems with stochastic demands and congestion , In Facility Location: Applications & Theory, ed. DREZNER, Z. and HAMACHAR, H.W., New York: Spring-Verlag., pp. 331-373. 16. Pal, M., Tardos, E. and Wexler, T., (2001), “Facility location with hard capacities”, Proceedings of the 42nd Annual IEEE Symposium on Foundations of Computer Science, 329- 338.
- 12. Avninder Gill International Journal of Business Research and Management (IJBRM), Volume (2) : Issue (1) : 2011 44 17. Burkard, R.E. and Dollani, H., (2001), Robust location problems with pos/neg weights on a tree network, tools for better distribution, Networks, Vol. 38, No. 2, pp. 102-113. 18. Lin, C.K.Y., Chow, C.K. and Chen, A. (2002), “A location, routing, loading problem for bill delivery services”, Computers and Industrial Engineering, Vol. 43, pp. 5-25. 19. Han, D., Kwon, I.G., Bae, M. and Sung, H. (2002), “Supply chain integration in developing countries for foreign retailers in Korea: Wal-Mart experience”,Computers and Industrial Engineering, Vol. 43, pp. 111-121. 20. Zhou, G., Min, H. and Gen, M. (2002) “The balanced allocation of retailers to multiple distribution centers in the supply chain network: a genetic algorithm approach ”, Computers and Industrial Engineering, Vol. 43, pp. 251-261. 21. Syarif, A., Yun, S.Y. and Gen, M. (2002) “Study on multi-stage logistic chain network: a spanning tree based genetic algorithm approach”, Computers and Industrial Engineering, Vol. 43, pp. 299-314. 22. Ghosh, D. (2003), “Neighborhood search heuristics for the un-capacitated facility location problem”, European Journal of Operational Research, Vol. 150, pp. 150-162. 23. Amiri, A. (2004), “Designing a distribution network in a supply chin system: formulation and deficient solution procedure”, European Journal of Operational Research, Vol. 132, pp. 325- 358. 24. Melo, T.M., Nickel, S. and Gama, D.S.F. (2004),“Dynamic multi-commodity capacitated facility location: a mathematical modeling framework for strategic supply chain planning”, Computers and Operations Research, Vol. 78, pp. 389-400. 25. Snyder, L.V., (2003), Supply chain robustness and reliability: models and algorithms, Ph.D. Dissertation, Northwestern University, Dept. of Industrial Engineering and Management Sciences. 26. Swamy, C. and Kumar, A., (2004), “Primal-dual algorithm for connected facility location problems”, Algorithmica, 40, 245-269. 27. Ageev, A., Ye, Y. and Zhang, J., (2005), “Improved combinatorial approximation algorithm for the k-level facility location problem”, SIAM Journal of Discrete Mathematics, Vol. 18, pp. 207- 217. 28. Gill, A and Bhatti, M. I. (2007), “An optimal model for warehouse location and retailer allocation”, Applied Stochastic Models in Business & Industry Journal, Vol. 23, pp 213-221.