More Related Content
Similar to Project Cycle Guide
Similar to Project Cycle Guide (20)
Project Cycle Guide
- 1. Project Performance Management System
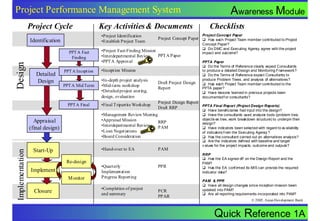
Project Cycle
•Project Identification
•Establish Project Team
Identification
Design
PPT A Fact
Finding
Detailed
Design
PPT A Inception
PPT A Mid Term
PPT A Final
Project Concept Paper
•Project Fact-Finding Mission
PPT A Paper
•Interdepartmental Review
•PPT A Approval
•Inception Mission
•In-depth project analysis
•Mid-term workshop
•Detailed project costing,
design, evaluation
•Final T ripartite Workshop
Draft Project Design
Report
•Hand-over to EA
Start-Up
PAM
Re-design
Implement
M onitor
Closure
•Quarterly
Implementation
Progress Reporting
•Completion of project
and summary
Checklists
Project Concept Paper
Has each Project Team member contributed to Project
Concept Paper?
Do DMC and Executing Agency agree with the project
impact and outcome?
PPTA Paper
Do the Terms of Reference clearly expect Consultants
to produce a detailed Design and Monitoring Framework?
Do the Terms of Reference expect Consultants to
produce Problem Trees, and analysis of alternatives?
Has each Project Team member contributed to the
PPTA paper?
Have lessons learned in previous projects been
documented f or consultants?
Project Design Report
PPTA Final Report (Project Design Reports)
Draft RRP
•Management Review Meeting
•Appraisal Mission
RRP
•Interdepartmental Review
PAM
•Loan Negotiations
•Board Consideration
Appraisal
(final design)
Implementation
Key Activities & Documents
Awareness Module
PPR
PCR
PPAR
Have beneficiaries had input into the design?
Have the consultants used analysis tools (problem tree,
objectiv es tree, work breakdown structure) to underpin their
design?
Have indicators been selected with regard to av ailability
of indicators f rom the Executing Agency ?
Has the consultant carried out an alternatives analysis?
Are the indicators defined with baseline and target
v alues for the project impacts, outcome and outputs?
RRP
Has the EA signed off on the Design Report and the
PAM?
Has the EA conf irmed its MIS can provide the required
indicator data?
PAM & PPR
Have all design changes since inception mission been
updated into PAM?
Are all reporting requirements incorporated into PAM?
© 2005, Asian Development Bank
Quick Reference 1A
- 2. Project Performance Management System
This is a quick guide to the ADB Project Cycle
and key documents in the cycle. It is for
continuing reference by attendees to the
Awareness Session of the PPMS Training
Course.
Key Documents- Name and Purpose
Sustainability- Likelihood that human institutional and financial
resources can support achievement of results and benefits over
economic life of the project
Institutional Development and other impacts-The extent to which
the project has contributed improvements in the enabling
environment of the country such that its human, financi al and
natural resources may be more effectively used.
Terms o f reference for consultants preparing
the design
PPTA Final Report
Prop osed p roject design - seeks OK to proceed
with loan processing
RRP Report and Recommendation
of the President
Proj ect design - seeks OK to proceed to loan
ne gotiation s and Board approval
PAM Project Administration
Memorandum
Basis for project management i mplementation, monitoring and evaluation
du ring impl ementation
Implementa tion and development progress flags need for design change
PCR Project Completion Report
Results ach ieved, using the REESI -and lessons
l earned
PPAR Project Performance Audit
Report
The Design and
Monitoring
Framework*
r
D ma
at
nc
a
So e T
u ar
R
i sk rc e get
As s
s
su a
m nd
pt
io
ns
Efficiency-Compares achievement of project outcome with use
of inputs. Based on implementation perform ance with
consideration of the EIRR or cost-effectiveness.
PPTA Paper Project Prep aratory
Technical Assistance Paper
Prep ared by OED - 40% of projects, 2 or 3 years
after cl osure - checking against REESI
rfo
Efficacy-Achievement of outcome as speci fied in the policy
impacts, physical, financial and institutional objectives adopted at
project approval, or as formally modified during implementation
Purp ose a nd rationale of project - seeks OK to
pro ceed with PPTA
Pe
Relevance- Consistency of a project’s impacts, outcomes and
outputs with the government’s development strategy, ADB lending
strategy and ADB's strategic objectives
Assessed for time of approval and also for time at which project is
completed
Concept Paper
PPR Project Performance Report
Criteria for Success
R
E
E
S
I
Awareness Module
Impact
Outcome
Outputs
Activities
Refer to BPHR-OS Training
Inputs
* Revised format, not yet approved as at January 2005
© 2005, Asian Development Bank
Quick Reference 1B
- 3. Project Performance Management System
This is a quick guide to the Design Steps, Design and
Monitoring Framework and Risks and Assumptions. It is for
continuing reference by attendees to the Design Linkages
Session of the PPMS Training Course.
6
Design Steps
1
State the Problem
2
Do Problem Tree Analysis
Screen Alternatives through REESI
Relevance
Efficacy (Effectiveness)
Efficiency
Sustainability
Institutional Development
Weigh-up the risks of each alternative.
Describe in terms of observations or symptoms.
Do not describe in terms of a solution “Jumping to solution”
“Why-why-why”
?
3
Design Linkages Module
Change Problem to Impact,
Outcome
Restate the problem in positive
terms.
IMPACT
OUTCOME
7 Select preferred alternative.
8 Develop Work Breakdown Structure
9 Identify Inputs required
10 Translate WBS & Solution Tree to Design Framework
OUTPUTS
4
Develop Solution Tree
ACTIVITIES
Outputs and Activities
INPUTS
5
Generate Alternatives
Refer to BPHR-OS Training
11
12
Identify Risks and Assumptions
Identify Risk Responses
© 2005, Asian Development Bank
Quick Reference 2A
- 4. Project Performance Management System
Design Linkages Module
Risks & Assumptions
High
Rate Risks by:
Likelihood- how likely is this to
occur?
Expected impact- i f it did occur, how
serious would the consequences be for
the achievement of outputs –
outcomes- impacts?
Response
Required
Killer
Rethink
Project
Response
Required
Response
Required
Response
Required
Do not
include in
design
Response
Required
Response
Required
Risk Matrix
What is most likely to go wrong?
Assumptions
What external conditions exist or behavioural changes
by target benefi ciaries are expected ?
Essential to the project’s success but beyond its
control
Likelihood
Risks
Response
Required
Medium
Low
Risk Response Strategies
*The Design and
Monitoring Framework
Avoidance - eliminate the cause of the threat
Mitigation - preventive measures - reduce likelihood or
impact
Acceptance - accept consequences and develop
contingency plan
Design
Summary
Low
Performance
Targets
Data Source
Medium
High
Expected Impact
Checklist
Assumptions
& Risks
IMPACT
Design Summary
Impact - Is the Impact stated as the long term vision and links
to the CSP?
Outcome - Is this stated as the improved situation for the target
benefi ciari es and not as a summary of outputs?
Are there 2 objectives or less?
Outputs-Are these stated as a completed deliverable?
Activities-Does this list the key task, steps or stages in the
project?
Inputs-Have the various resource categories been identifi ed?
OUTCOME
Is each statement unique in the Design Framework (I.e.
statements not repeated at di fferent levels)?
OUTPUTS
ACTIVITIES
*This format still subject to approval – January 2005
Refer to BPHR-OS Training
INPUTS
Risks and Assumptions
Do the Risks and Assumptions relate to the Project Design
Summary Statement at the same level?
© 2005, Asian Development Bank
Quick Reference 2B
- 5. Project Performance Management System
This is a quick guide to the Project
Performance Reporting (PPRs). It is
for continuing reference by
attendees to the Reporting Sessions
of the PPMS Training Course.
PAM – Project Administration
Memorandum
• contains all project information to allow
the Executing Agency (EA) and ADB to
monitor project implementation and
ev aluate project impacts
• PAM’s Design Framework is the basis
f or building Project Perf ormance Report
(PPR) f ormat.
Reporting Module
Design
Summary
Performan ce
Targets
Data
Source
IMPACT
OUTCOME
OUTPUTS
Implementation
ACTIVITIES
*This format still subject to approval – January 2005
PPR – Project Performance Report
Start-Up
Re-design
Implement
M onitor
Assumptions
& Risks
INPUTS
The Design and Monitoring Framework
• an early warning system for ADB
management implementation to take
corrective actions
• identifies objectiv es, key indicators and
targets to be monitored ev ery quarter
• serves as historical basis for
ev aluating project perf ormance
Closure
Project Completion Report (PCR)
iev aluates the rationale f or the project,
adequacy of its f ormulation, and clarity
and comprehensiv eness of the TOR
iev aluates the achievement of the
project’s outcome, outputs
iev aluates the quality of outputs
idescribes project implementation and
signif icant changes in project design
iidentif ies majors lesson learned
irates the performance of the project
Refer to BPHR-OS Training
© 2005, Asian Development Bank
Quick Reference 3A
- 6. Project Performance Management System
Design & Monitoring Frame work
Impact
Outcome
PPR
Development Objective (DO)
Immediate Development Objective
Impact and Outcome Assumptions
(combined)
Impact and Outcome
Assumptions (listed
separately)
Assumptions and Risks ( Assumptions and Risks (separated)
listed in same column)
Activity Level Not required (can be combined with
Data Source
Output Level)
Not shown in PPR (required in
PCR)
PPR Rating Scales
HS Highly Satisfactory (3 points)
Project expect ed to exceed most of its major development objectives
S Satisfactory (2 points)
Achieve most of its major development objectives
PS Partly Satisfactory (1 point)
Achieve some of its major development objectives
U Unsatisfactory (0 Points)
Unlikely to achieve its major development
PCR’s Assessment and Recommendations are based on
following criteria:
REESI + OL
•Relevance
•Efficacy (effectiveness) achieving Purpose
•Efficiency achieving Outputs and Purpose
•Sustainability (Preliminary Assessment)
•Institutional Development
Reporting Module
PPR Checklist
From PAM to PPR
Any design changes or variations since inception mission updated into the
PAM?
Has the PPR been restated if RRP or PAM was defici ent in its Design
Framework?
Is baseline data for perform ance indicators available or will it be available
before next PPR is due?
First PPR
Is the PPR content on design (outcome, outputs, assumptions, risk) same as
contain in PAM or RRP?
Does the first PPR contain monitorable indicators?
Do monitorable indicators have target values quoted?
Subsequent PPRs
Is the rating on immediate development objectives (outcome) consistent with
commentary on description of progress, status of indicators, assumptions and
risks?
Are problems listed with outcome (immediate development objective)
consistent with the ratings assigned (HS,S, PS, U)?
Are monitorable indicators being reported upon for all outputs?
Do the results indicated by monitorable indicators support the ratings assigned
to the immediate development objectives?
Overall Assessment
•“. . . whether the project was implemented as conceived . . .
•“. . . Analyze the design and monitoring framework
•“. . . and the project performance monitoring and evaluation
system,
•“and provide an overall project performance rating. . . . ”
Lessons Learned and Recommendations
© 2005, Asian Development Bank
Quick Reference 3B
- 7. Project Performance Management System
Design Indicators Module
This is a quick guide to Designing Project Monitoring Indicators. It is
for continuing reference by attendees to the Design- Indicators
Session of the PPMS Training Course.
The “SMART Way” for Good
Performance
A good performance indicator should be:
Specific - precise and unambiguous
Measurable – quantitative and/or qualitative
Achievable - realistic in what is to be achieved
Relevant – appropriate to subject at hand
Time bound – clearly stated target date
Indicators in Design and
Monitoring Framework*
Design
Summary
Performance
Targets
Data Source
A
Target is an explicit statement
of desired Results for an
Indicator at a specified point
in time
Target Statement
Target Statement
Baseline of xxxxxxxxx at (date)
Baseline of xxxxxxxxx at (date)
Targets of xxxxxxxxxx at (date)
Targets of xxxxxxxxxx at (date)
Targets should be expressed in
Targets should be expressed in
terms of Quantity,
terms of Quantity,
Quality and Time
Quality and Time
Assumptions
& Risks
Using Pre-Designed Indicators:
Pros
Can be aggregated across similar
projects/programs/policies
Reduces costs of building multiple unique
measurement systems
Creates greater harmonization of donor
requirements
Cons
May not address country-speci fic impacts
Often viewed as imposed - coming from the
Top down
Does not promote stakeholder ownership
Multiple competing indicators
When Selecting Project,
Program, or Policy Indicators…
Consider several for any one outcome
Make sure the interests of multiple
stakeholders are considered
Know that over time, it is acceptable (and
expected) to add new ones and drop old
ones
IMPACT
OUTCOME
OUTPUTS
ACTIVITIES
INPUTS
* This format awaiting approval –January 2005
Refer to BPHR-OS Training
© 2005, Asian Development Bank
Quick Reference 4A
- 8. Project Performance Management System
Some Sources of Indicators
DMC current indicators and statistical data
Similar projects
consultant proposals based on similar projects
Sector specialists w ithin ADB
Country Assistance plans of ADB
Other Lending Agencies (World Bank, UNDP etc)
Typical Problems with Indicators and
Typical Problems with Indicators and
Targets
Targets
indicators selected are not appropriate
indicators selected are not appropriate
no data available to construct them
no data available to construct them
lagging- too late for any action
lagging- too late for any action
focus on less important project elements
focus on less important project elements
data available but slow and unreliable
data available but slow and unreliable
no indicators for effects or impacts
no indicators for effects or impacts
lending agencies operate outside the Govt
lending agencies operate outside the Govt
information system
information system
no acceptance of accountability
no acceptance of accountability
Design Indicators Module
Checklist
Does every statement in the Design Summary Column of
your Design and Monitoring Framework have AT LEAST
ONE measurable indicator?
Does every indicator have a target that is measurable in
terms of Quality, Quantity or Time ?
Is each indicator unique? (ie not repeated at higher or lower
levels)
Is every indicator described well enough so that subsequent
monitoring could be carried out with no further information?
Does every indicator have at least one source of data, or
means for collecting it?
Do monitoring mechanisms already exist, or have they been
planned for in the budget?
Are the sources/ means for collecting data within the
projects control?
Why Use Proxy Indicators?
Use indirect measures (proxies) when data for direct
indicators are not available or feasible to collect at
regular intervals
Example…
Number of new tin roofs (or televisions) as a proxy
measure of increased household income
© 2005, Asian Development Bank
Quick Reference 4B
- 9. Project Performance Management System Quality Assurance Module
This is a quick guide to Quality Assurance for Projects
– Loans and Technical Assistance. It is for continuing
reference by attendees to the PPMS Training Course
and Director information.
Criteria for Success
Relevance- Consistency of a project’s impacts, outcomes and
outputs with the government’s development strategy, ADB lending
strategy and ADB's strategic objectives
Assessed for time of approval and also fo r time at which project is
completed
Efficacy-Achievement of outcome as speci fied in the policy
impacts, physical, financial and institutional objectives adopted at
project approval, or as formally modified during implementation
Quality Assurance checklist for Directors
Before signing off the Design and Monitoring Framework
DESIGN LOGIC and MONITORABILITY
Does the activity-output-outcome-impact reflect a plausible cause
and effect / results chain?
Does the Design Framework contain specific indicators and
targets that are capable of being used for monitoring? Does
the project administration personnel agree?
Does the Design Framework contain realistic assumptions and
risks – are there any ‘killer’ assumptions or risks mentioned?
Efficiency-Compares achievement of project outcome with use
of inputs. Based on implementation perform ance with
consideration of the EIRR or cost-effectiveness.
ROBUST DESIGN APPROACH
Sustainability- Likelihood that human institutional and financial
resources can support achievement of results and benefits over
economic life of the project
• Used checklists to ensure QA is applied at each stage of the
project design?
Institutional Development and other impacts-The extent to which
the project has contributed improvements in the enabling
environment of the country such that its human, financi al and
natural resources may be more effectively used.
Has the Mission Leader:
• Applied tools of problem, objectives and alternatives analysis
to design the project?
• Engaged beneficiaries, EA and other stakeholders in the
problem definition, consideration of alternatives and final
design?
• Explicitly considered lessons learned and country
implementation performance in finalizing the design?
Refer to BPHR-OS Training
© 2005, Asian Development Bank
Quick Reference 6A
- 10. Project Performance Management System Quality Assurance Module
This is a quick guide to Quality Assurance for Projects – Loans and
Technical Assistance. It is for continuing reference by attendees to
the PPMS Training Course and Director information.
Does the outcome contribute to
stated impact?
Does the impact relate to a sector
outcome in the CSP?
Design
Summary
Performance
Targets
Data Source
Assumption
s & Risks
IMPACT
3
OUTCOME
2
OUTPUTS
Why is this project being done?
Who will benefit from using the
outputs?
What change should occur (such
as behaviour of target group?)
What will be produced during the
project ?
Policies, Regulations, Plans,
Procedures, Standards,
Infrastructure, Skills, Systems,
Agency Capacity, Organisational
design, Networks,
Are all these necessary to be able
to achieve the ‘why’ ?
1
ACTIVITIES
Do the risks and
assumptions relate to the
right level – for example –
1 Activities to Outputs
2 Outputs to Outcome
3 Outcome to Impacts
INPUTS
* This format awaiting approval –January 2005
Are the performance targets
shown:
Specific
Measurable
Achievable
Relevant
Timely
Do they have baseline, target
values applicable dates?
Refer to BPHR-OS Training
Are there any ‘killer’
assumptions – and what is
the likelihood of the
assumptions not holding
good?
Are risks excluded that can
be managed by the project
manager or accommodated
by the project design?
Are the performance
indicators available from the
EA or the Government’s own
information systems?
If not, what is being done to
ensure the DMC has the skills
and systems to track
performance both during and
after project completion?
© 2005, Asian Development Bank
Quick Reference 6B
- 11. Project Performance Management System
Channel of
Effect
Effects on the Poor
Direct
Short
Run
Indirect
Short
Run
Effects on Other
Stakeholder s
Indirect
Medium
Run
Mitigation/
Enhancement
Activities
Access to
Labor Markets
& Wages
Access to
Markets and
Prices
Access to
Assets
This an alysis contains implicit assumptions,
which should be in corporated in the program
framewor k
Policy/Programs Module
This is a quick guide to Design and Monitoring
Frameworks for Policy and Programs . It is for
continuing reference by attendees to the PPMS
Training Course and Director information.
Activities,
which should
be included in
the program
framewor k
Access to
Public Serv ices
Access to
Transfers
NET IMPACT
Relates to program purpo se
The POVERTY IMPACT
ASSESSMENT describes how the
proposed project design will affect the
poor – and in doing so the mitigation
and enhancement of effects should form
part of the project activities.
The analysis of the effects makes
‘assumptions’ such as the likely
response to availability of services, new
policies, changed prices etc. These
need to be build into the DESIGN and
MONITORING FRAMEWORK
column that provides for assumptions
and risks.
Refer to BPHR-OS Training
Design Sum mar y
Performan ce
Targets/
Data Source
Assumptions
and Risks
Impact: the expected medium
Goal: the expected medium –r un
-run
impac ts of this and other programs
Outc ome: the reas on why this
Purpose: the reason why this
program is being done
—i.e. the
expected end ofprogram c hange
- -of-program
that can be assess ed by the PCR
Outputs : the s pecific deli verables of
this program (should be capable of
measurement or ass essment)
Activiti es: the main tas ks required to
produce the outputs
Inputs
© 2005, Asian Development Bank
Quick Reference 5A
- 12. Project Performance Management System
Policy/Programs Module
This is a quick guide to Quality Assurance for
Projects – Loans and Technical Assistance. It is for
continuing reference by attendees to the PPMS
Training Course and Director information.
Policy Area and Activities
Tranche 1
Tranche 2
Tranche 3
Policy Area 1 - usually equates with ‘Output’ in the Design and Monitoring Framework
Policy Action 1.1
Policy Action 1.2
Policy Area 2 - usually equates with ‘Output’ in the Design and Monitoring Framework
Policy Action 2.1
Policy Action 2.2
Etc
The POLICY MATRIX describes the
policy areas [typically] outputs that will
be achieved through initiating a series
of actions.
These various policy outputs can be
entered into the DESIGN and
MONITORING FRAMEWORK but
that still leaves the Outcome to be
defined [why are the outputs necessary
– what are the benefits and who
benefits]
Performance Targets also have to be
inserted – other than due dates.
Refer to BPHR-OS Training
Design and Monitoring Framework
Design
Summar y
Performan ce
Targets
Refere nce
Versio n
Data Source
Assumptions/
Risks
IMP ACT
OUTCOME
OUTPUTS
AC TIVITIES
AC TIVITIES
INPUTS
INPUTS
The views expressed in this paper are the views of the author and do not necessarily reflect the views or policies of the Asian
Development Bank Institute (ADBI), the Asian Development Bank (ADB), or its Board of Directors, or the governments they
represent. ADBI does not guarantee the accuracy of the data included in this paper and accepts no responsibility for any
consequences of their use. Terminology used may not necessarily be consistent with ADB official terms.
© 2005, Asian Development Bank
Quick Reference 5B