Call Girls Service In Old Town Dubai ((0551707352)) Old Town Dubai Call Girl ...
Sr mag june2013stats.3-8
1. Sarasota MLSSM
Statistics - June 2013
Statistics were compiled on properties listed in the MLS by members of the Sarasota Association of Realtors® as of July 10th, 2013,
including some listings in Manatee, Englewood, Venice, and other areas. Single-family statistics are tabulated using property styles of
single-family and villa. Condo statistics include condo, co-op, and townhouse.
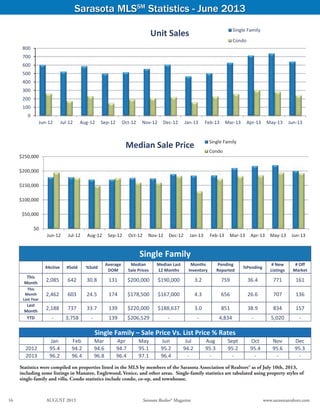
Single Family – Sale Price Vs. List Price % Rates
Jan Feb Mar Apr May Jun Jul Aug Sept Oct Nov Dec
2012 95.4 94.2 94.6 94.7 95.1 95.2 94.2 95.3 95.2 95.4 95.6 95.3
2013 96.2 96.4 96.8 96.4 97.1 96.4 ‐ ‐ ‐ ‐ ‐ ‐
Single Family
#Active #Sold %Sold
Average
DOM
Median
Sale Prices
Median Last
12 Months
Months
Inventory
Pending
Reported
%Pending
# New
Listings
# Off
Market
This
Month
2,085 642 30.8 131 $200,000 $190,000 3.2 759 36.4 771 161
This
Month
Last Year
2,462 603 24.5 174 $178,500 $167,000 4.3 656 26.6 707 136
Last
Month
2,188 737 33.7 139 $220,000 $188,637 3.0 851 38.9 834 157
YTD ‐ 3,758 ‐ 139 $206,529 ‐ ‐ 4,834 ‐ 5,020 ‐
$0
$50,000
$100,000
$150,000
$200,000
$250,000
Jun‐12 Jul‐12 Aug‐12 Sep‐12 Oct‐12 Nov‐12 Dec‐12 Jan‐13 Feb‐13 Mar‐13 Apr‐13 May‐13 Jun‐13
Single Family
Condo
Median Sale Price
Source: Sarasota Association of Realtors®
0
100
200
300
400
500
600
700
800
Jun‐12 Jul‐12 Aug‐12 Sep‐12 Oct‐12 Nov‐12 Dec‐12 Jan‐13 Feb‐13 Mar‐13 Apr‐13 May‐13 Jun‐13
Unit Sales Single Family
Condo
16 AUGUST 2013 Sarasota Realtor® Magazine www.sarasotarealtors.com
2. Sarasota MLSSM
Statistics - June 2013
Median sales price is the middle value, where half of the homes sold for more, and half sold for less. Listings sold were closed
transactions during the month. Pending sales are sales where an offer has been accepted during the month, but the sale has not yet
closed. Even though some pending sales never close, pending sales are an indicator of current buyer activity. DOM indicates the average
number of days that sold properties were on the market before a contract was executed.
Condo
#Active #Sold %Sold
Average
DOM
Median Sale
Prices
Median Last
12 Months
Months of
Inventory
Pending
Reported
%Pending
# New
Listings
# Off
Market
This
Month
1,029 241 23.4 159 $190,000 $170,050 4.3 265 25.8 242 120
This
Month
Last Year
1,354 261 19.3 221 $195,000 $165,000 5.2 204 15.0 258 162
Last
Month
1,109 283 25.5 166 $194,250 $172,500 3.9 306 27.6 288 102
YTD ‐ 1,491 ‐ 165 $177,000 ‐ ‐ 1,857 ‐ 1,880 ‐
0
100
200
300
400
500
600
700
800
900
1000
Jun‐12 Jul‐12 Aug‐12 Sep‐12 Oct‐12 Nov‐12 Dec‐12 Jan‐13 Feb‐13 Mar‐13 Apr‐13 May‐13 Jun‐13
Pending Sales
Single Family
Condo
Sarasota Association of Realtors® MLS
0
500
1,000
1,500
2,000
2,500
3,000
Jun‐12 Jul‐12 Aug‐12 Sep‐12 Oct‐12 Nov‐12 Dec‐12 Jan‐13 Feb‐13 Mar‐13 Apr‐13 May‐13 Jun‐13
Inventory
Single Family
Condo
Condo – Sale Price Vs. List Price % Rates
Jan Feb Mar Apr May Jun Jul Aug Sept Oct Nov Dec
2012 93.1 93.5 94.2 94.3 93.8 93.8 94.6 94.1 94.2 94.4 95.4 94.8
2013 95.4 95.4 95.2 95.4 95.3 95.6 ‐ ‐ ‐ ‐ ‐ ‐
www.sarasotarealtors.com Sarasota Realtor® Magazine AUGUST 2013 17
3. TheXtraPages-DigitalVersionOnly
Sarasota Association of Realtors® MLS
0
1
2
3
4
5
6
7
8
9
Jun‐12 Jul‐12 Aug‐12 Sep‐12 Oct‐12 Nov‐12 Dec‐12 Jan‐13 Feb‐13 Mar‐13 Apr‐13 May‐13 Jun‐13
Months of Inventory Single Family
Condo
$0
$50,000,000
$100,000,000
$150,000,000
$200,000,000
$250,000,000
$300,000,000
Jun‐12 Jul‐12 Aug‐12 Sep‐12 Oct‐12 Nov‐12 Dec‐12 Jan‐13 Feb‐13 Mar‐13 Apr‐13 May‐13 Jun‐13
Sales Volume
Single Family
Condo
0
50
100
150
200
250
Jun‐12 Jul‐12 Aug‐12 Sep‐12 Oct‐12 Nov‐12 Dec‐12 Jan‐13 Feb‐13 Mar‐13 Apr‐13 May‐13 Jun‐13
Days on Market Single Family
Condo
0
200
400
600
800
1,000
1,200
Jun‐12 Jul‐12 Aug‐12 Sep‐12 Oct‐12 Nov‐12 Dec‐12 Jan‐13 Feb‐13 Mar‐13 Apr‐13 May‐13 Jun‐13
New Listings Single Family
Condo
4. Second Quarter 2013 Report
Source: Sarasota Association of Realtors®
0
200
400
600
800
1000
1200
1400
1600
1800
2010‐Q4 2011‐Q1 2011‐Q2 2011‐Q3 2011‐Q4 2012‐Q1 2012‐Q2 2012‐Q3 2012‐Q4 2013‐Q1 2013‐Q2
Single Family Sales ‐ By Quarter REO Short Market
0
100
200
300
400
500
600
700
800
2010‐Q4 2011‐Q1 2011‐Q2 2011‐Q3 2011‐Q4 2012‐Q1 2012‐Q2 2012‐Q3 2012‐Q4 2013‐Q1 2013‐Q2
Condo Sales ‐ By Quarter REO Short Market
$0
$50,000
$100,000
$150,000
$200,000
$250,000
$300,000
2010‐Q4 2011‐Q1 2011‐Q2 2011‐Q3 2011‐Q4 2012‐Q1 2012‐Q2 2012‐Q3 2012‐Q4 2013‐Q1 2013‐Q2
REO Short MarketSingle Family Median Sale Price
$0
$50,000
$100,000
$150,000
$200,000
$250,000
$300,000
2010‐Q4 2011‐Q1 2011‐Q2 2011‐Q3 2011‐Q4 2012‐Q1 2012‐Q2 2012‐Q3 2012‐Q4 2013‐Q1 2013‐Q2
REO Short MarketCondo Median Sale Price
5. Source: Sarasota Association of Realtors®
0
50
100
150
200
250
300
350
400
450
500
2010‐Q4 2011‐Q1 2011‐Q2 2011‐Q3 2011‐Q4 2012‐Q1 2012‐Q2 2012‐Q3 2012‐Q4 2013‐Q1 2013‐Q2
REO Sales ‐ By Quarter Single Family
Condo
0
50
100
150
200
250
300
350
400
2010‐Q4 2011‐Q1 2011‐Q2 2011‐Q3 2011‐Q4 2012‐Q1 2012‐Q2 2012‐Q3 2012‐Q4 2013‐Q1 2013‐Q2
Short Sales ‐ By Quarter
Single Family
Condo
0
200
400
600
800
1000
1200
1400
1600
1800
2010‐Q4 2011‐Q1 2011‐Q2 2011‐Q3 2011‐Q4 2012‐Q1 2012‐Q2 2012‐Q3 2012‐Q4 2013‐Q1 2013‐Q2
Market Sales ‐ By Quarter
Single Family
Condo