Downloaded 268 times
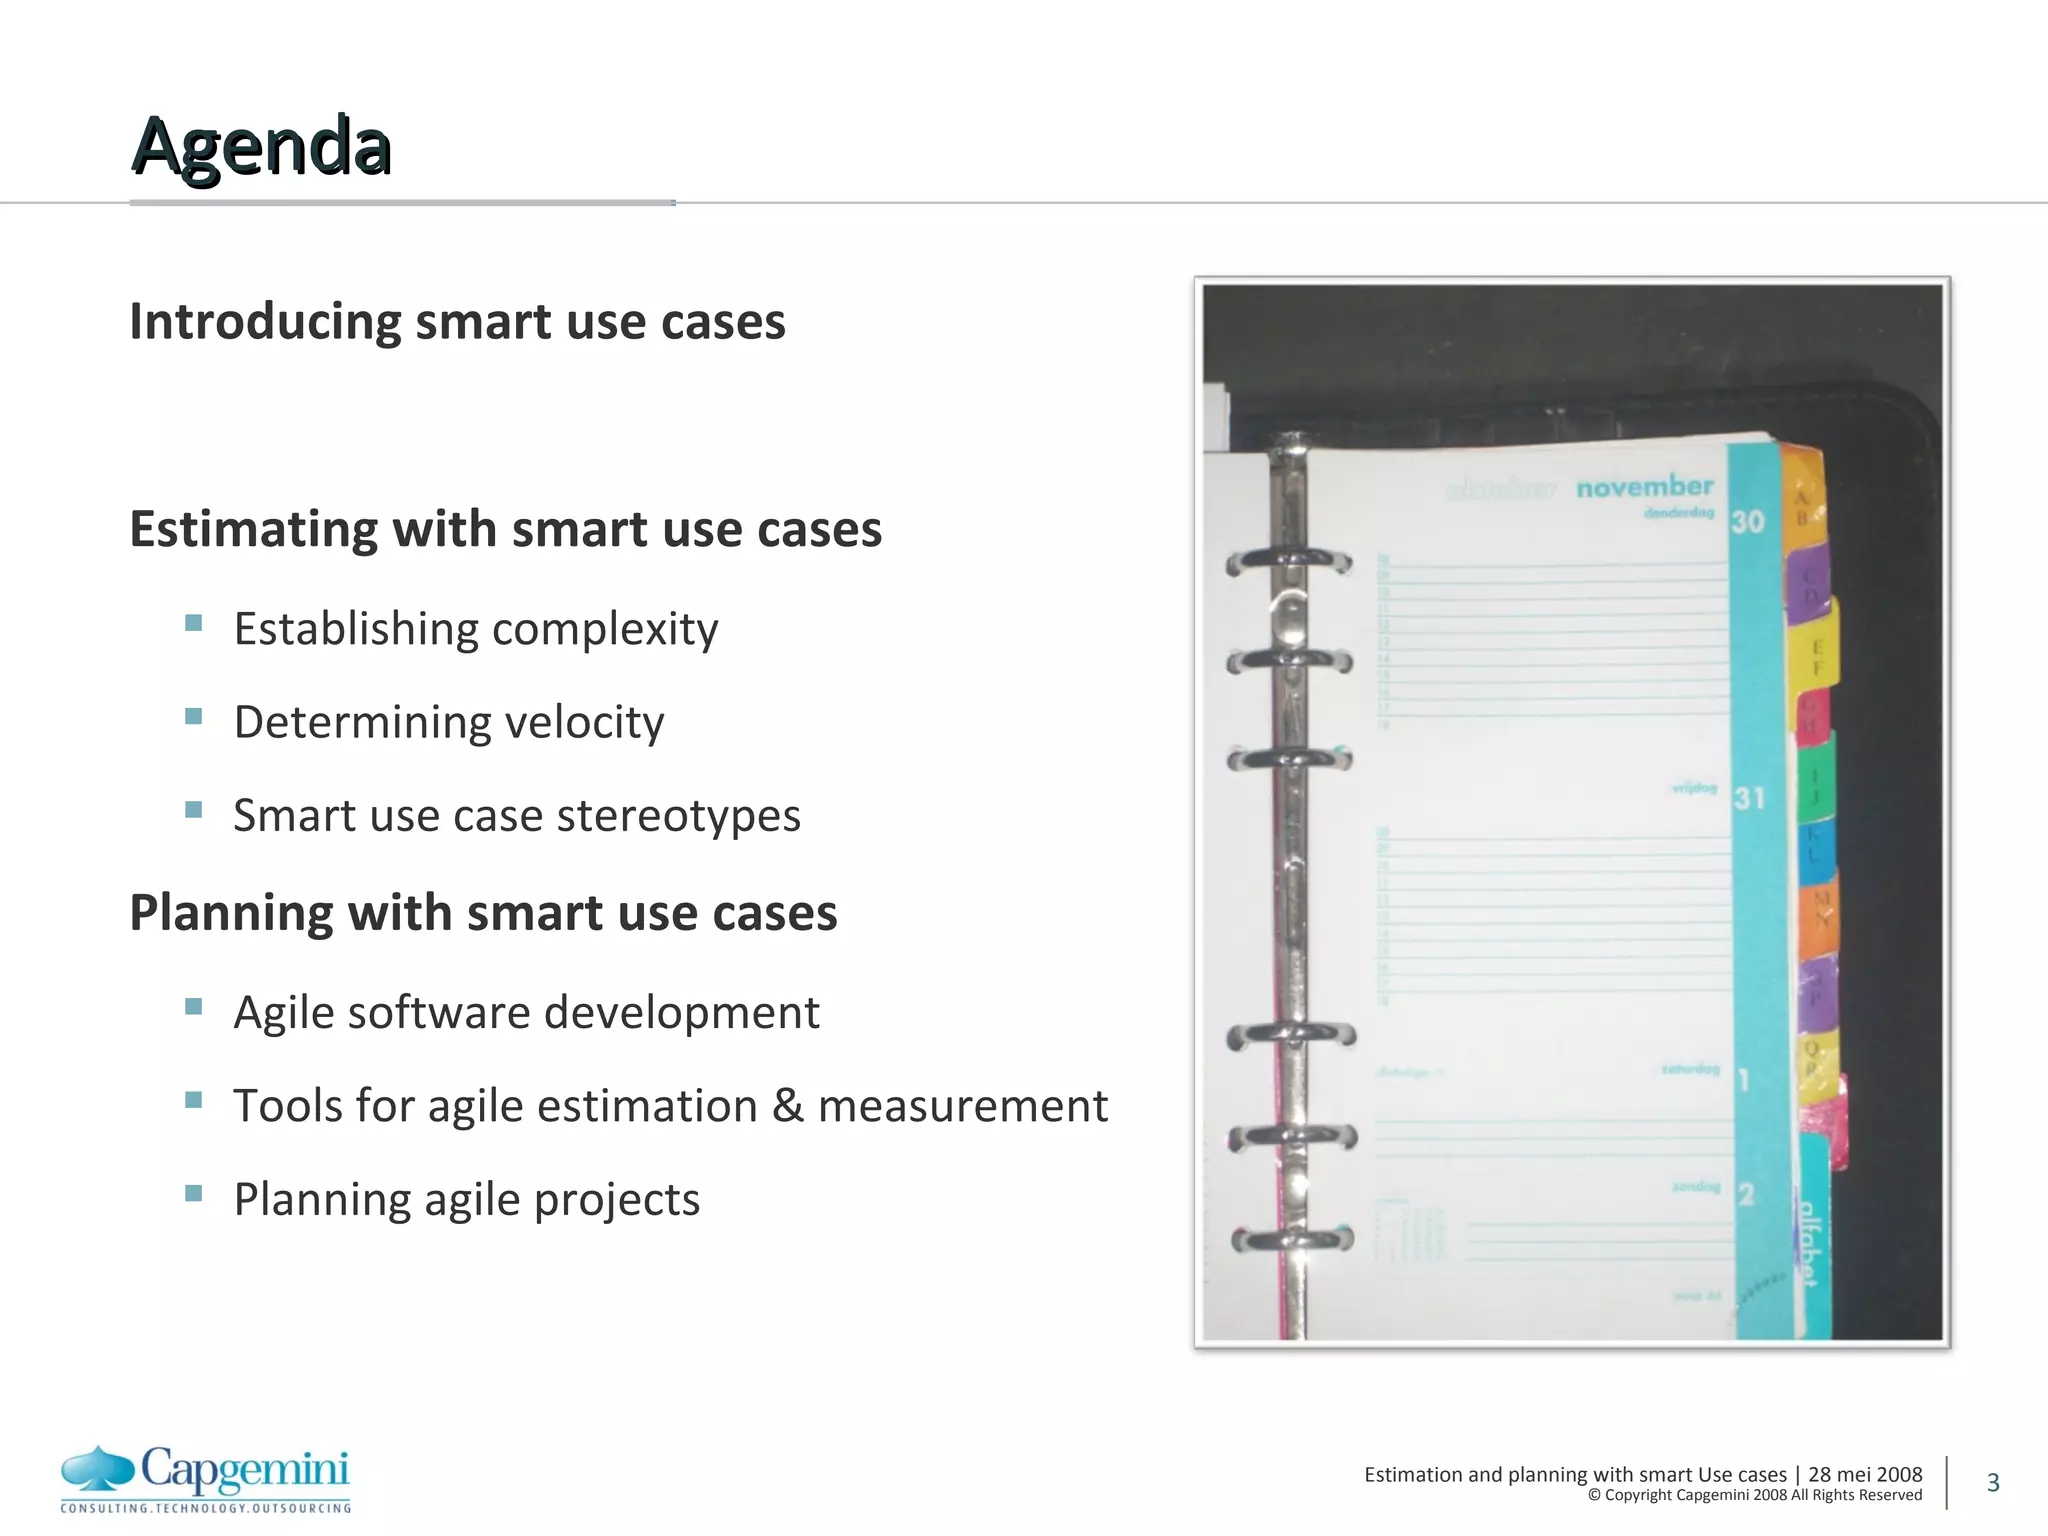
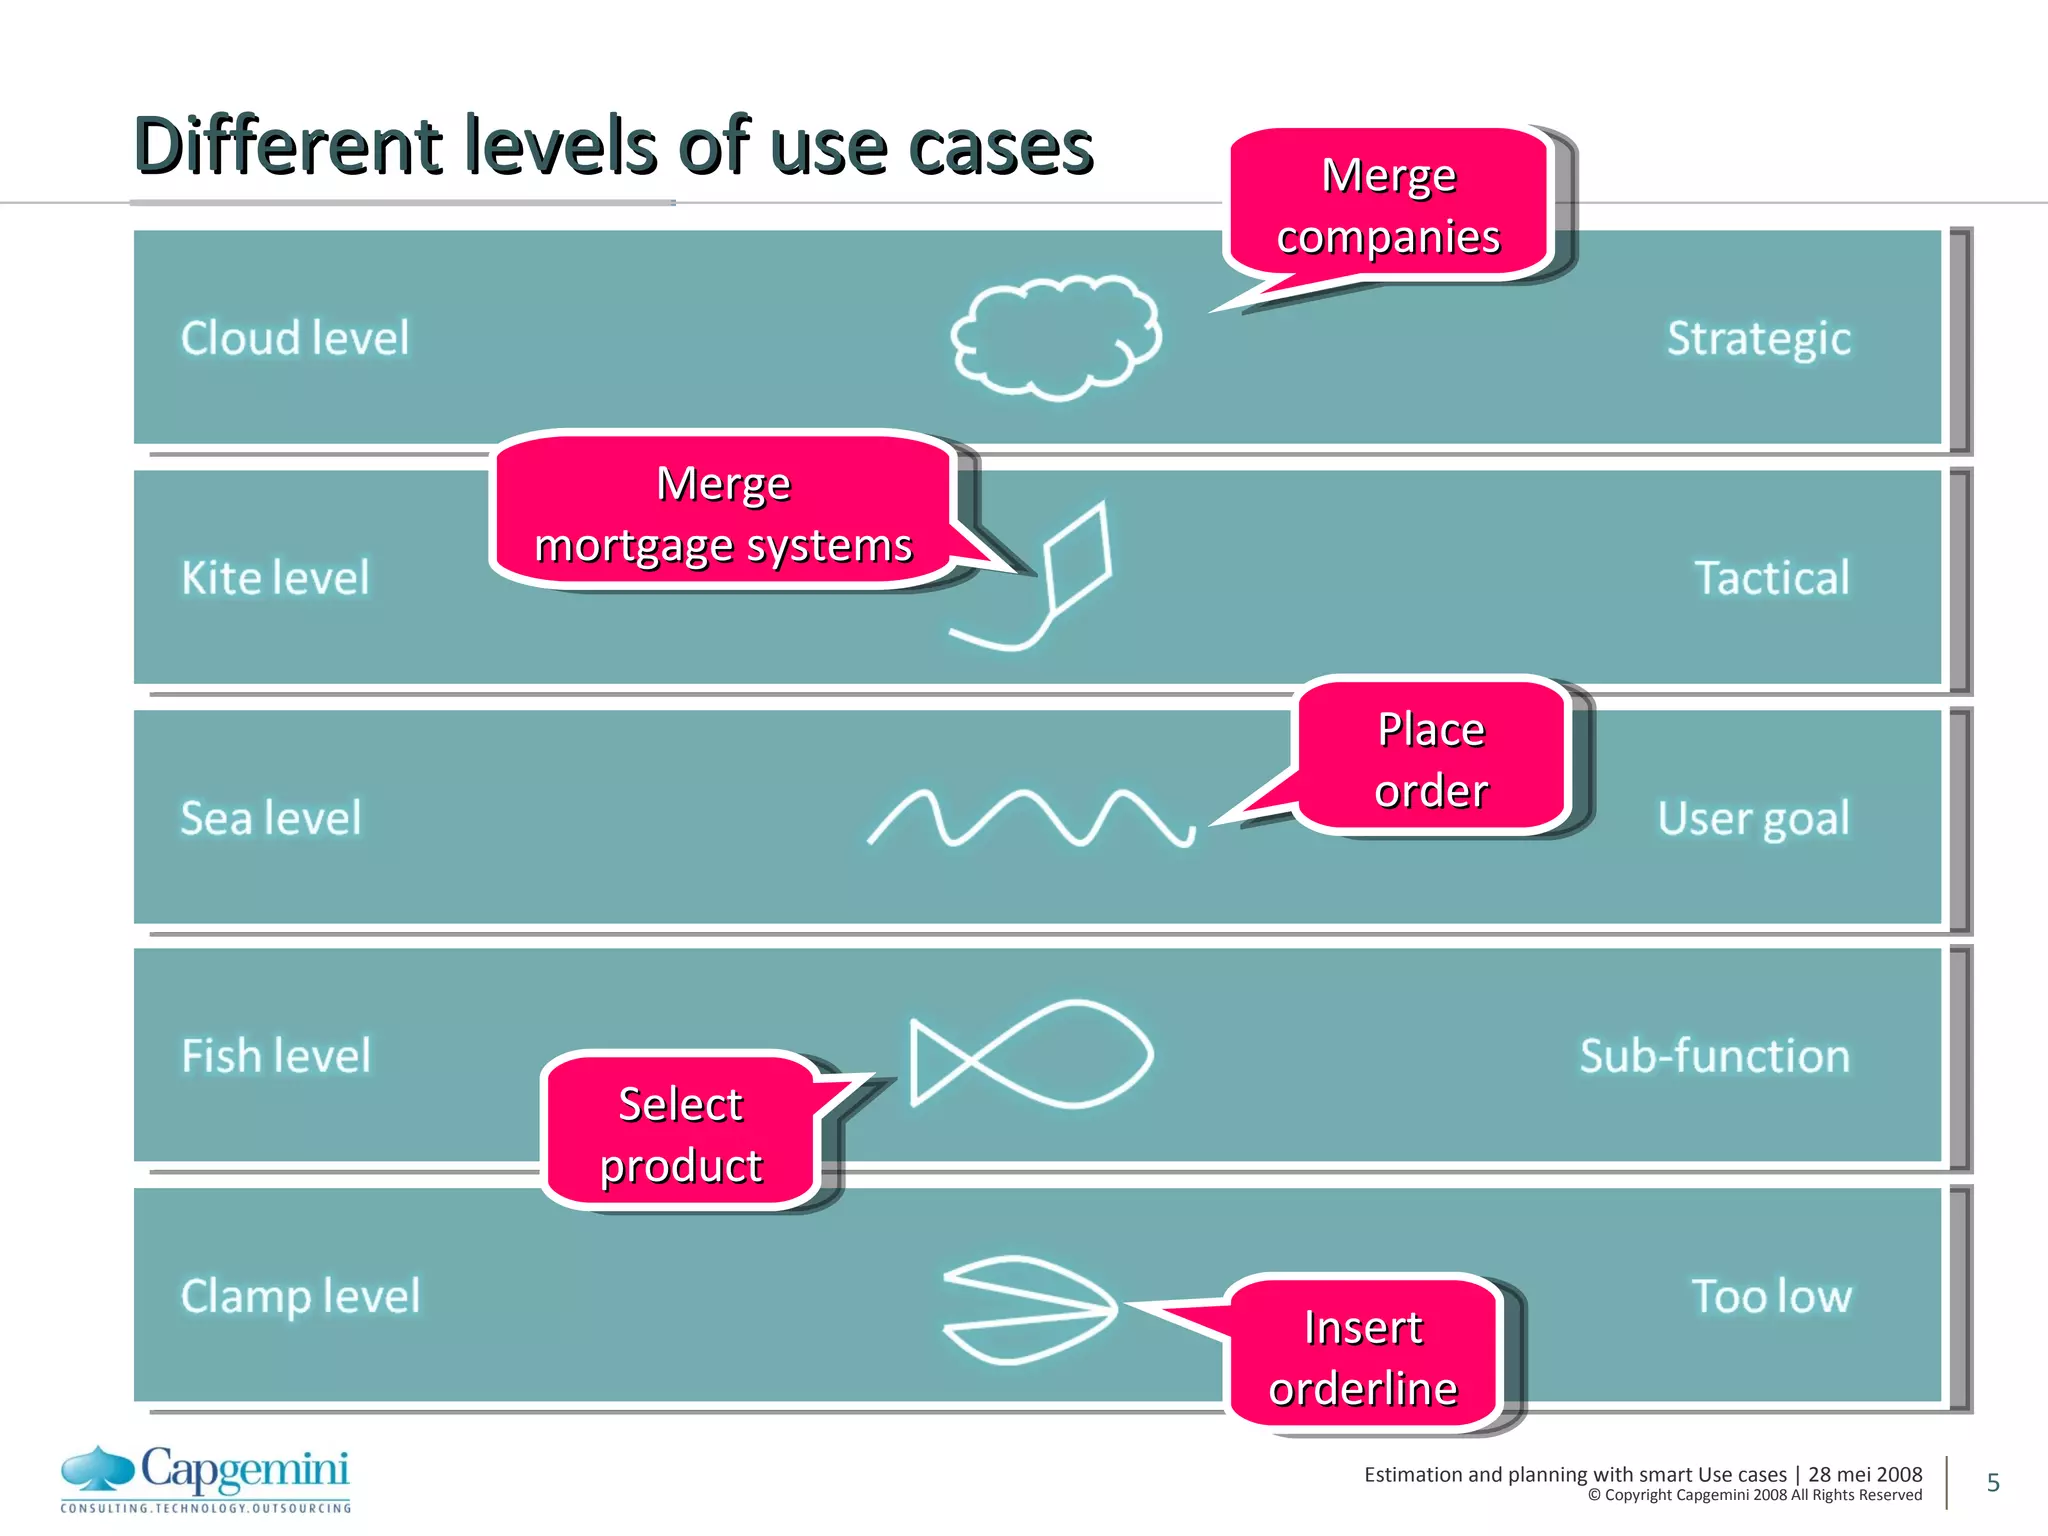
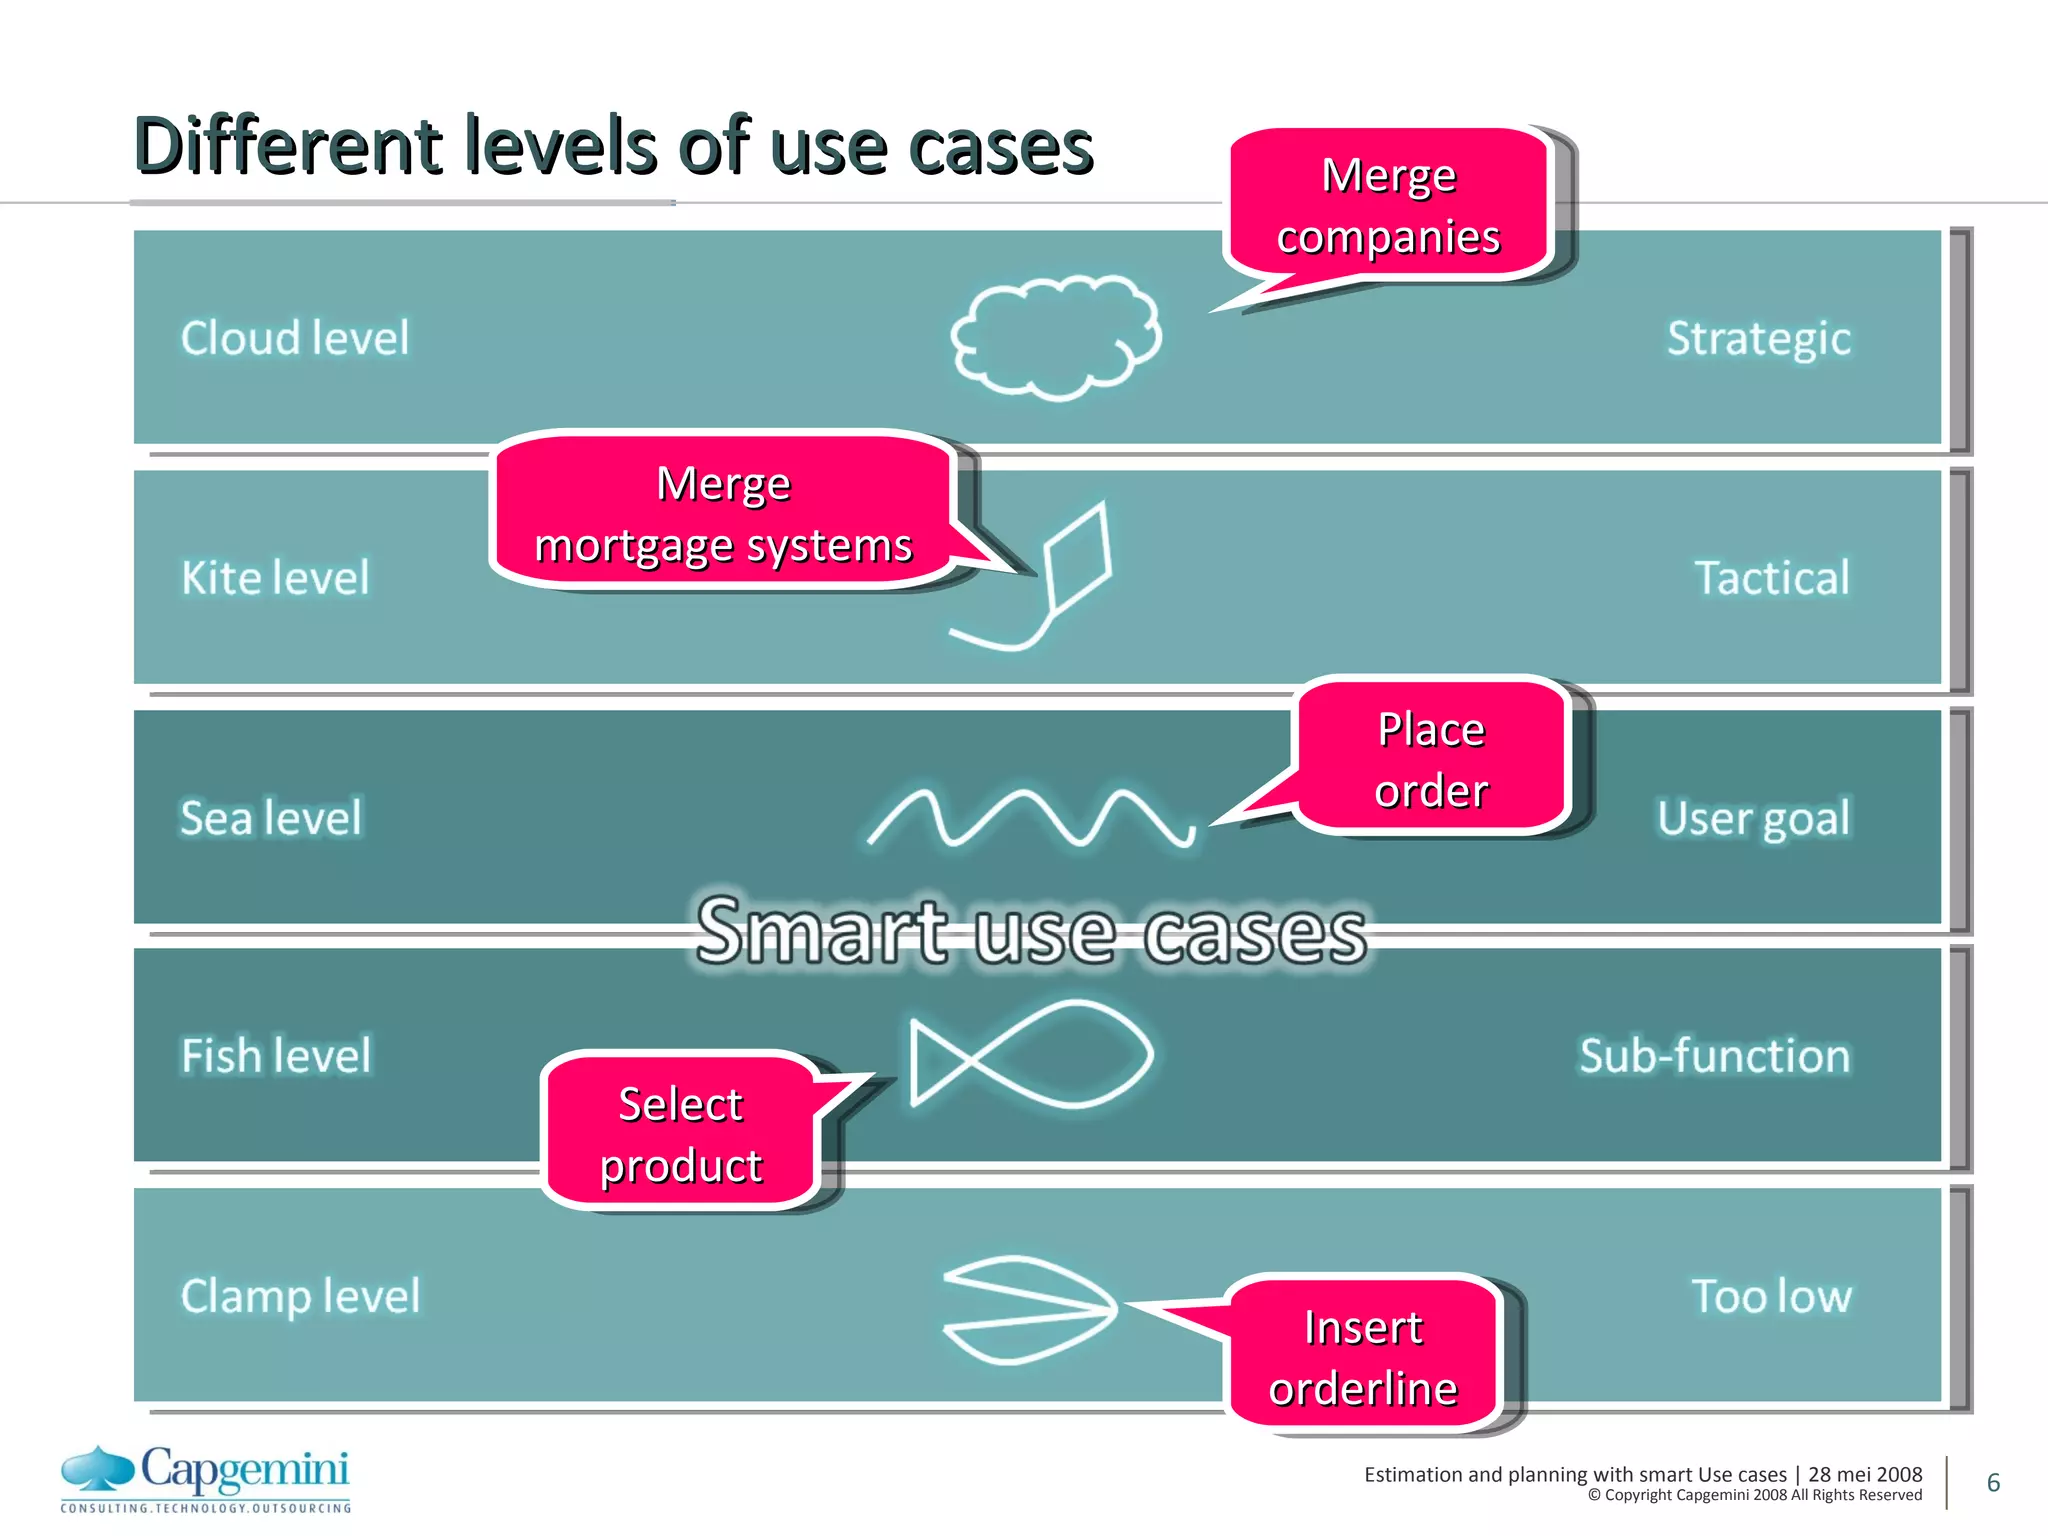
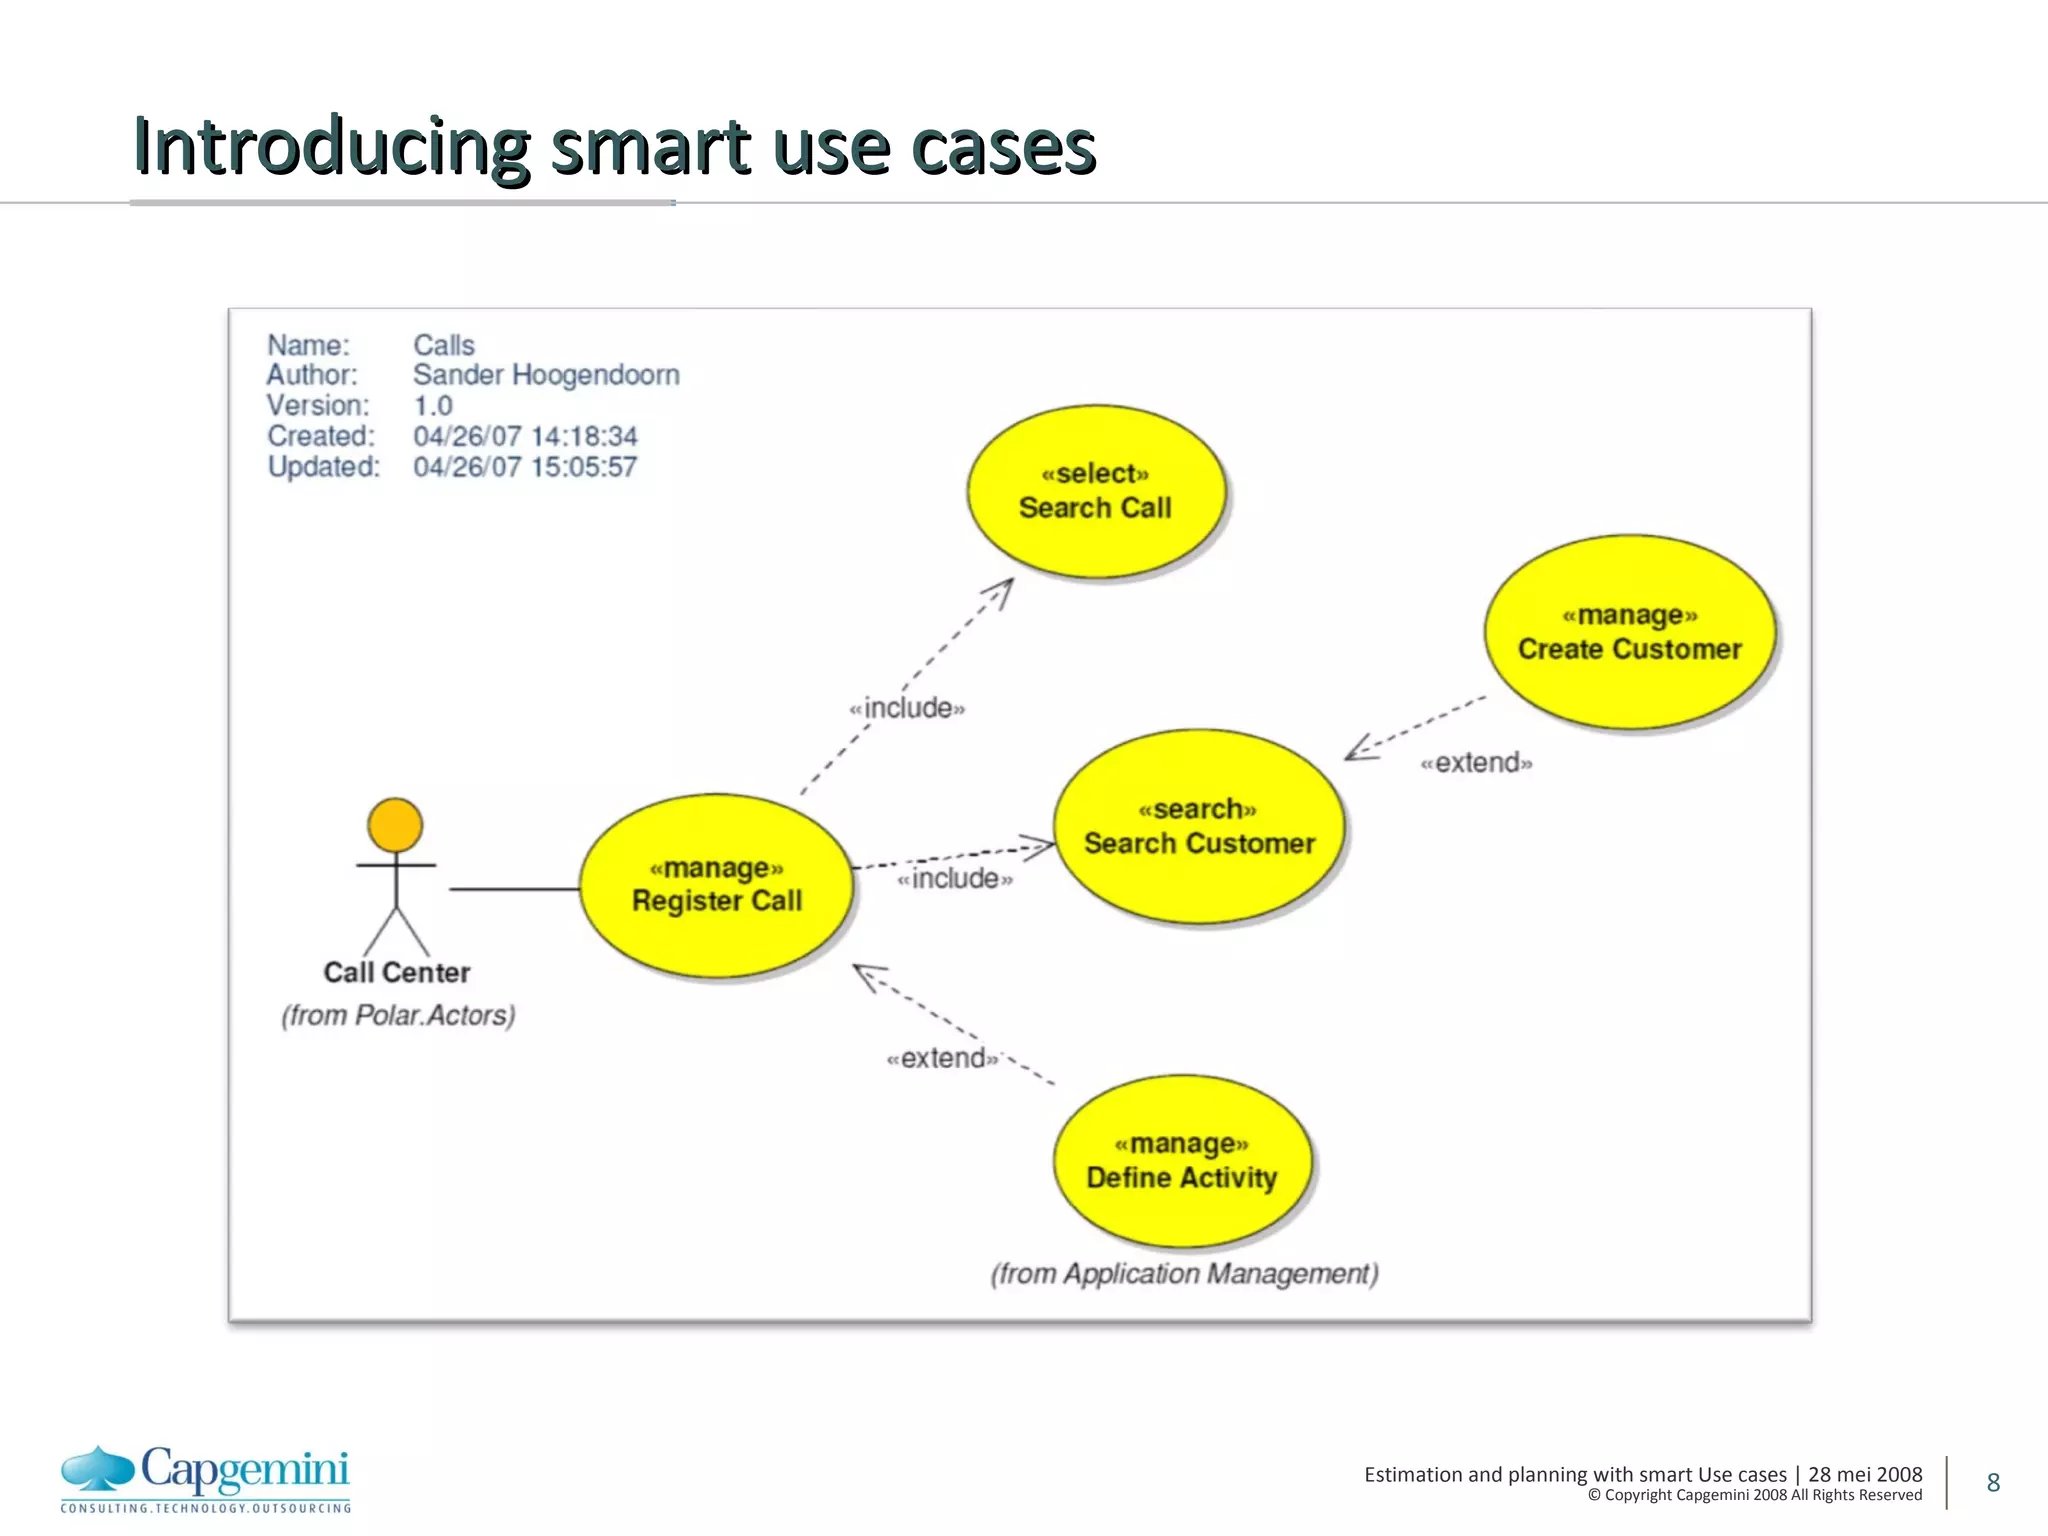

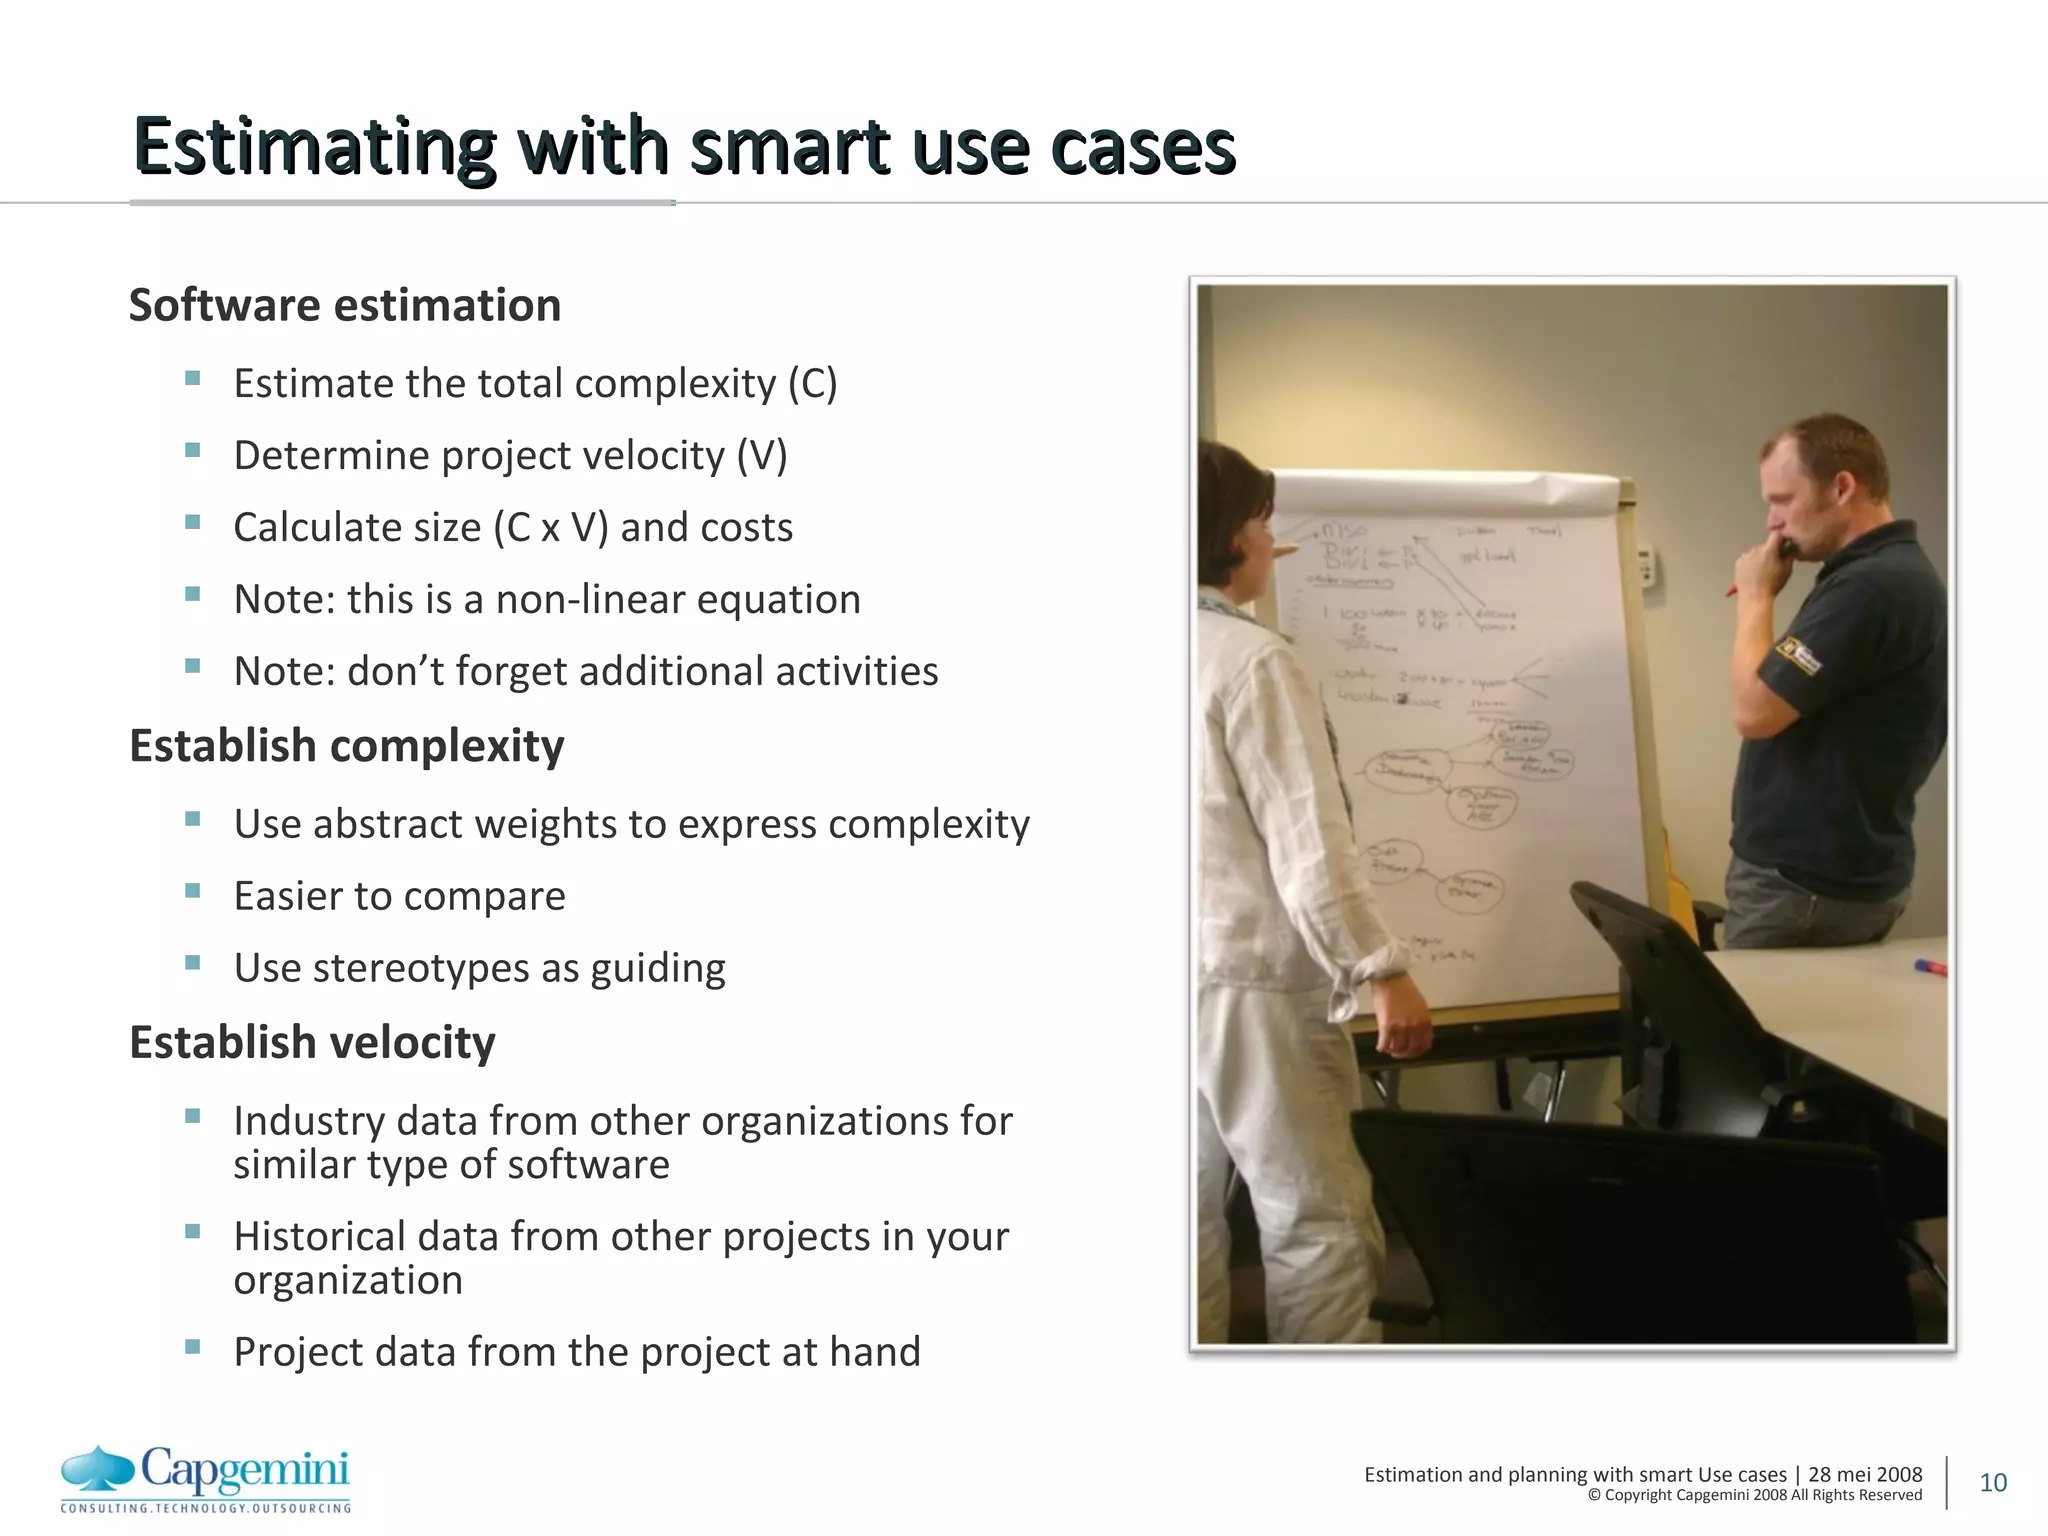

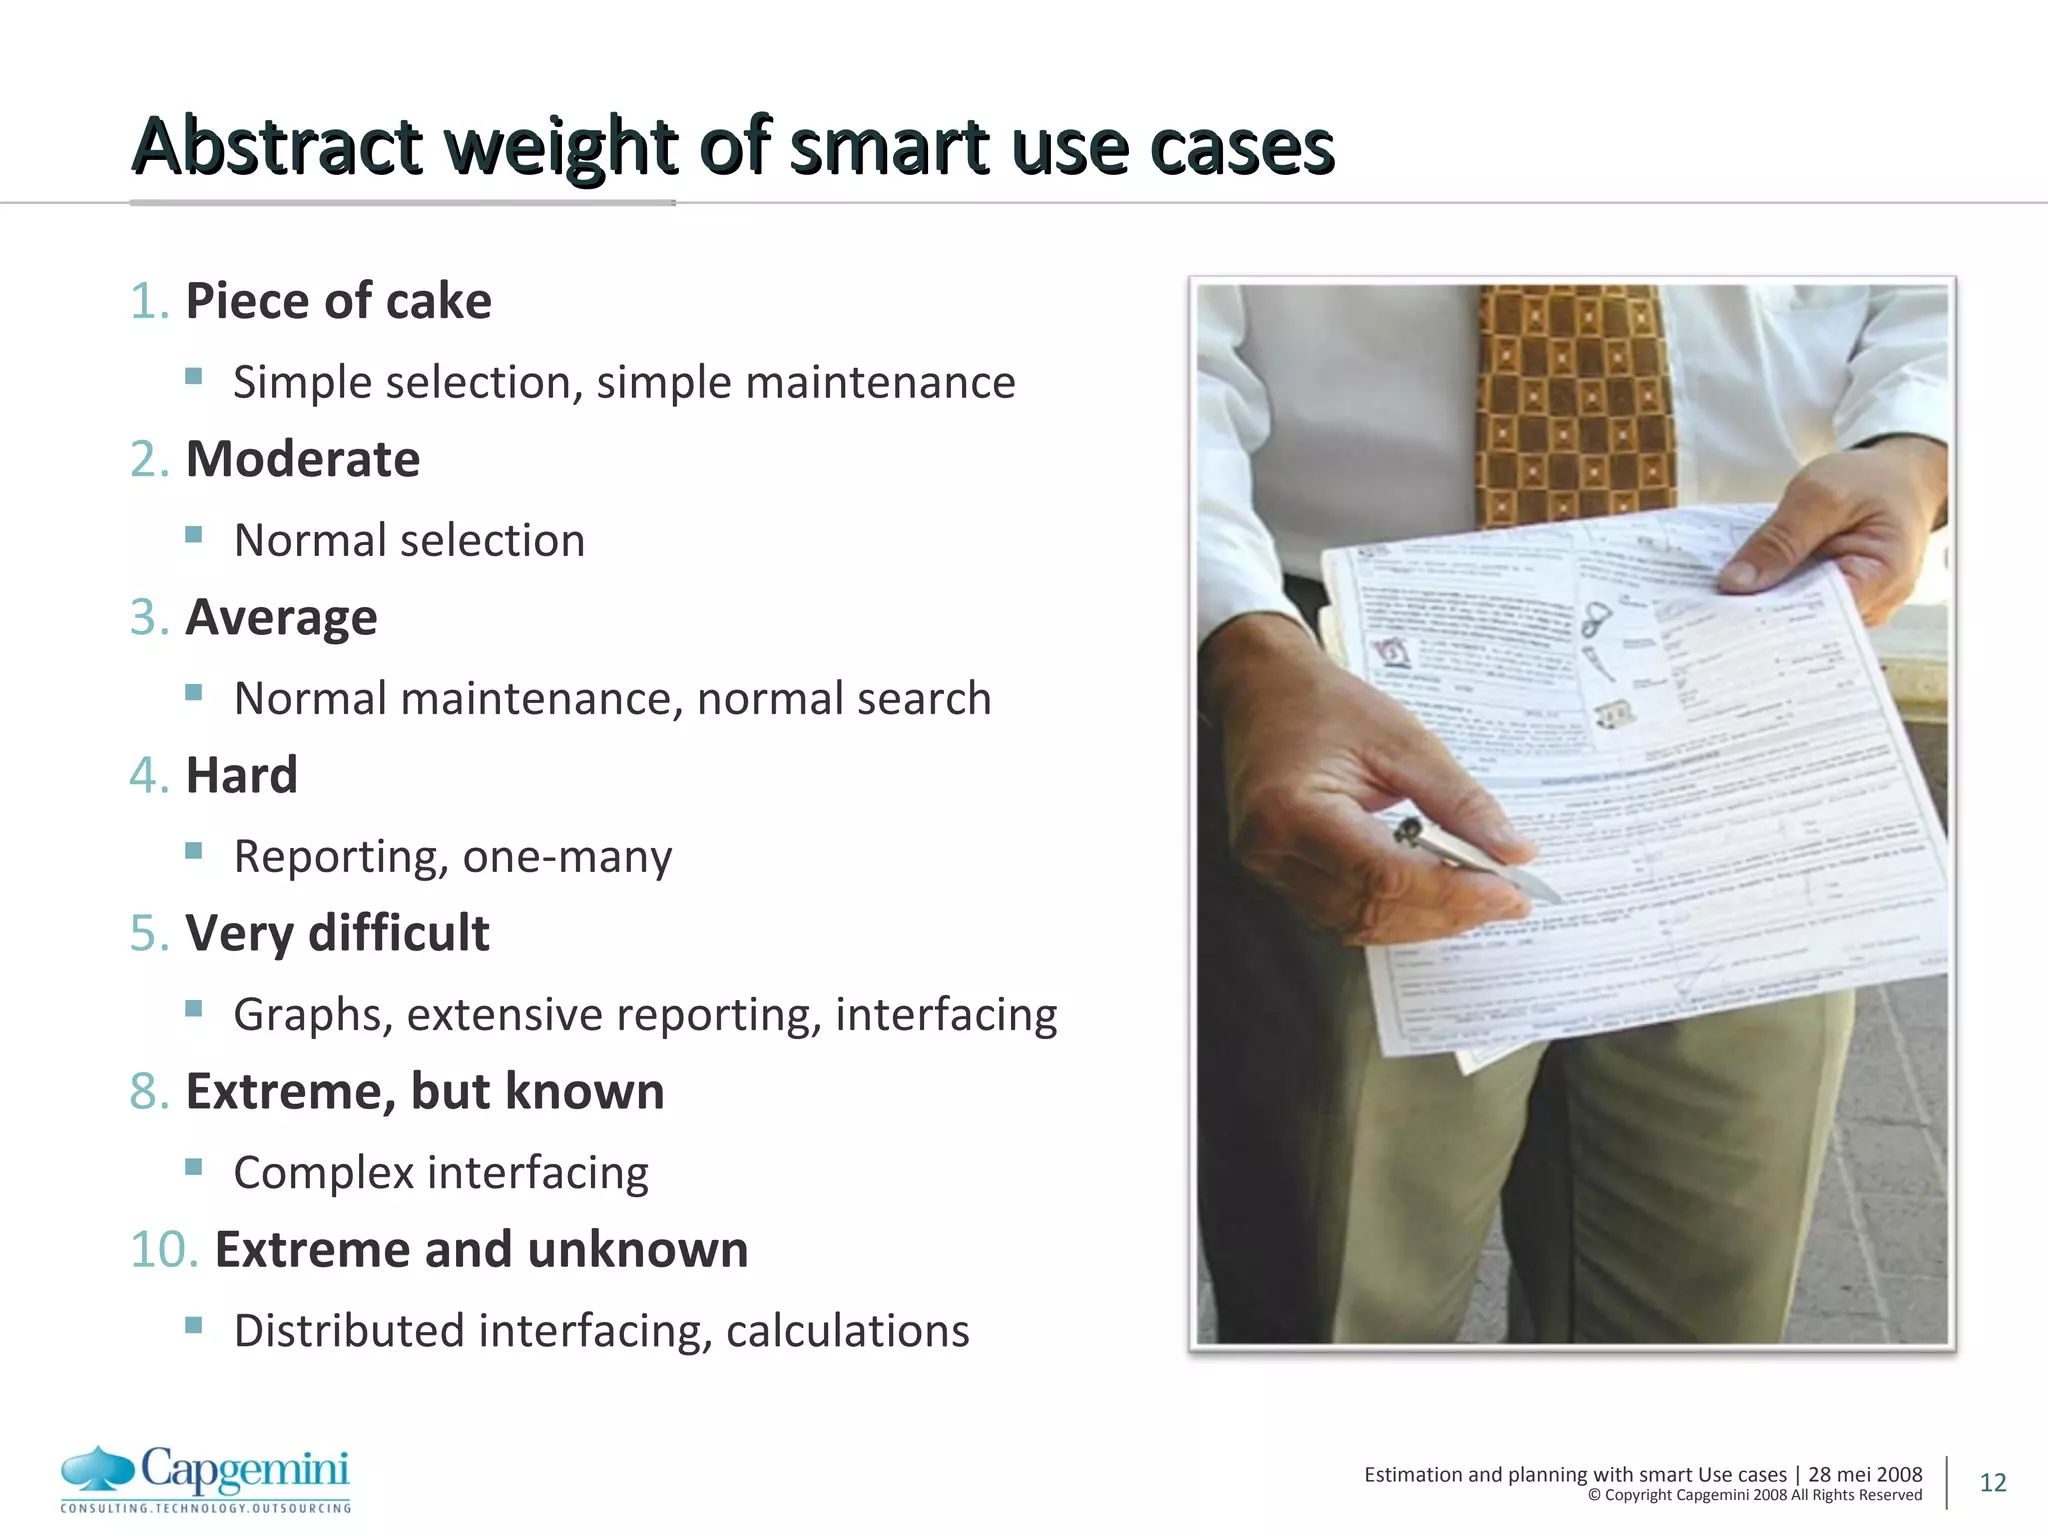
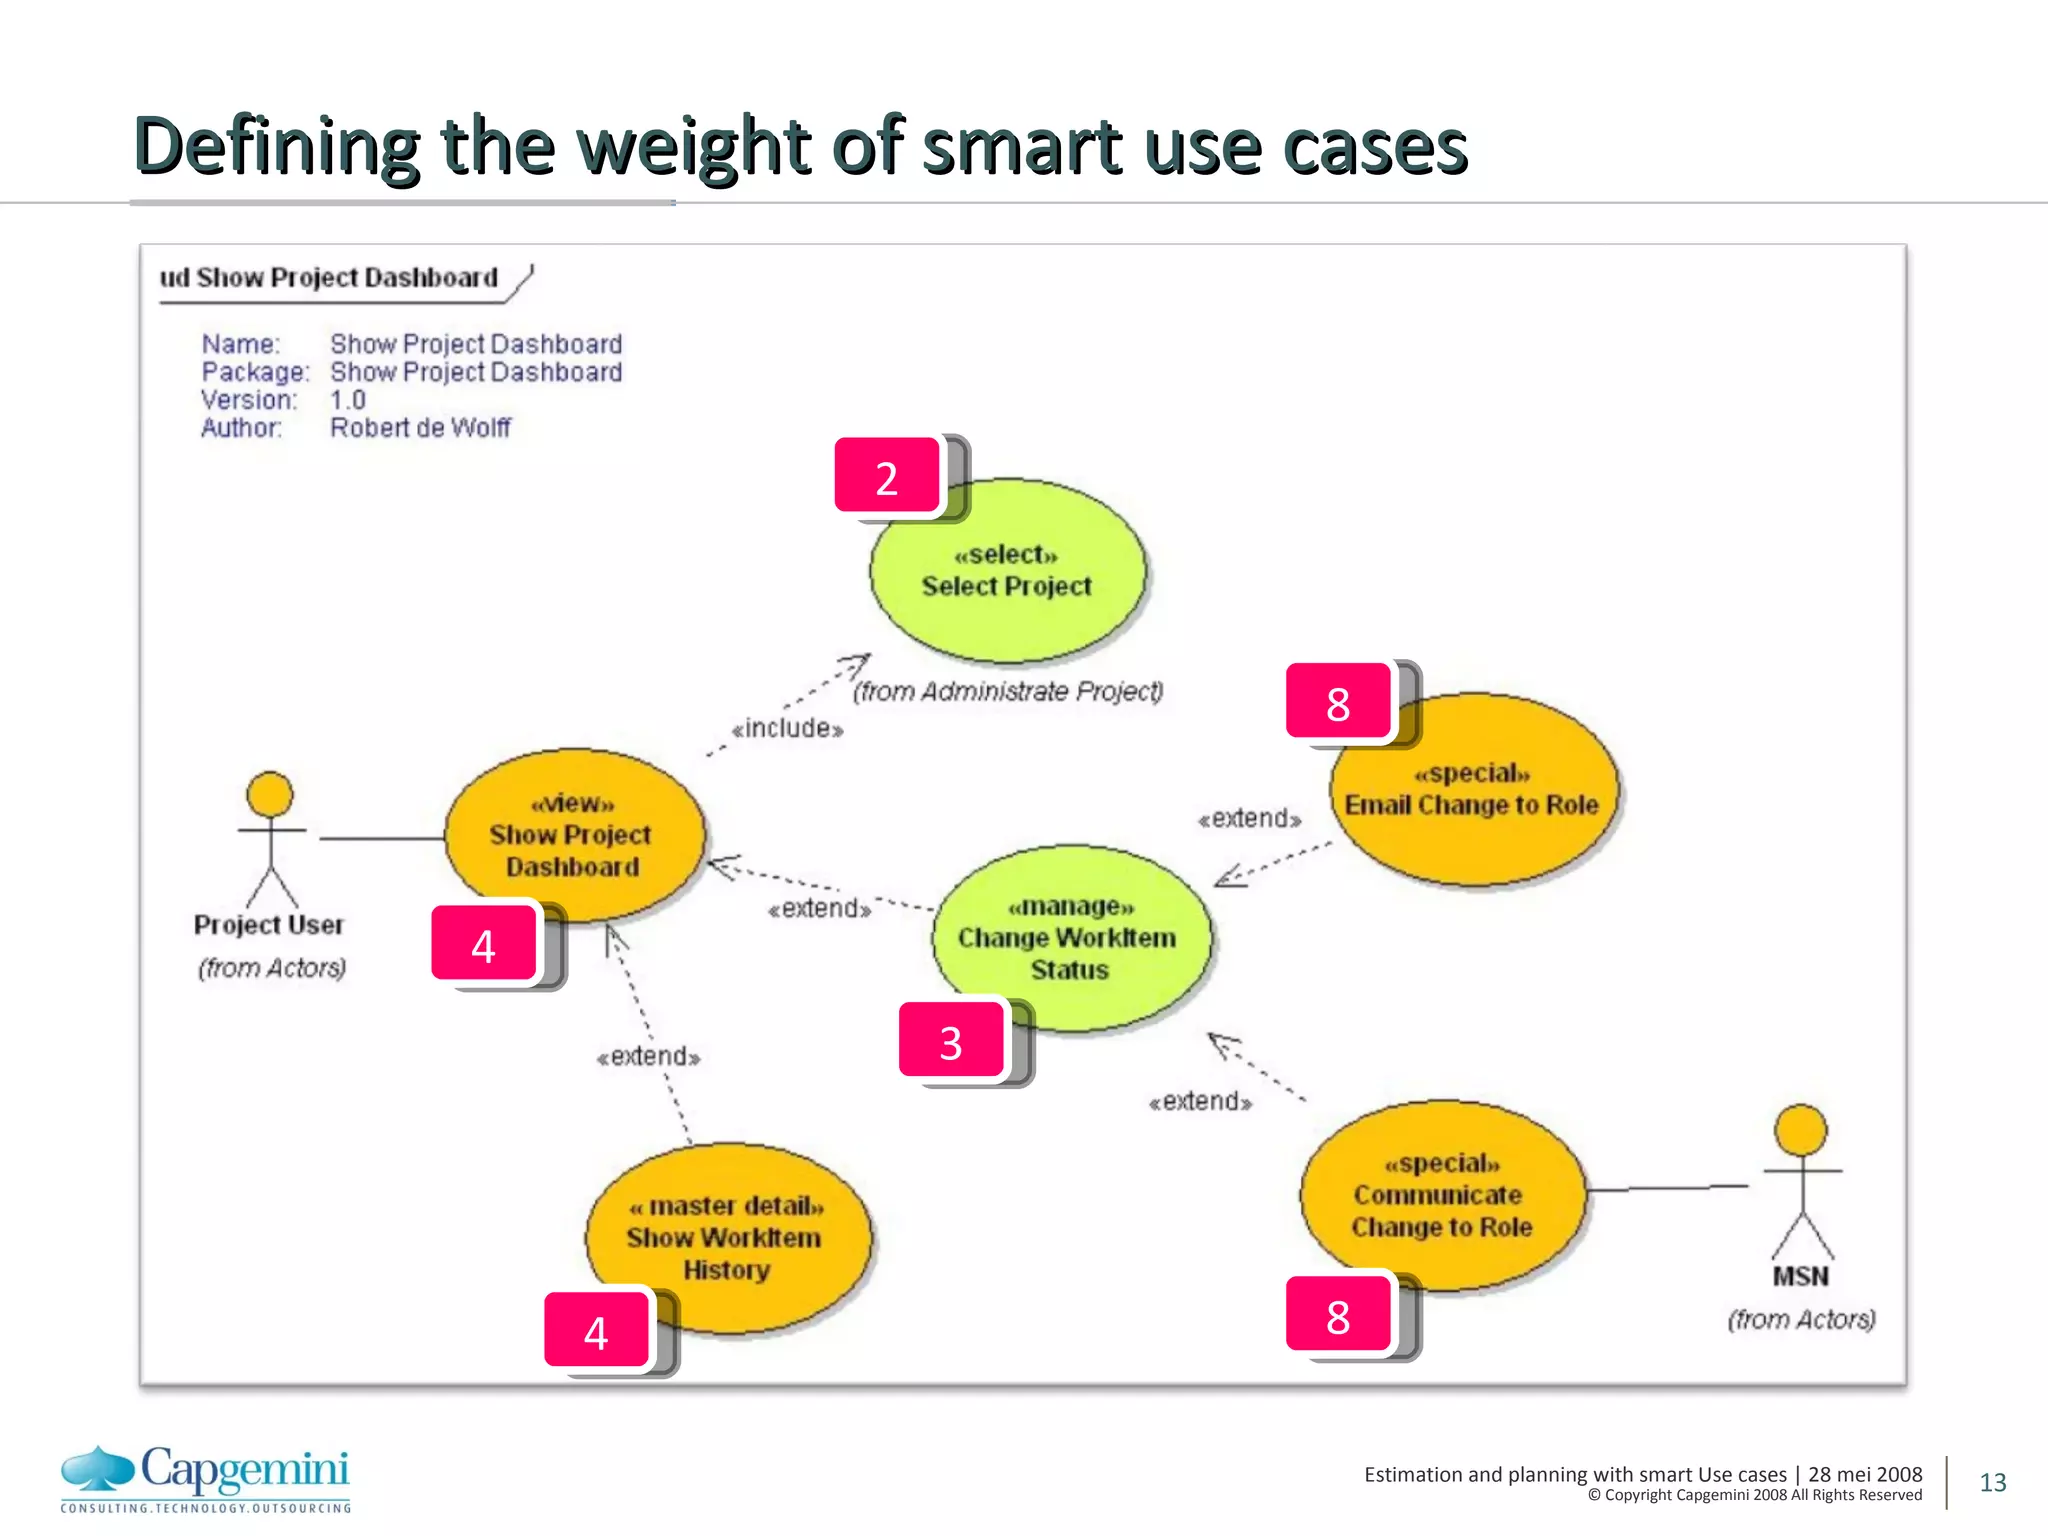
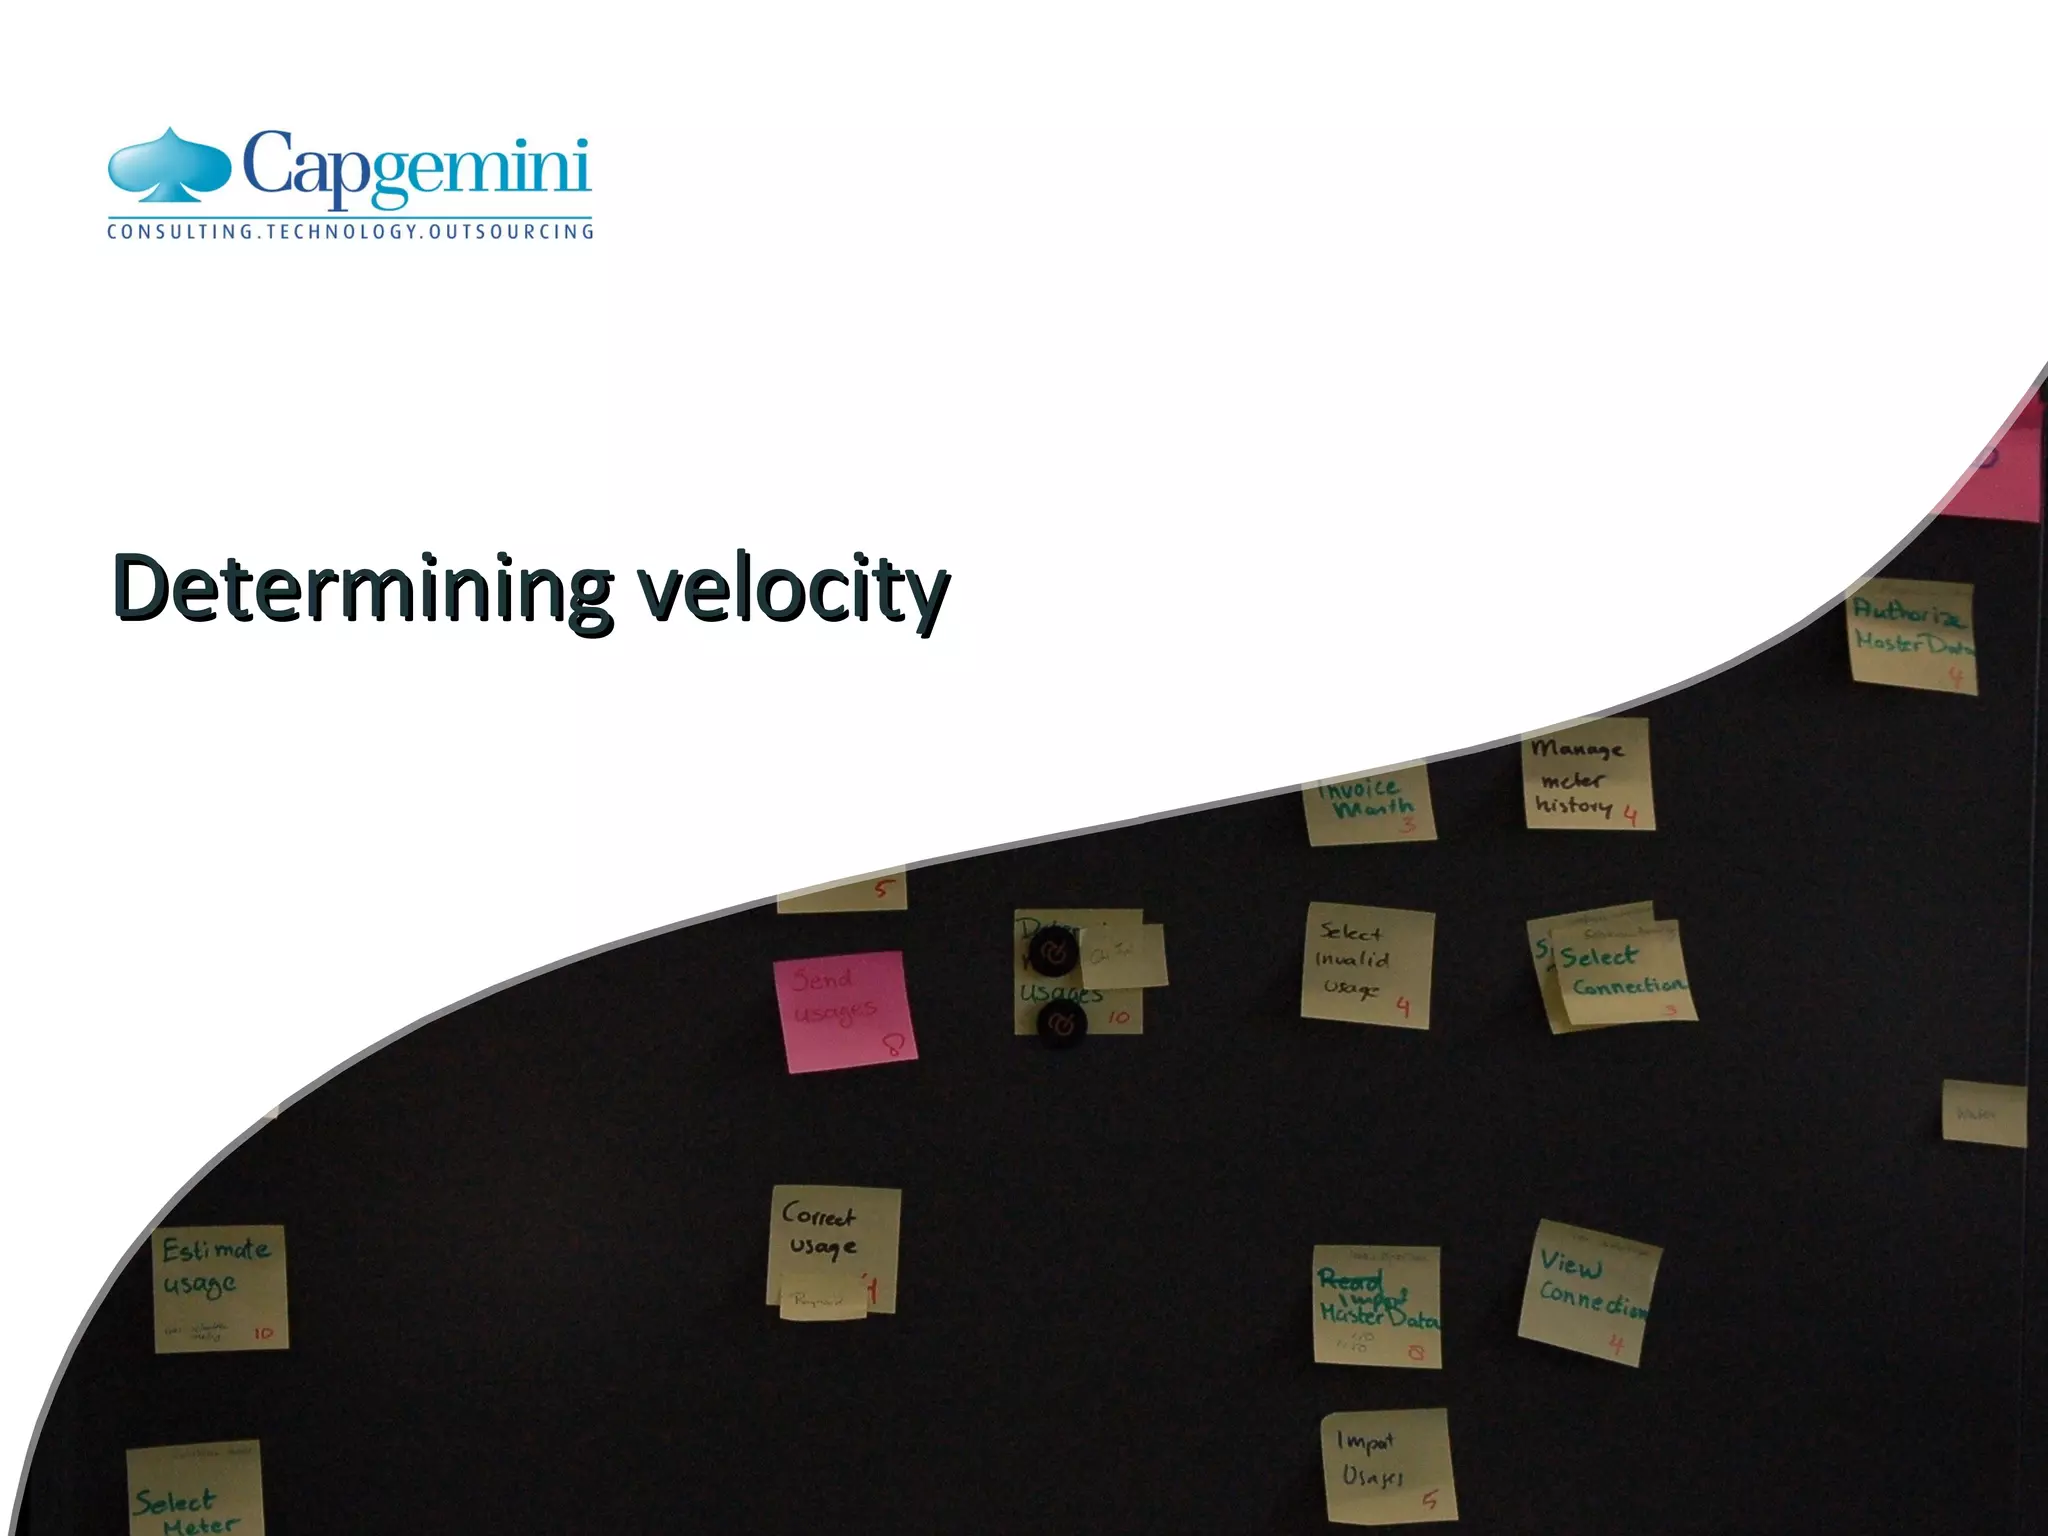

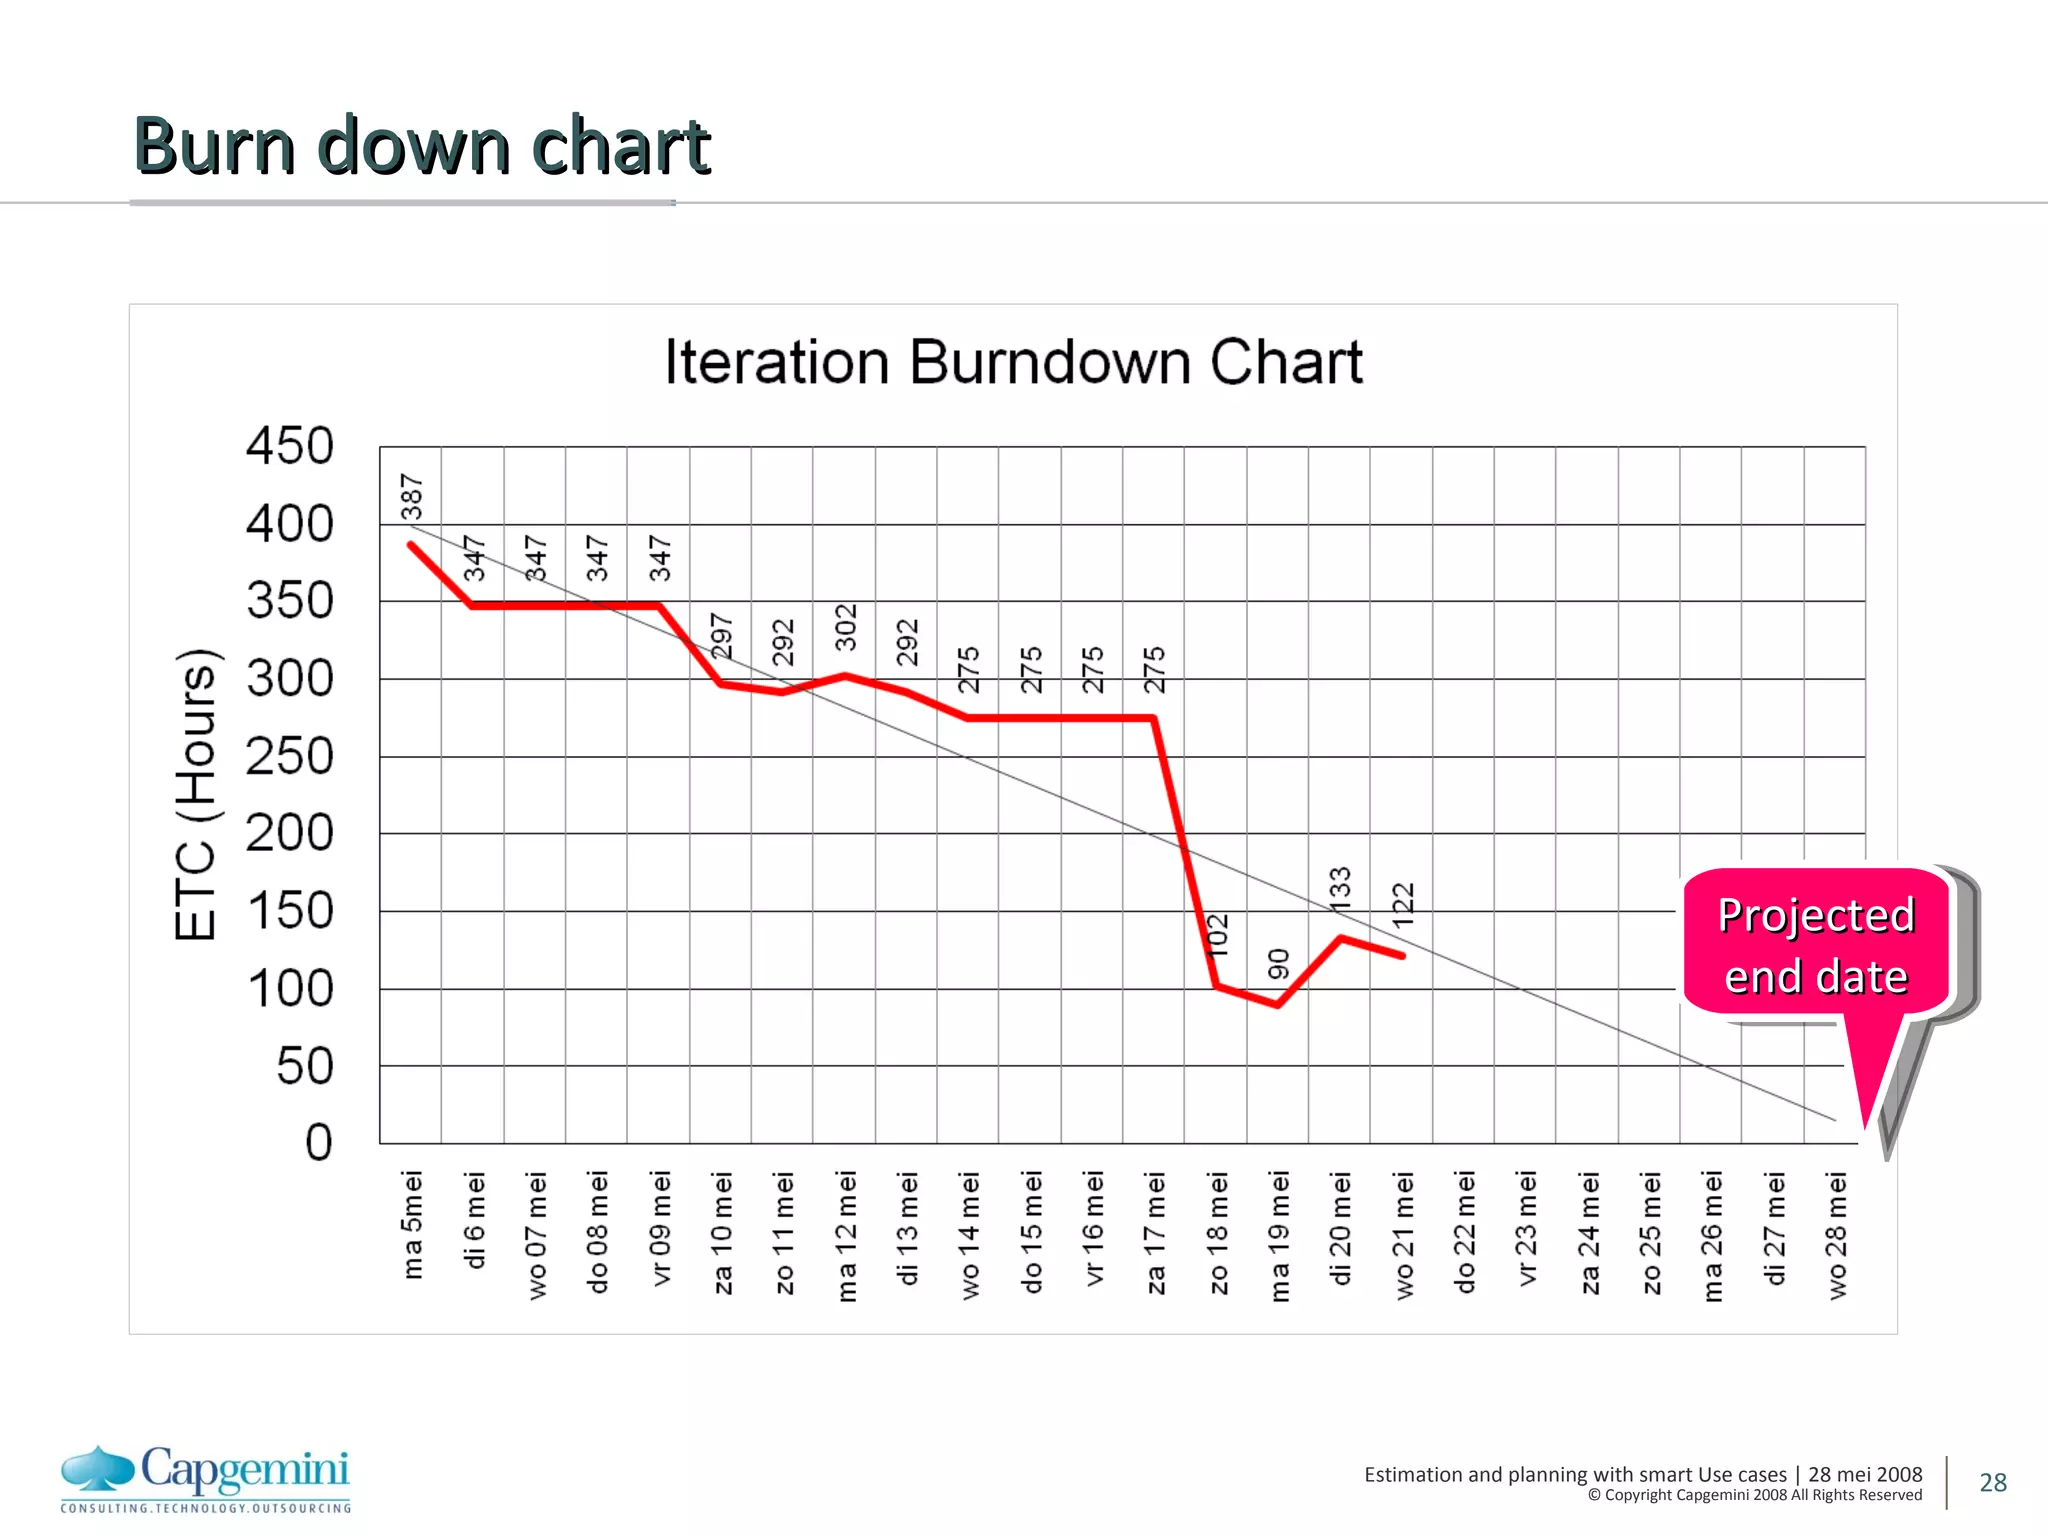
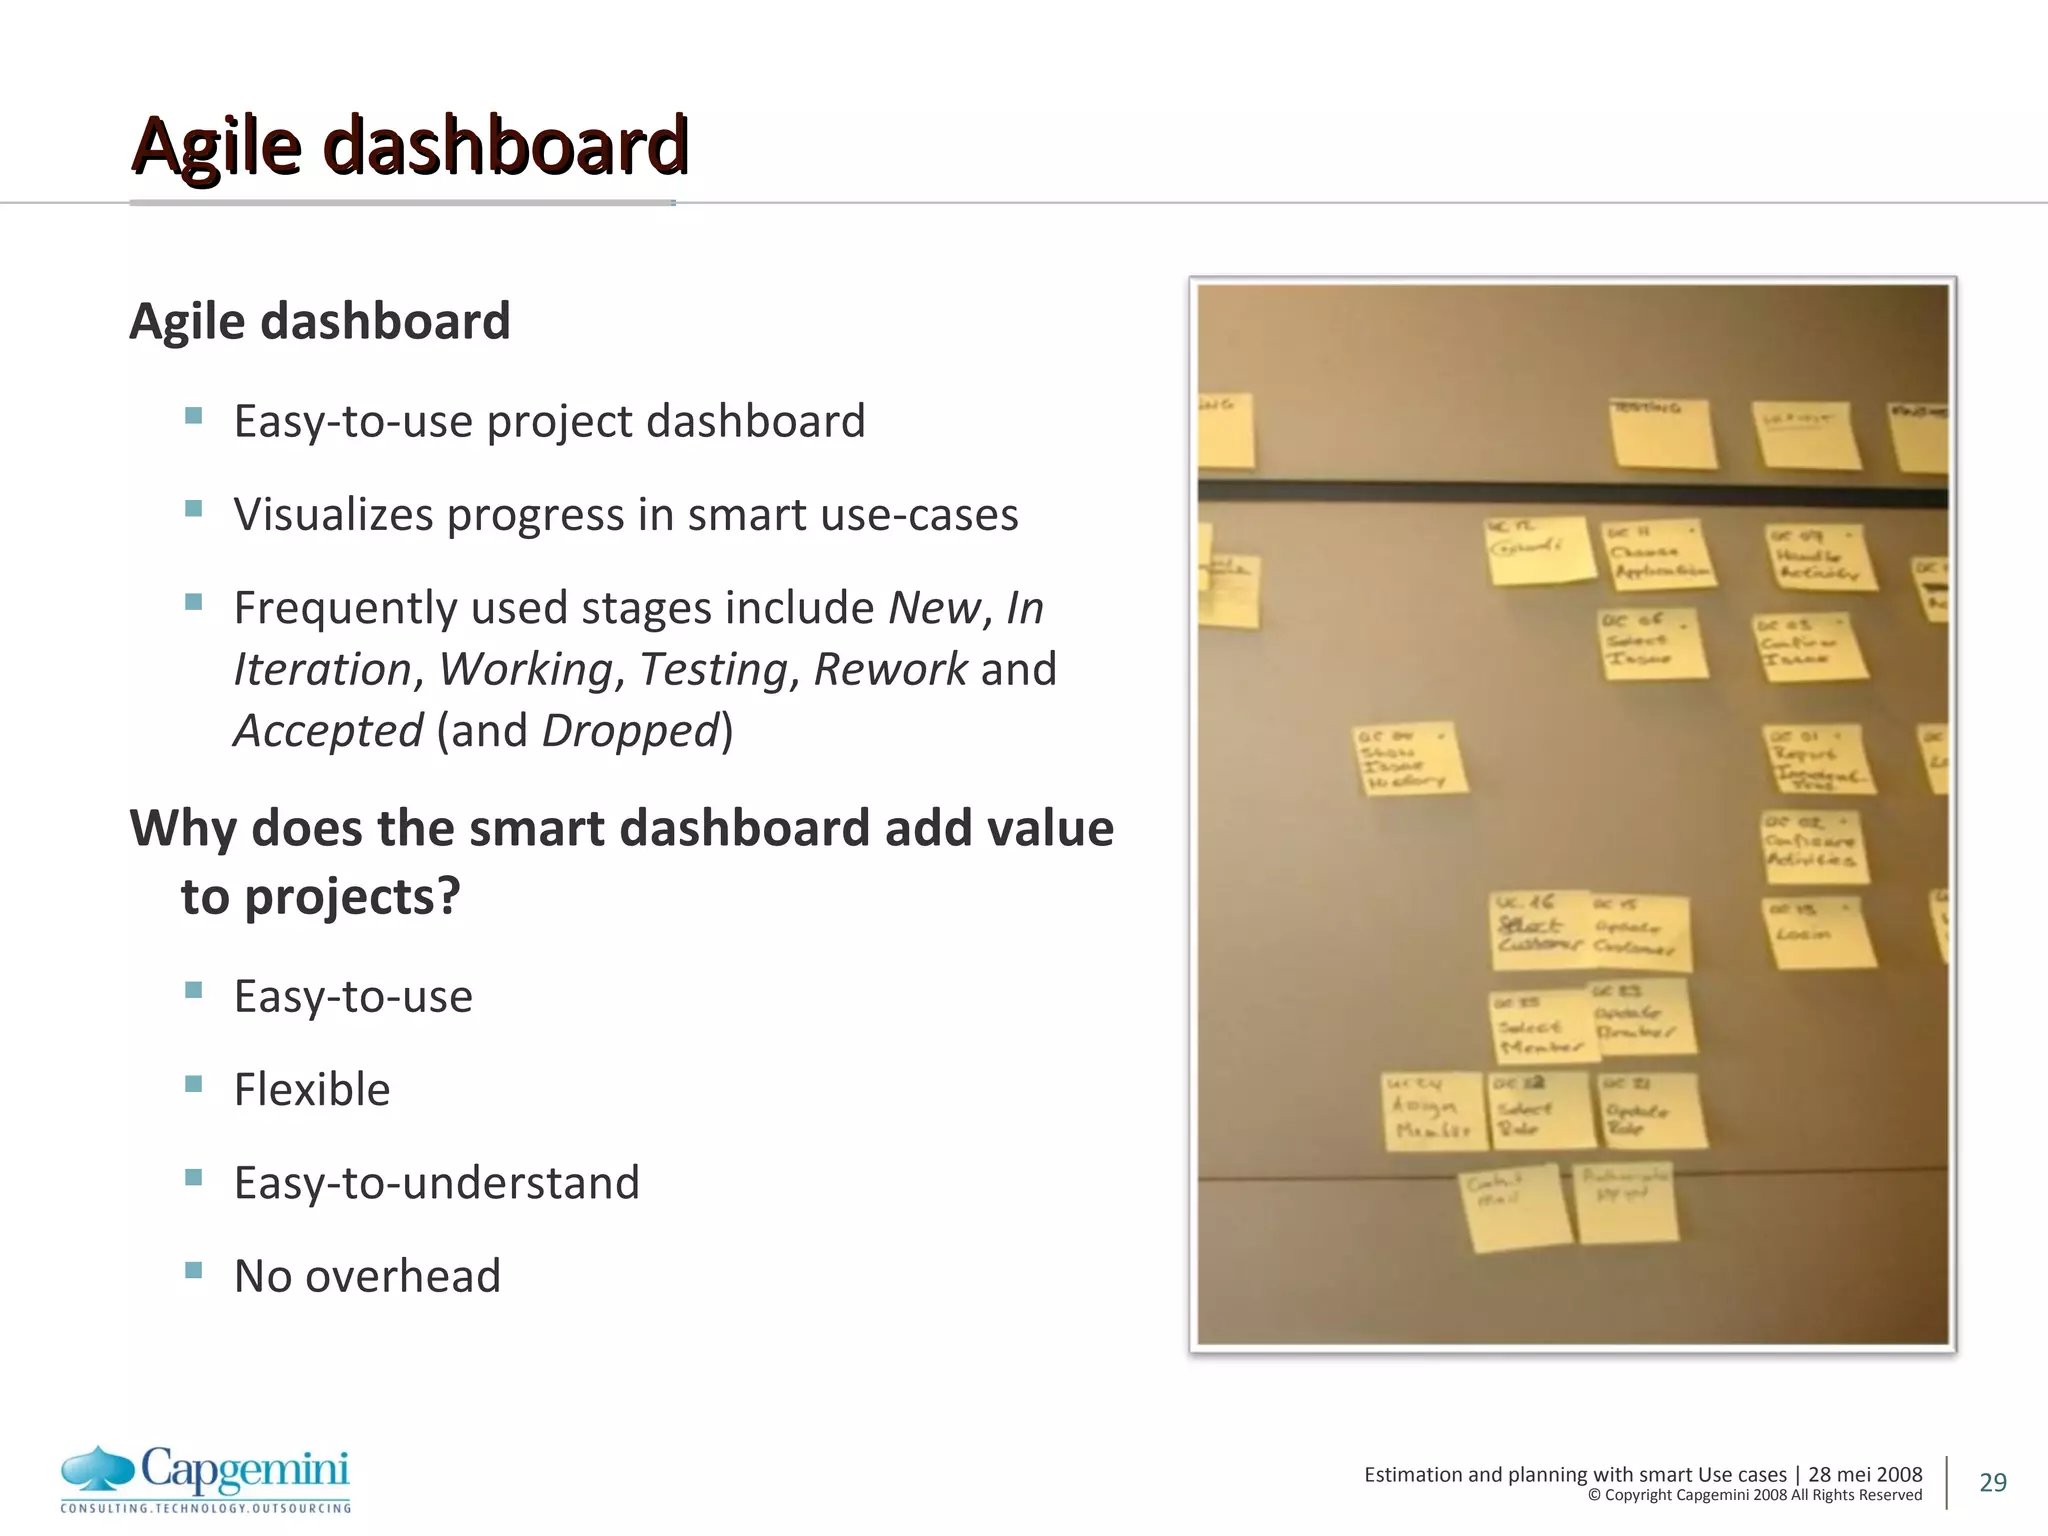
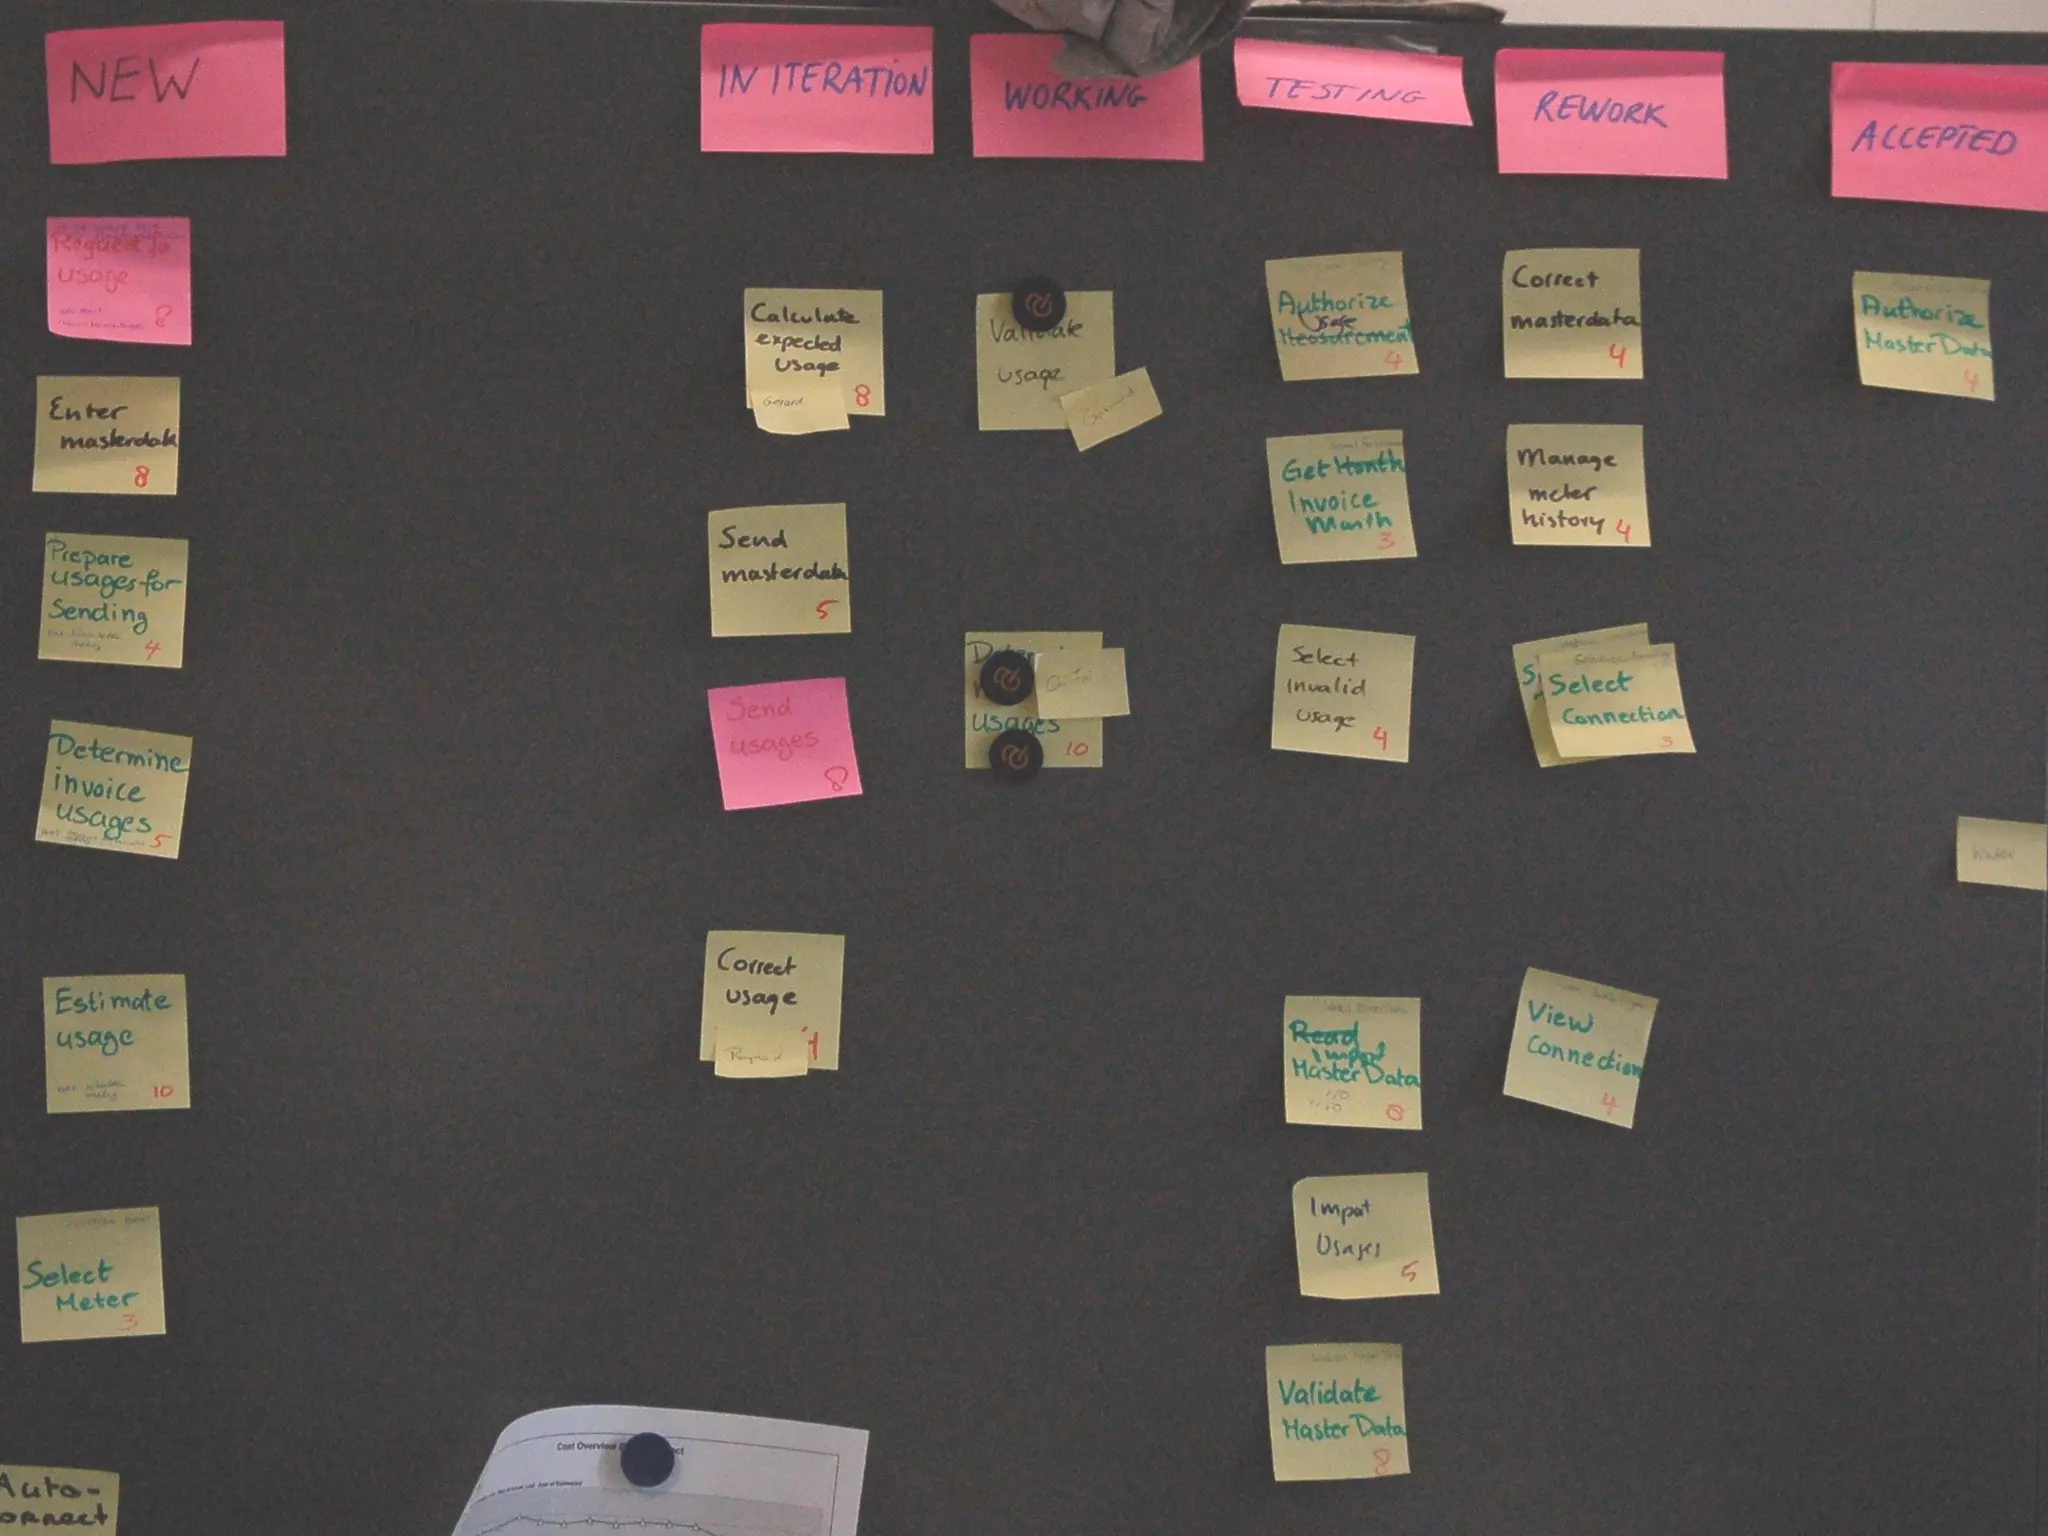

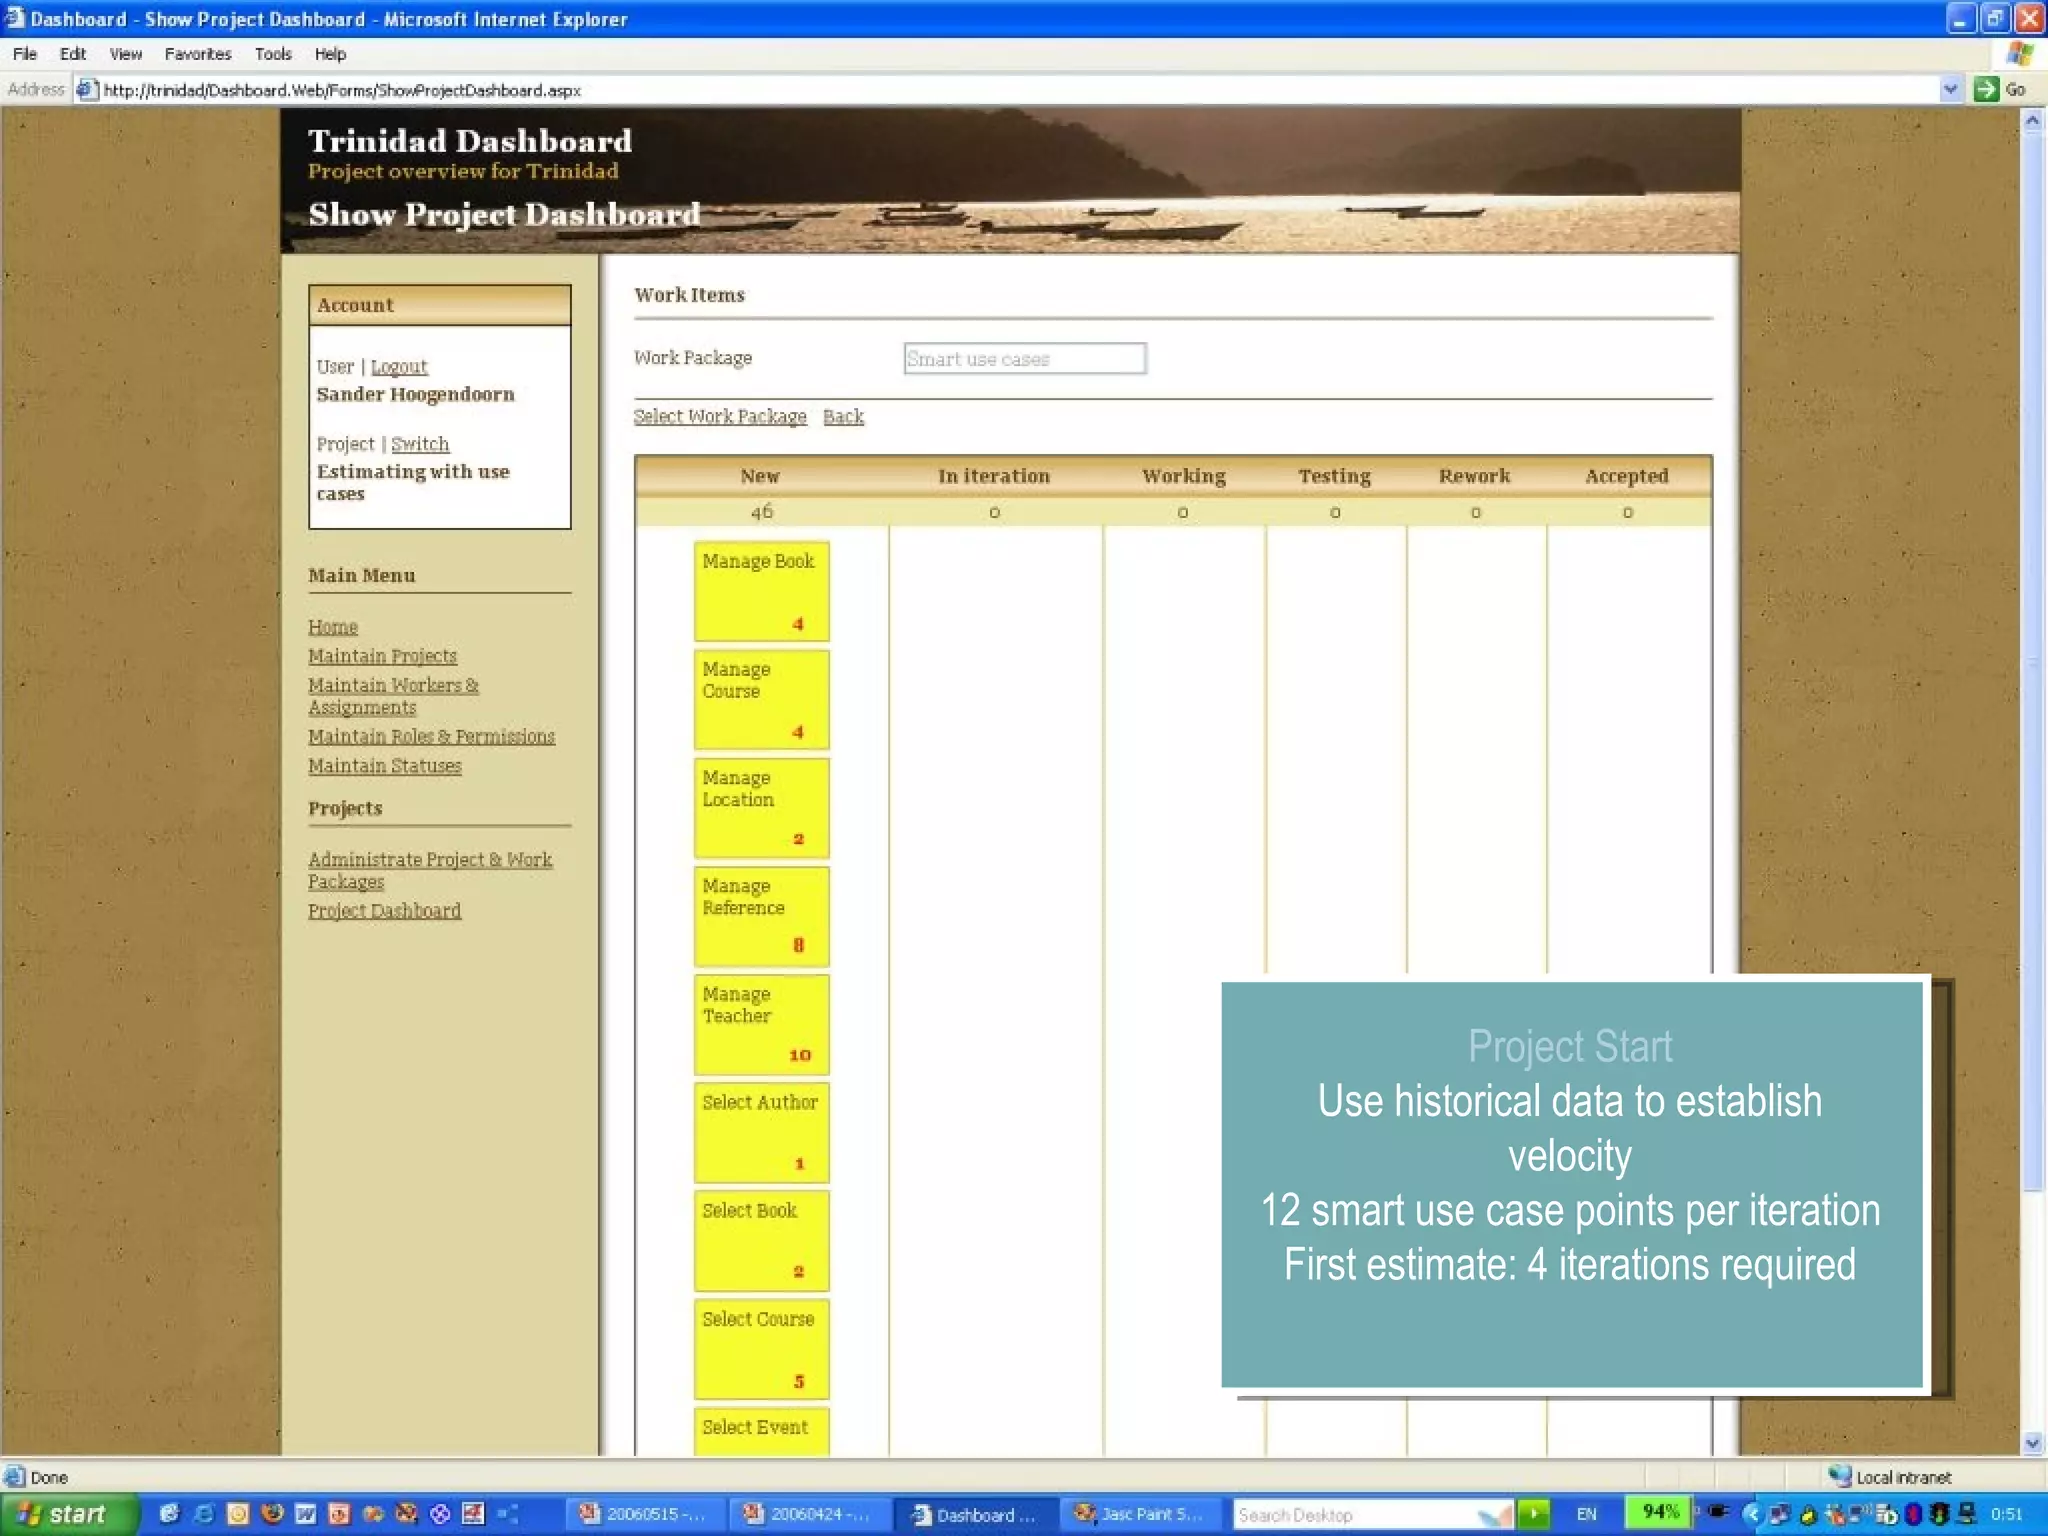
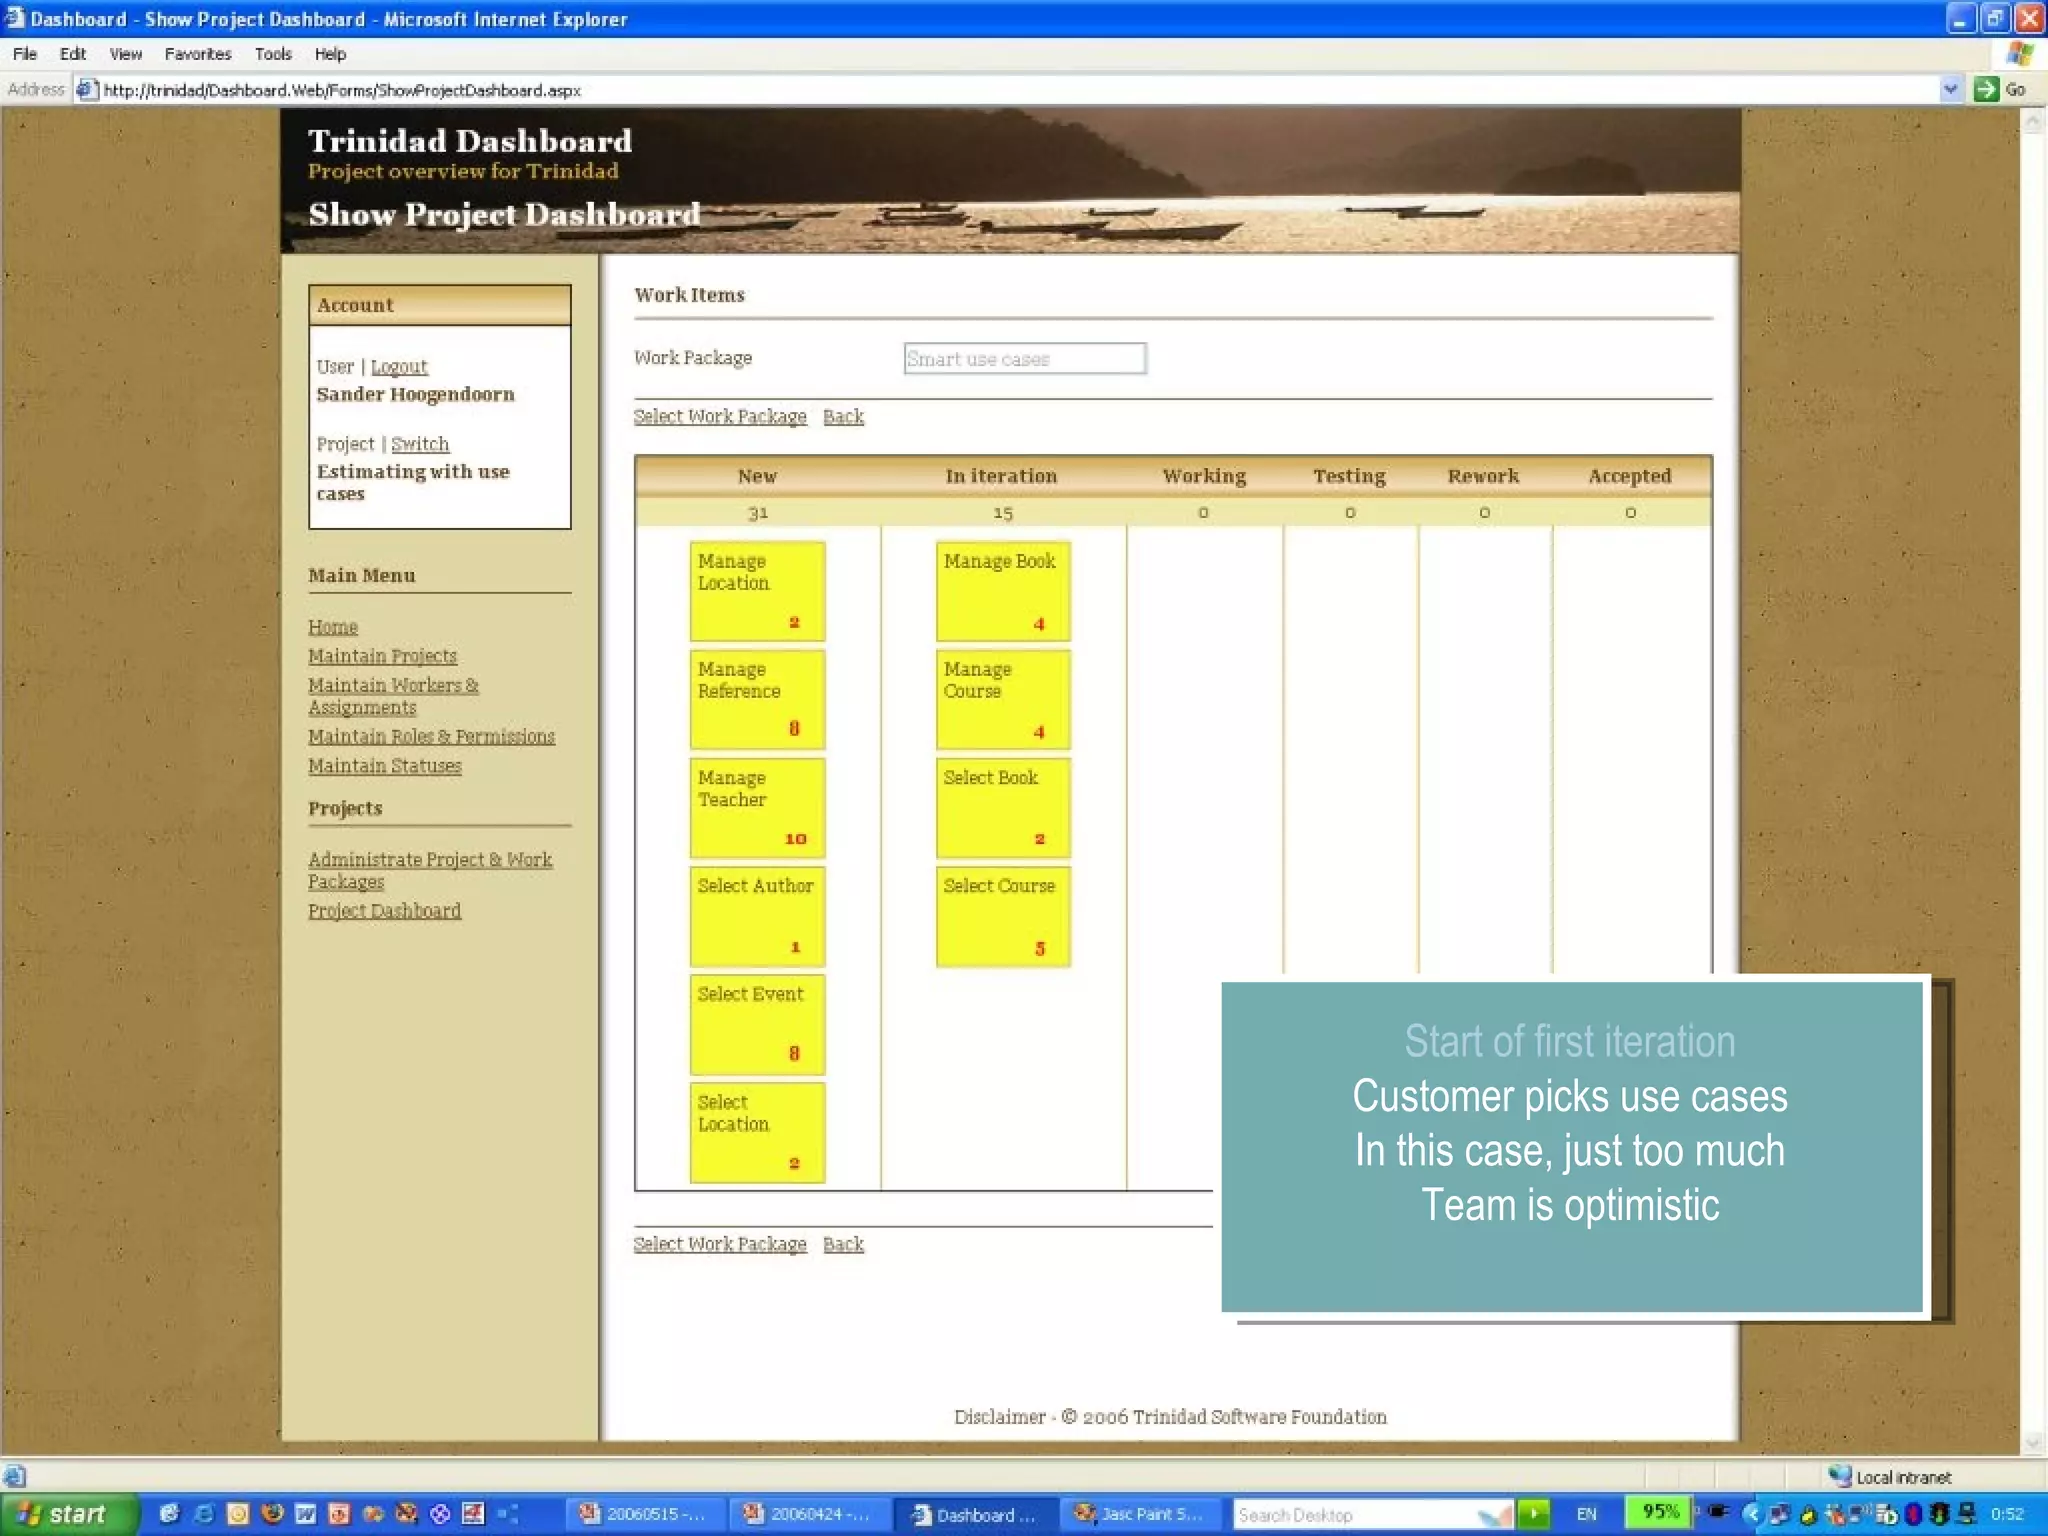
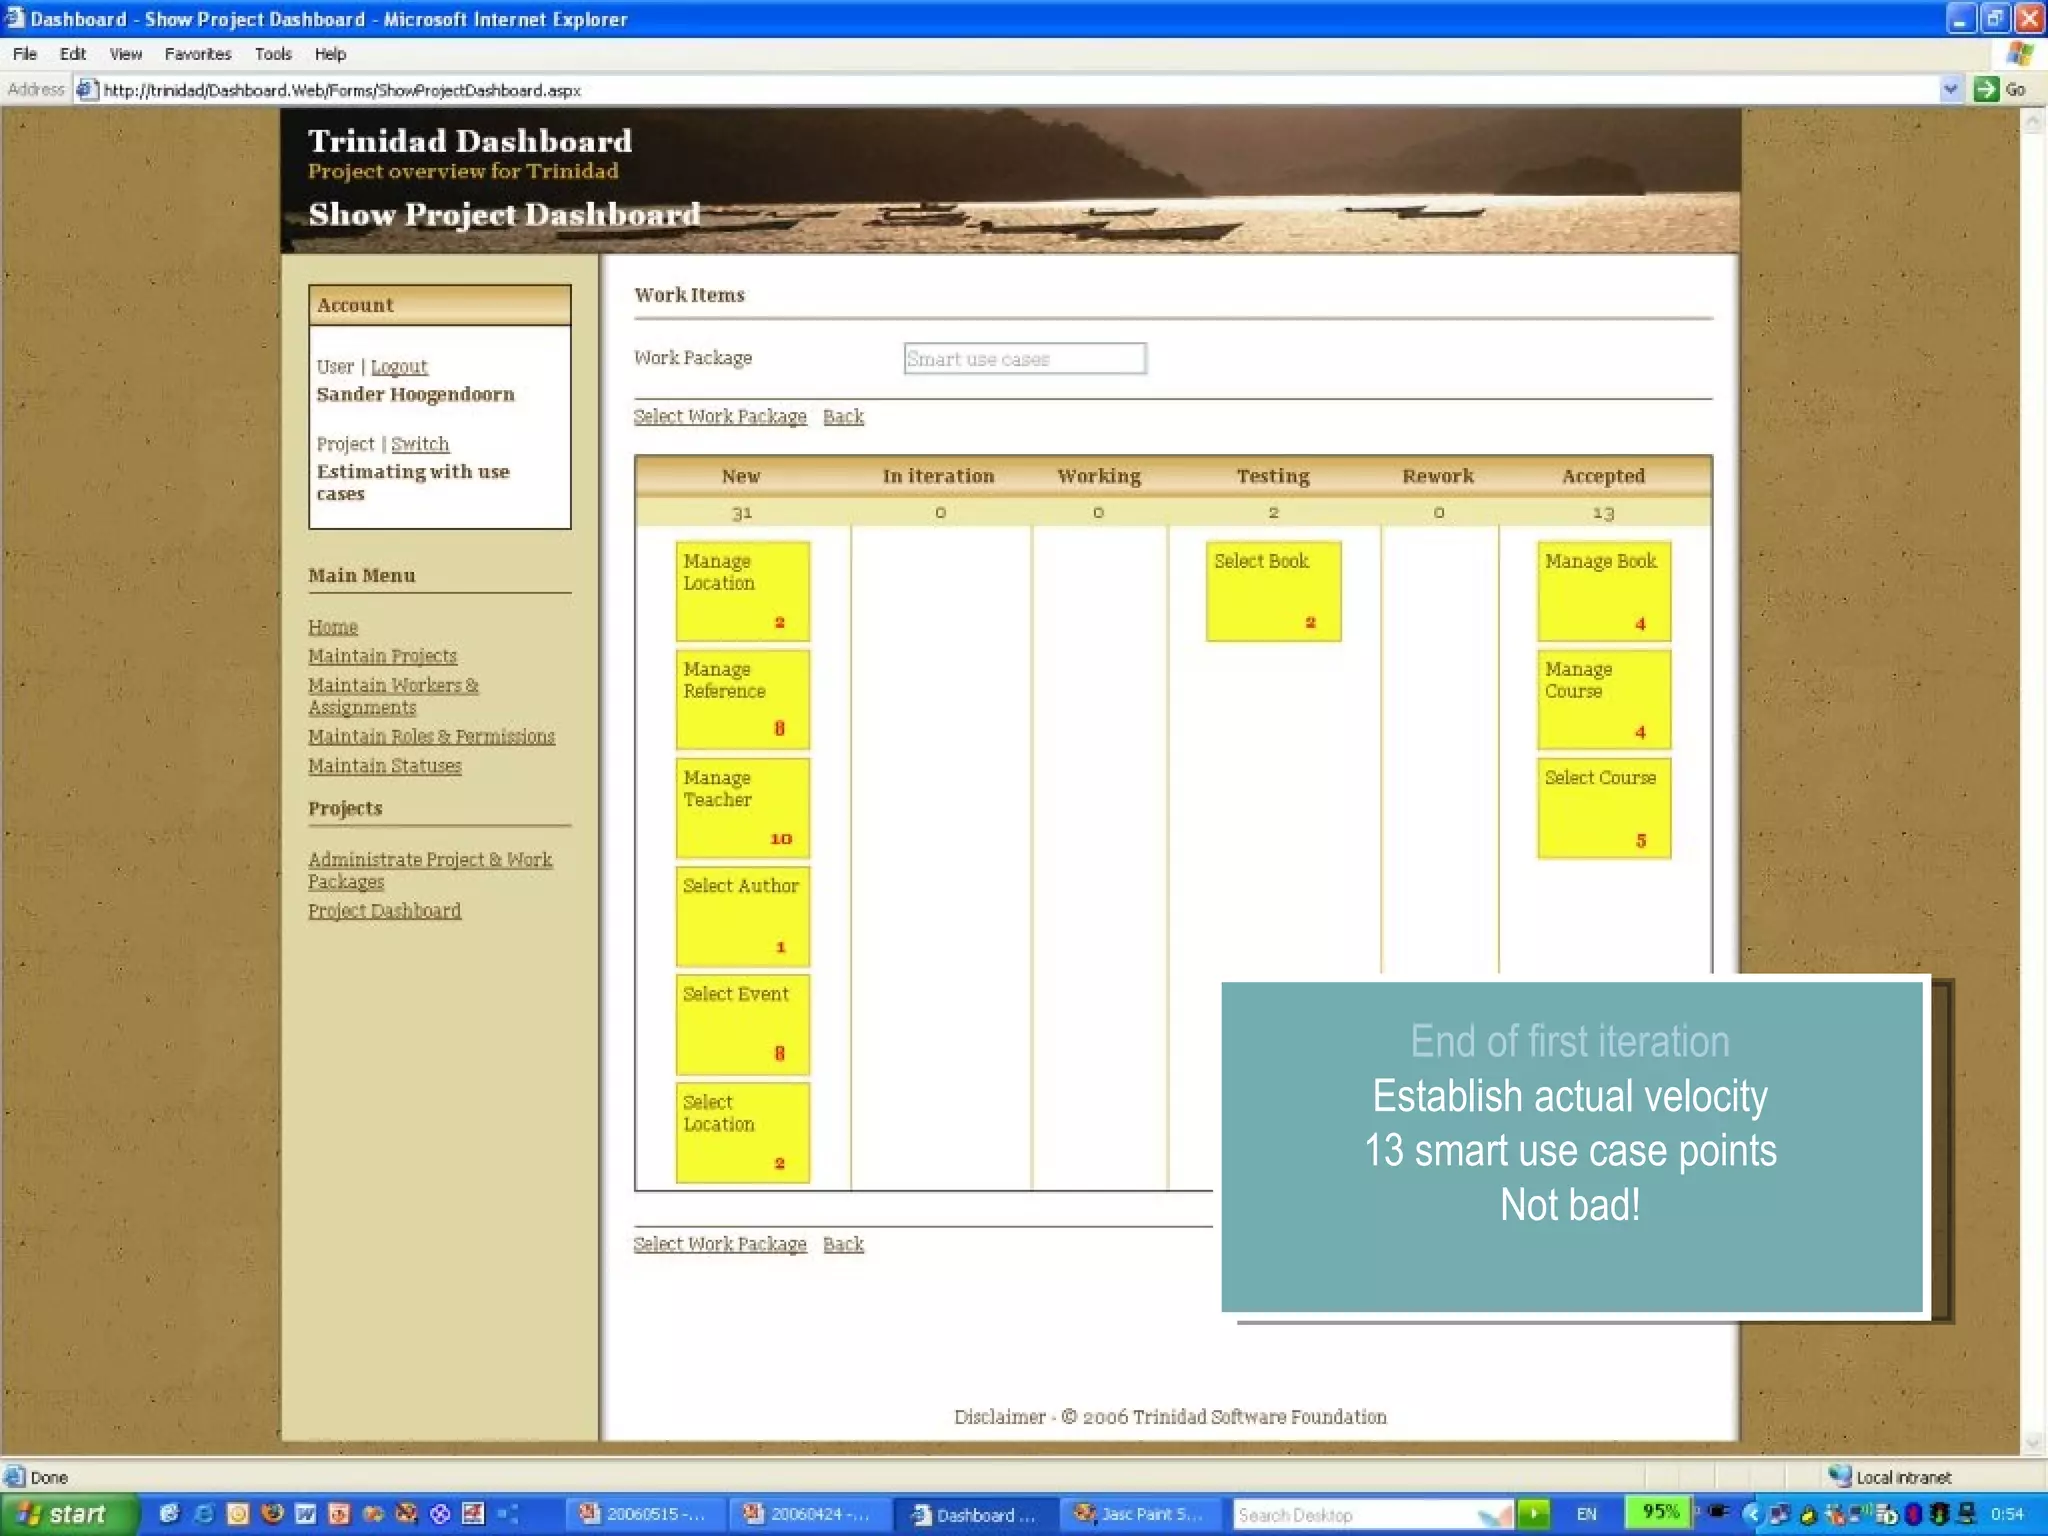
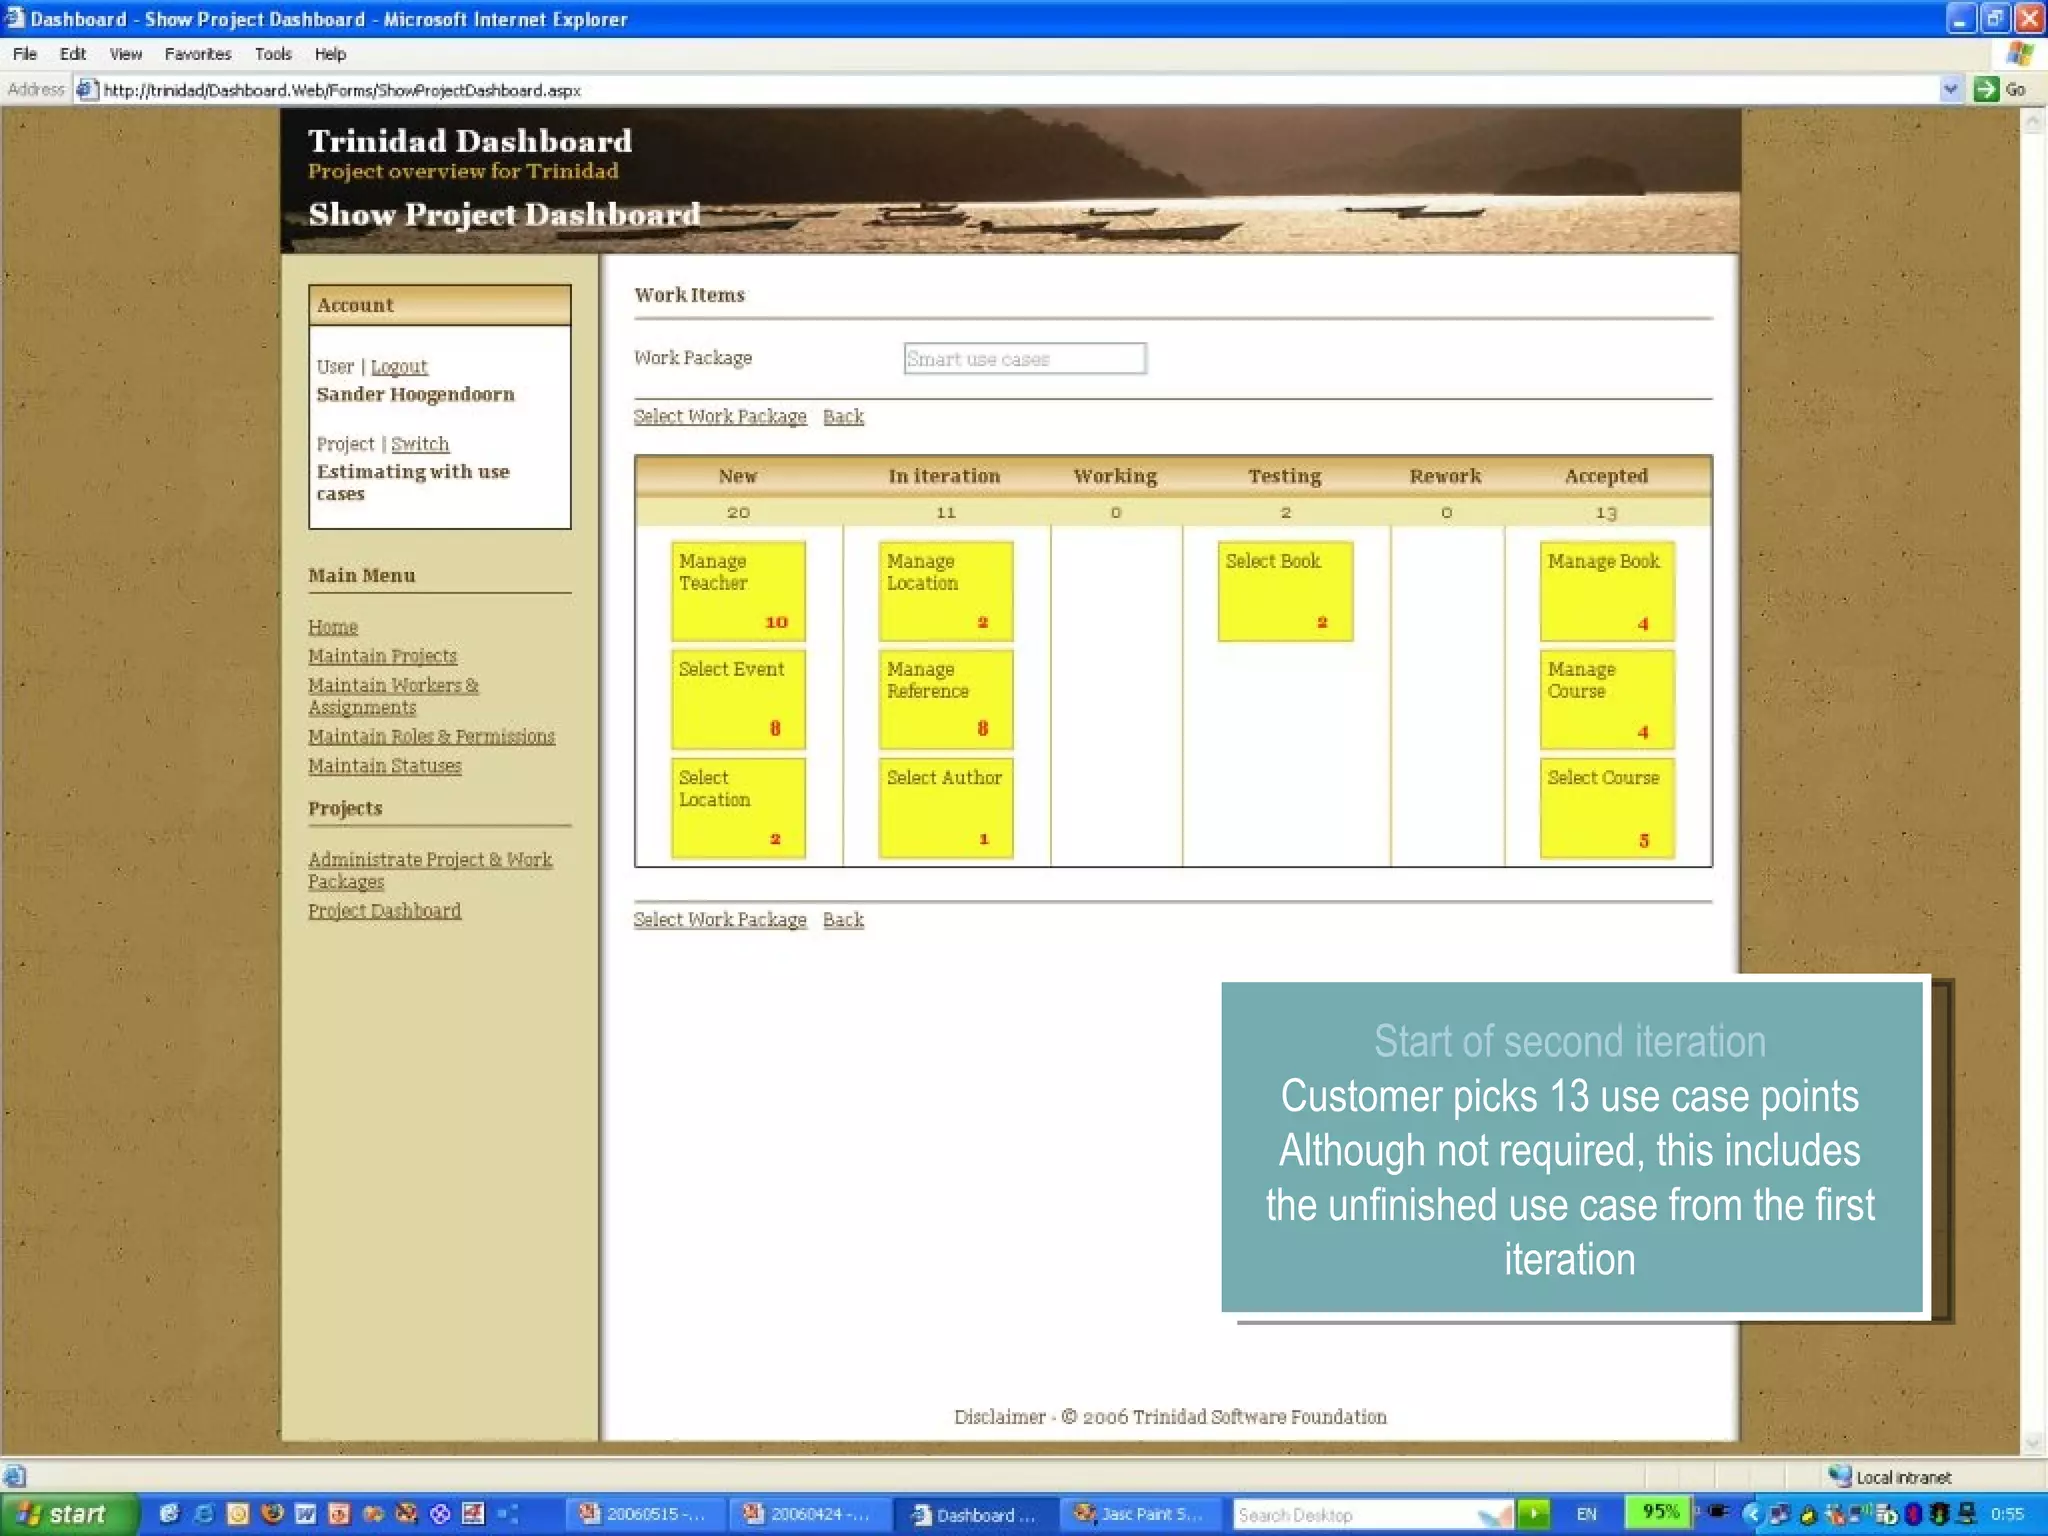
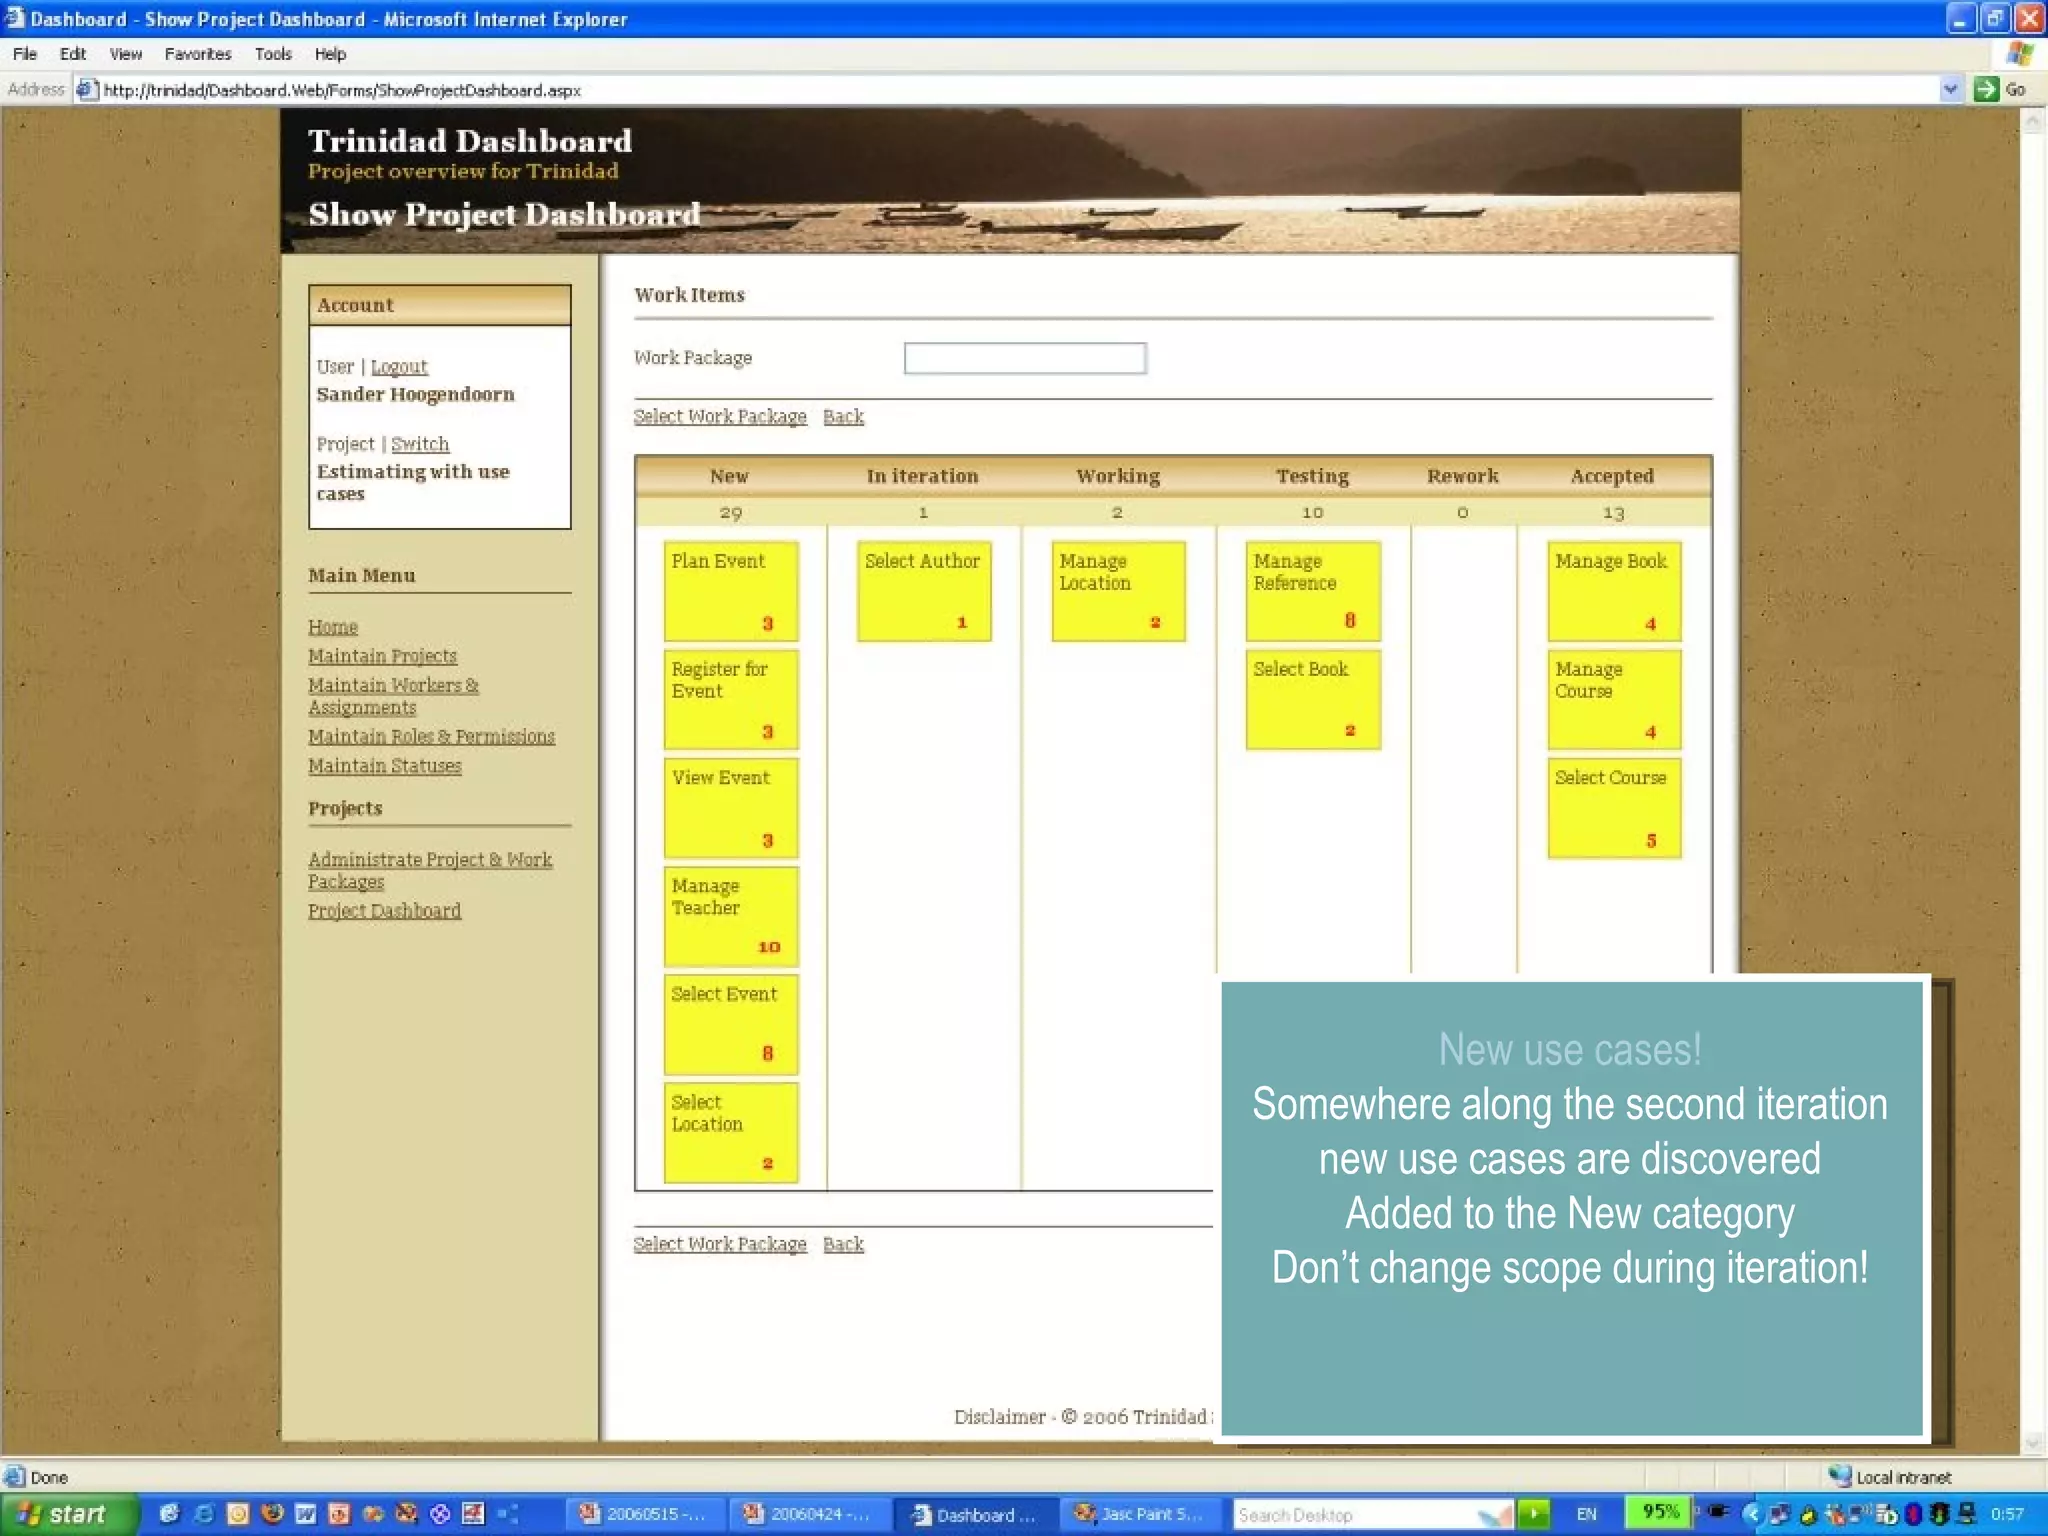


The document discusses using smart use cases for agile software estimation and planning. It introduces smart use cases and how they can be used to estimate complexity, determine project velocity, define stereotypes, and plan iterations. Tools like burn down charts and dashboards are also presented for monitoring agile project progress and metrics.


![Coded Agents – with UiPath SDK + LangGraph [Virtual Hands-on Workshop]](https://cdn.slidesharecdn.com/ss_thumbnails/codedagentsdeck-251215155422-5497c599-thumbnail.jpg?width=640&height=640&fit=bounds)