Download as PDF, PPTX

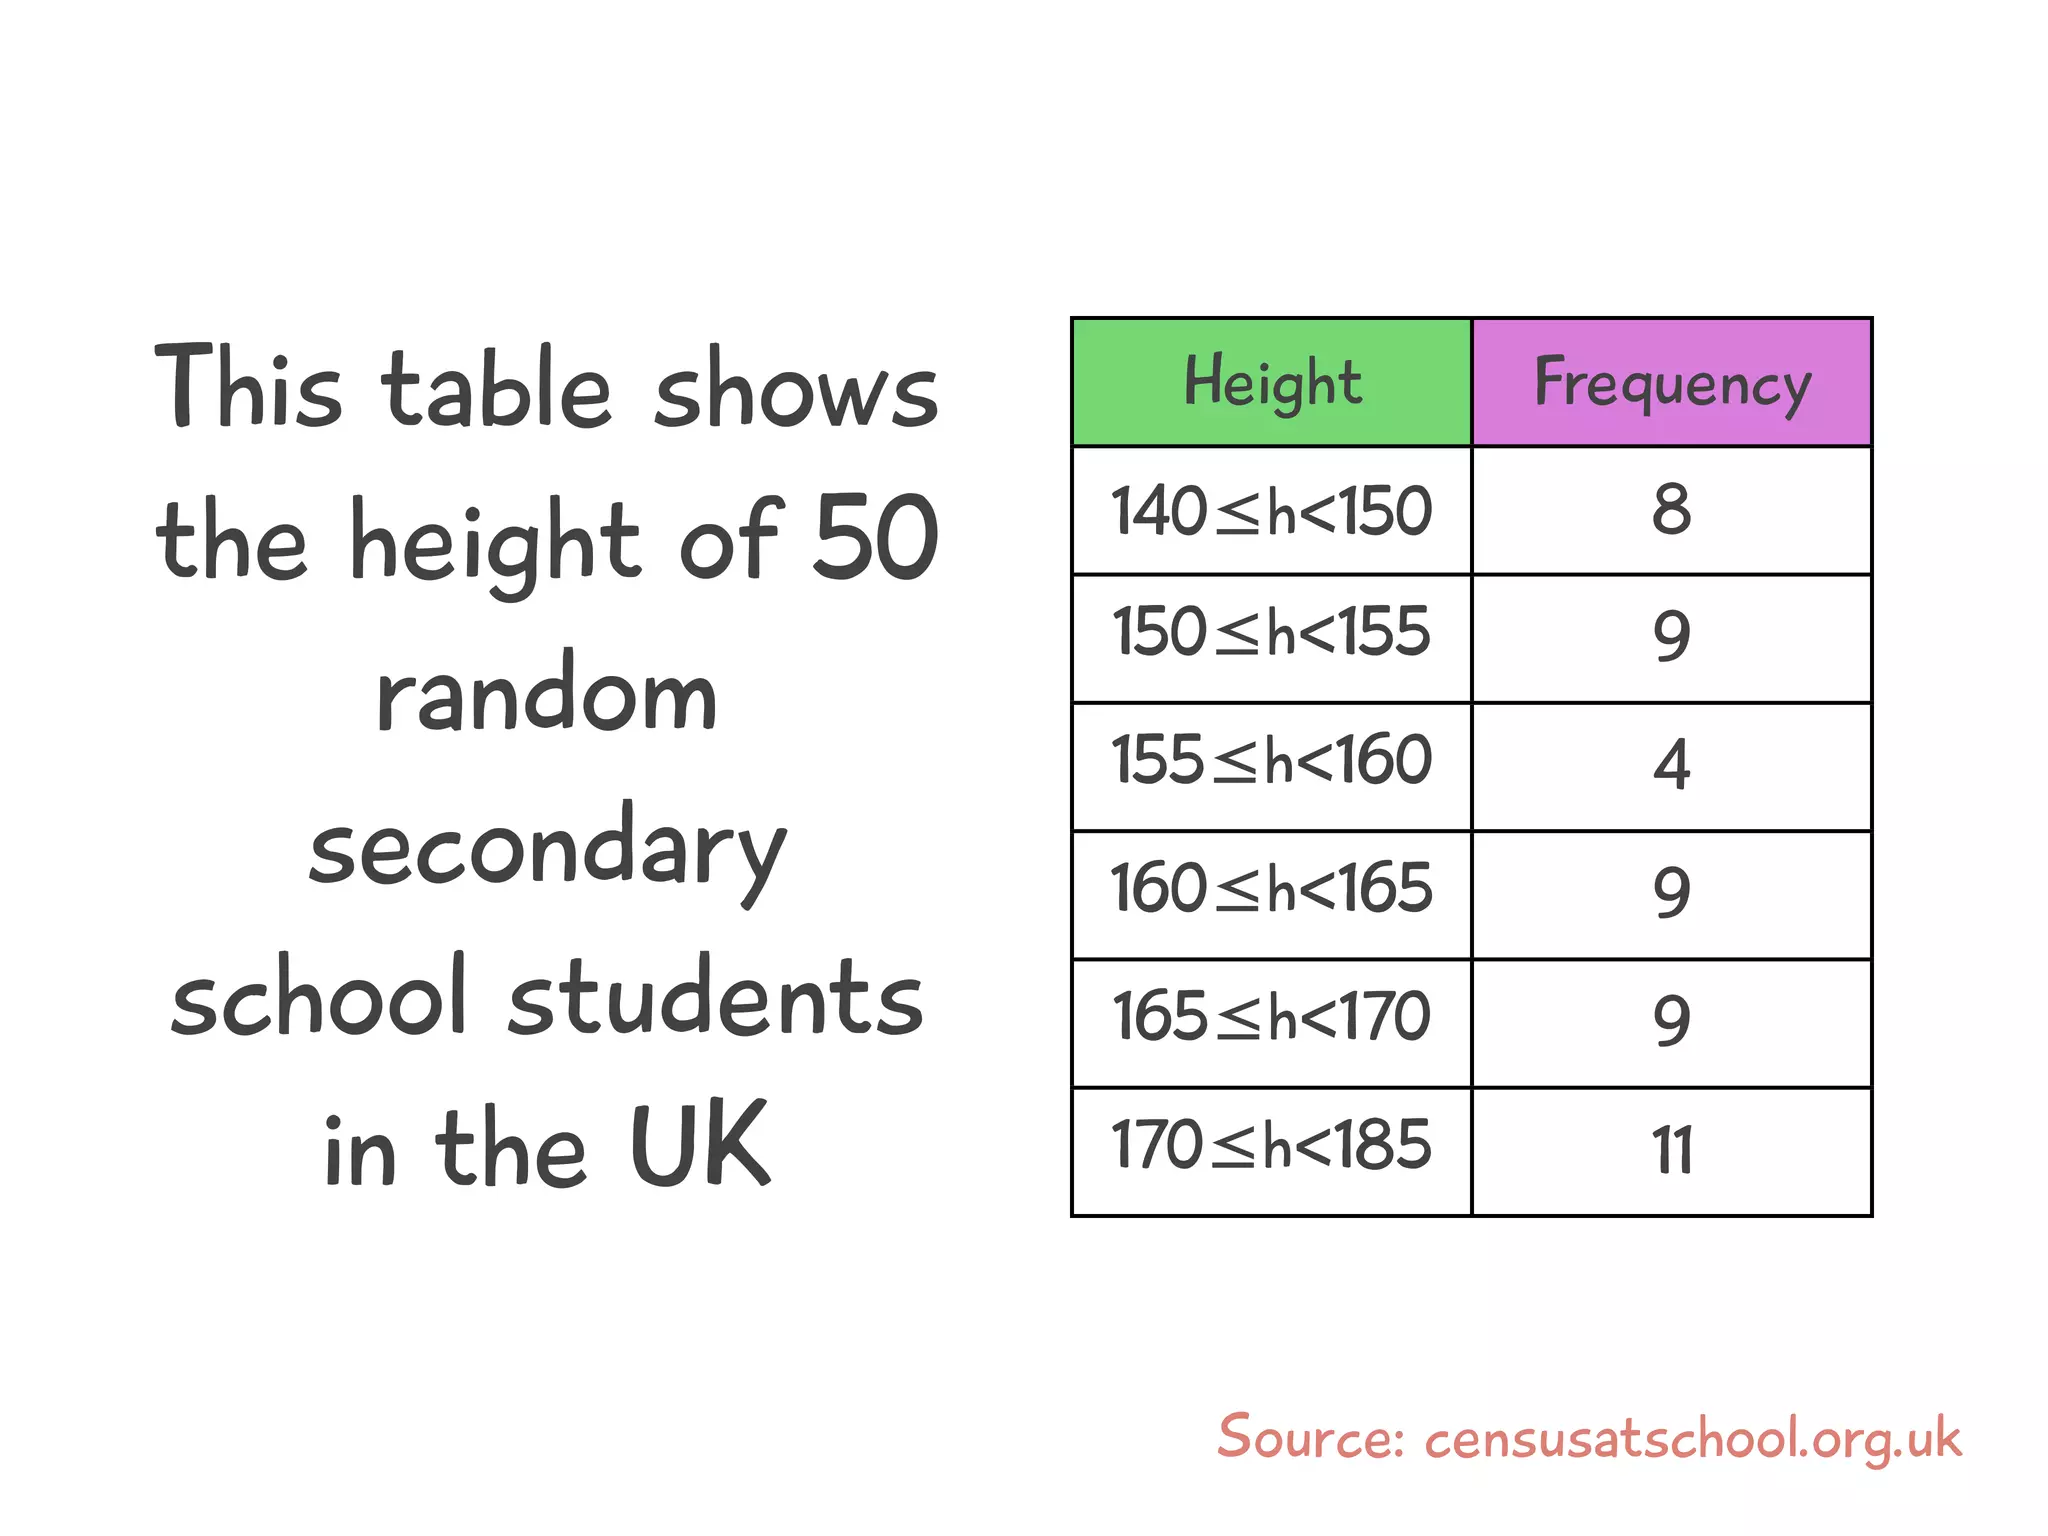
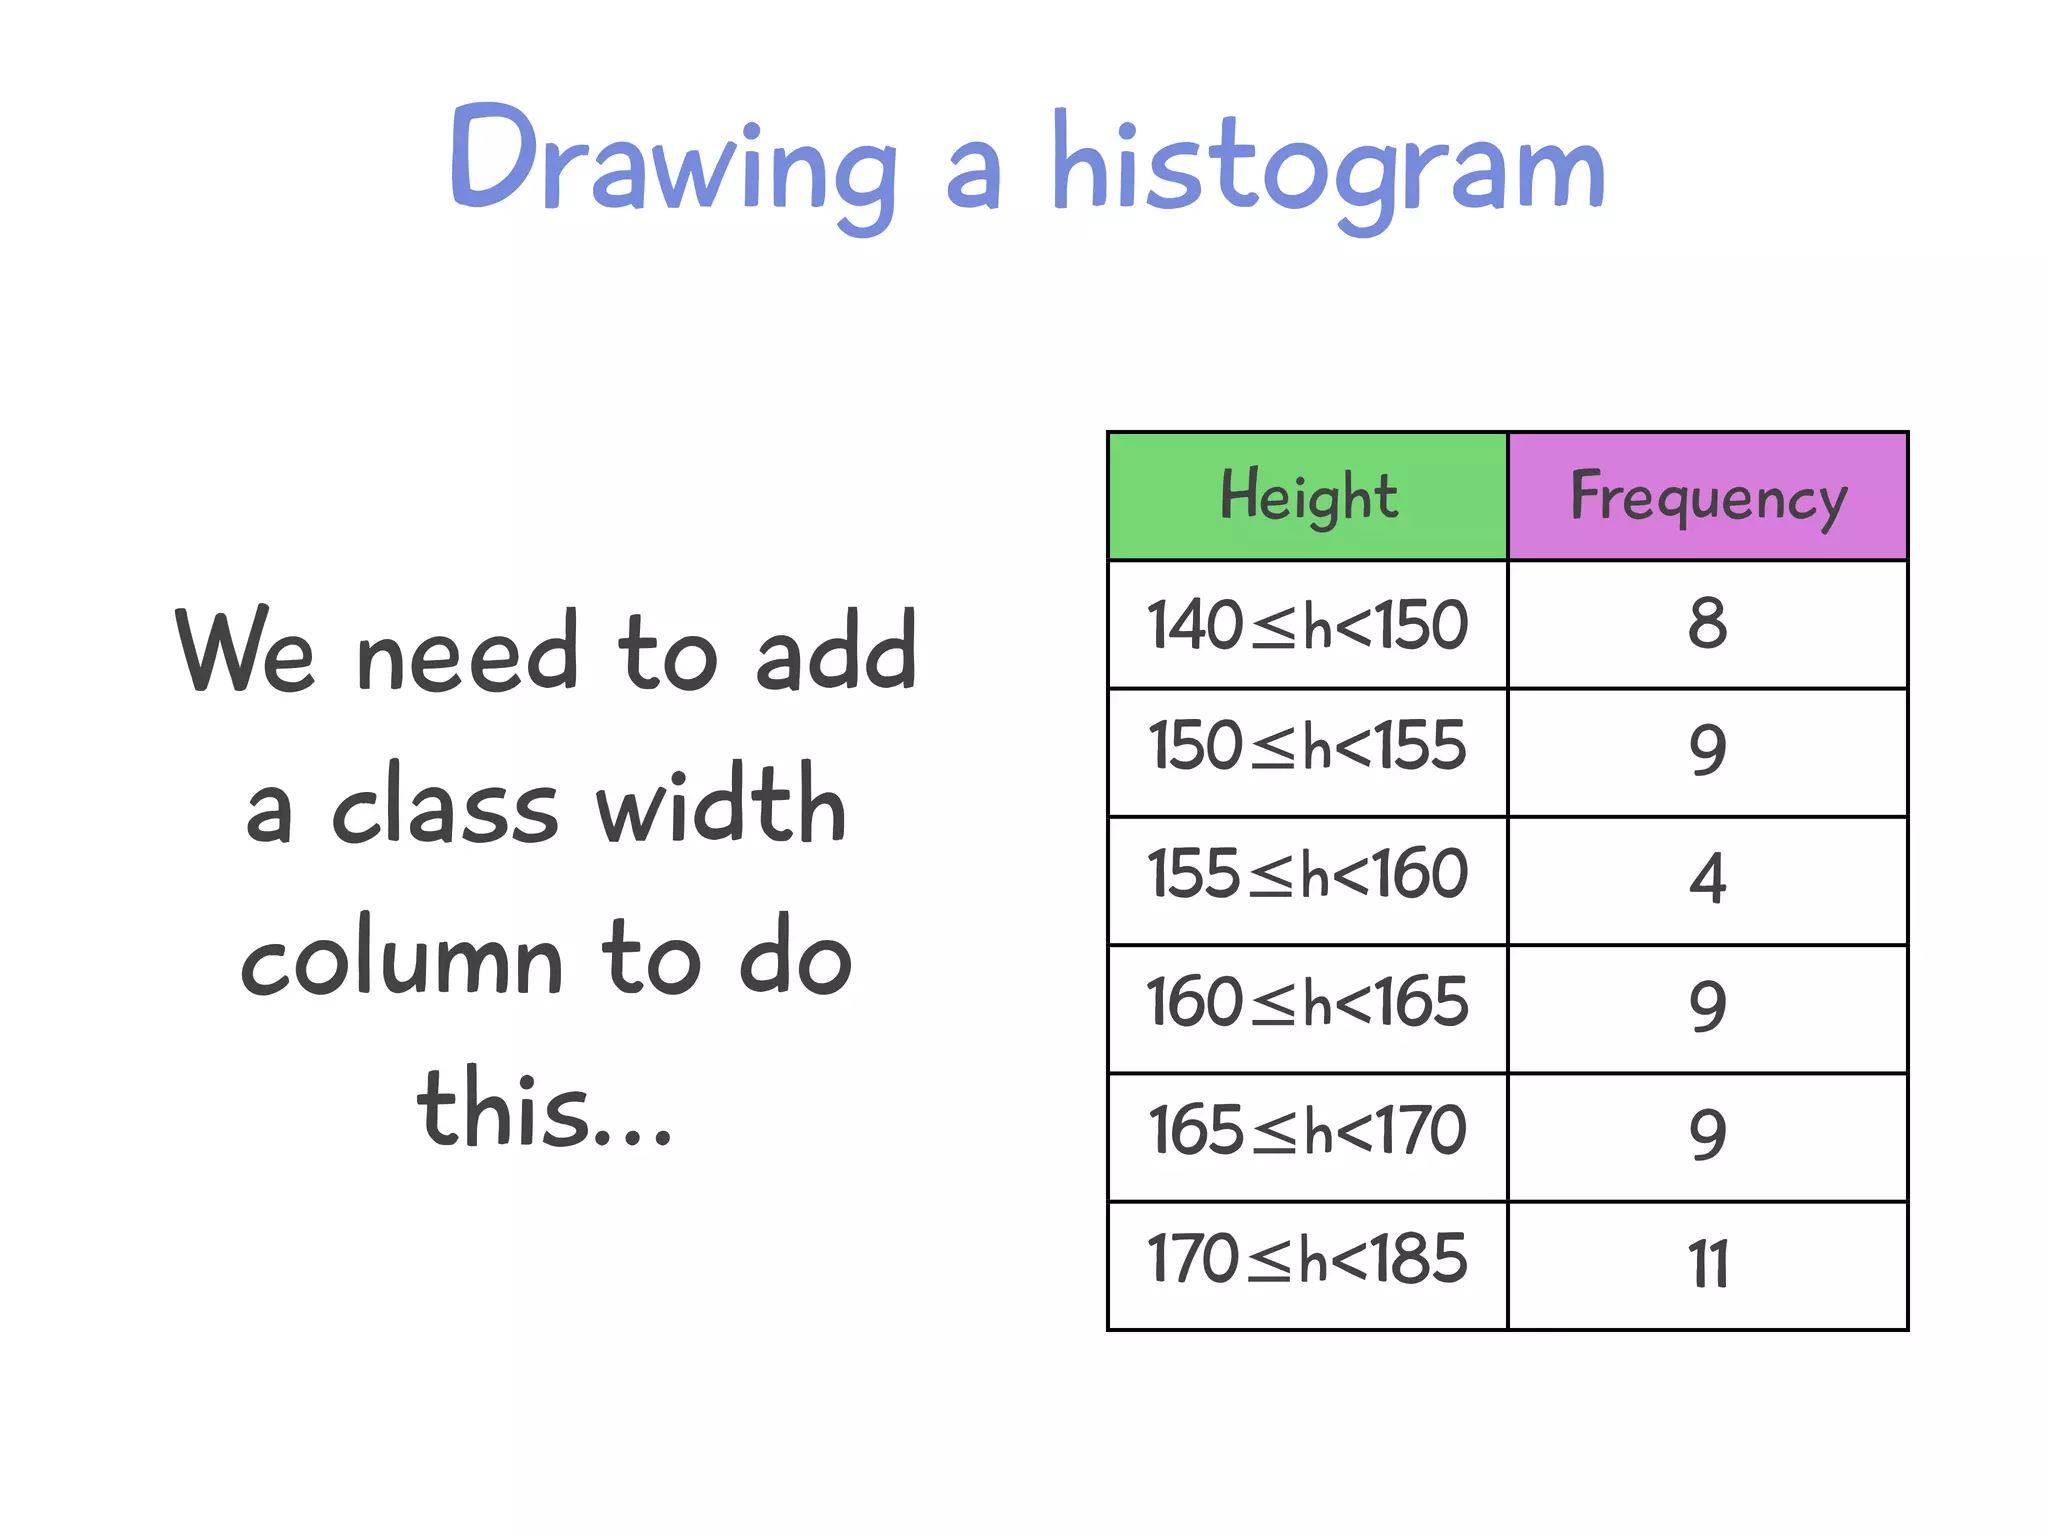
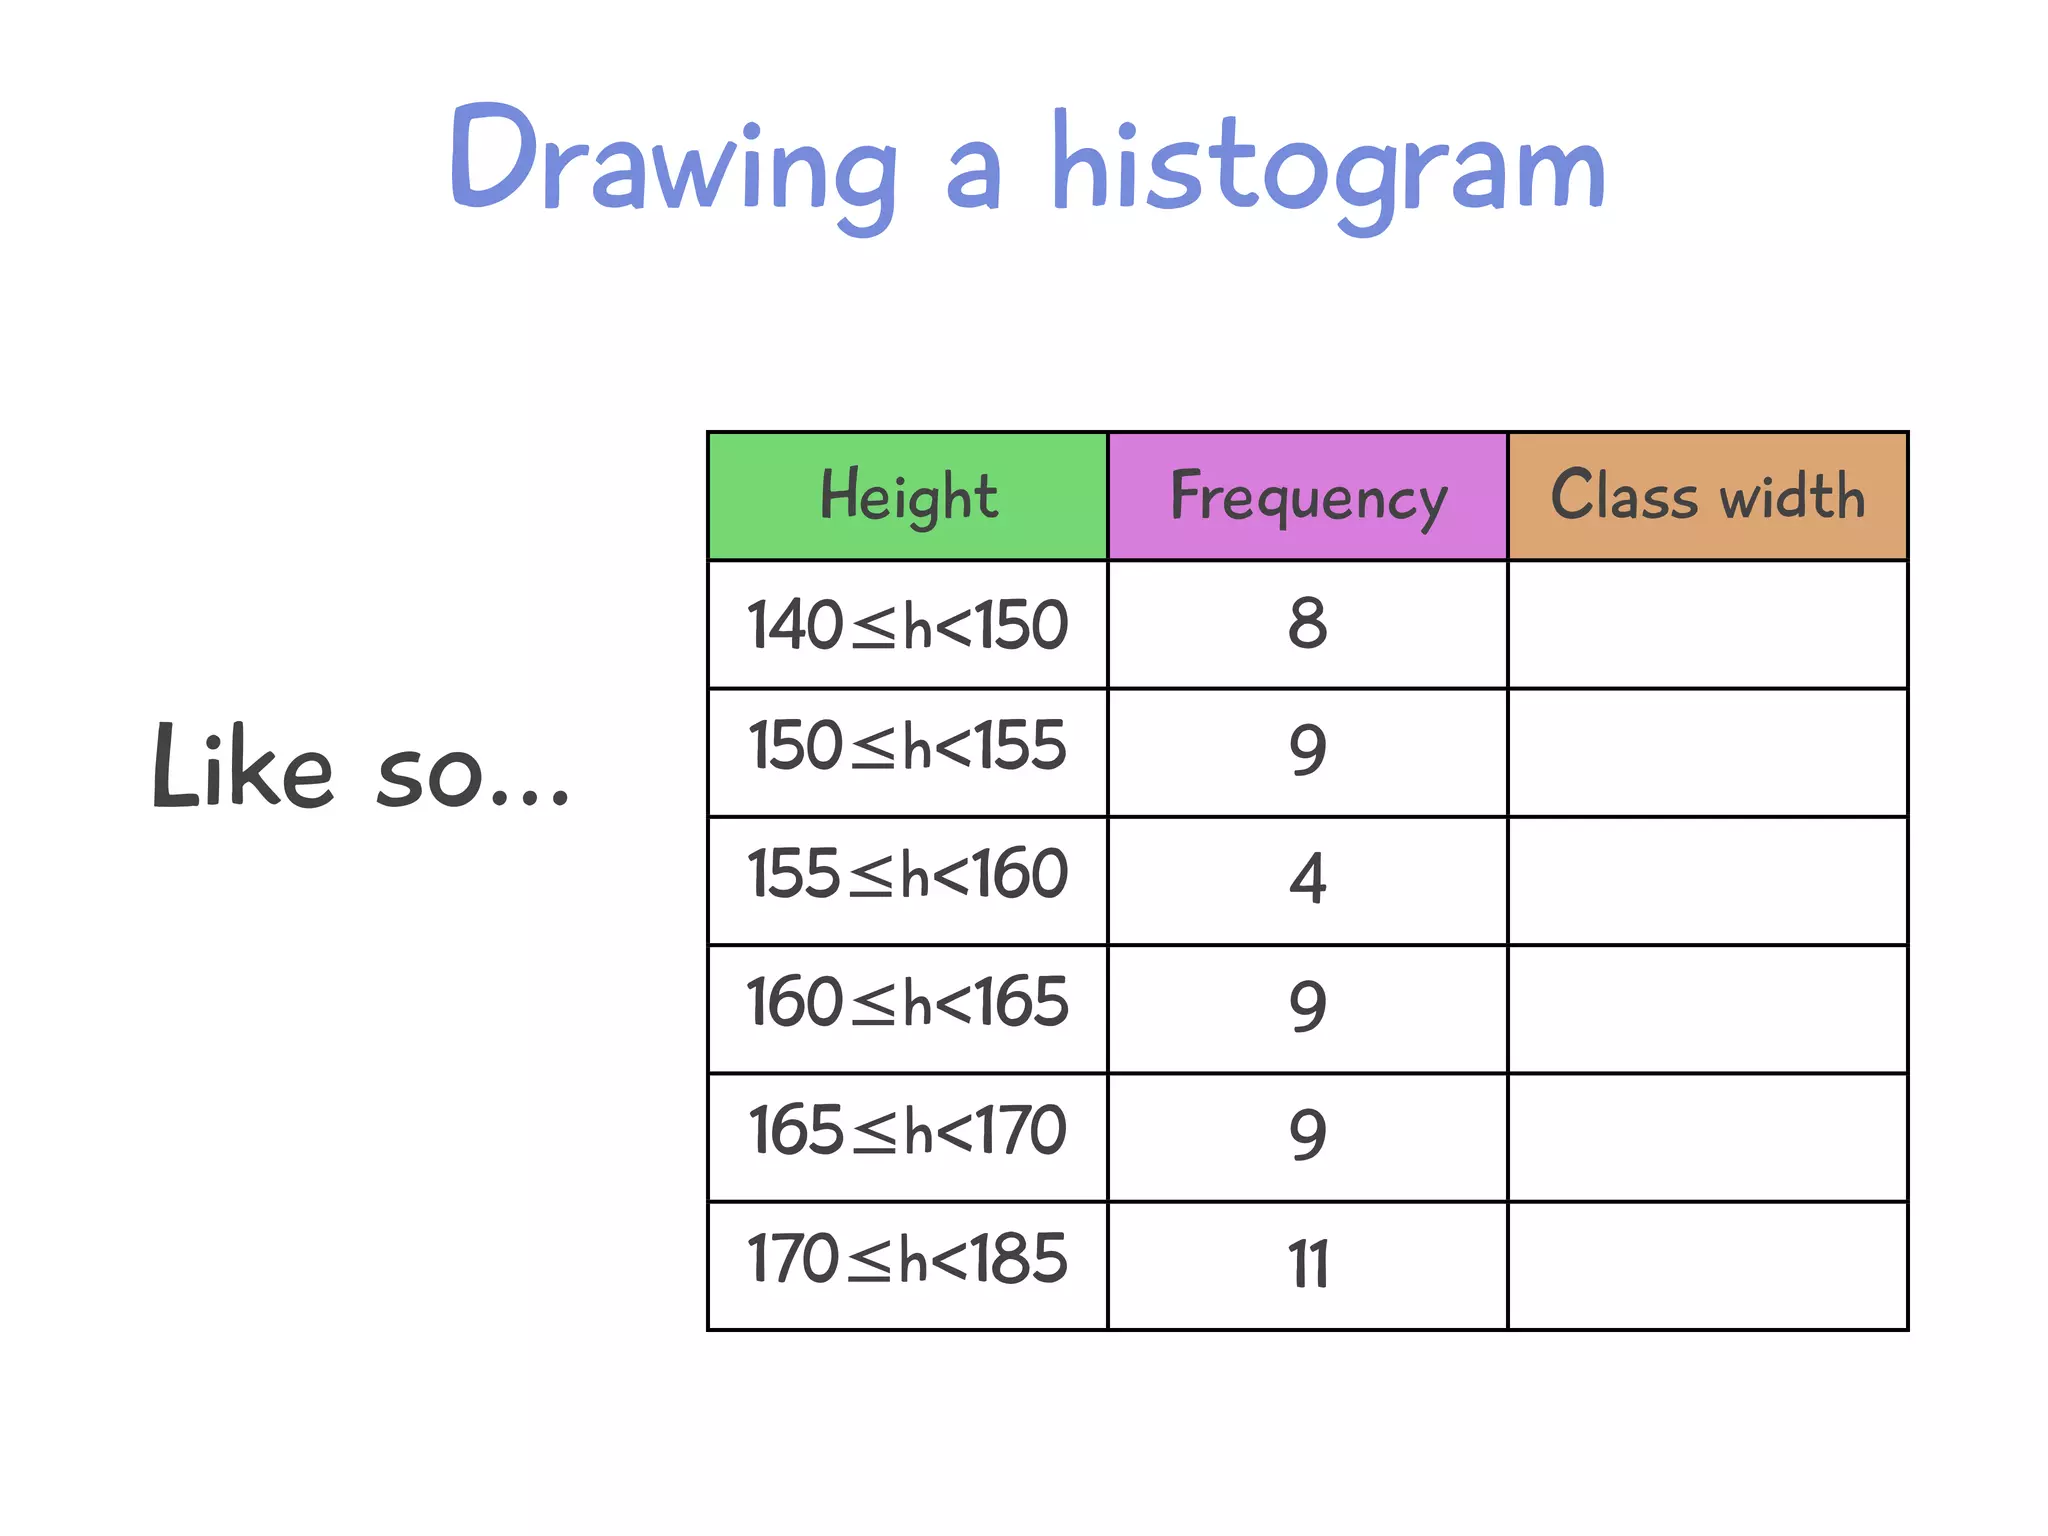
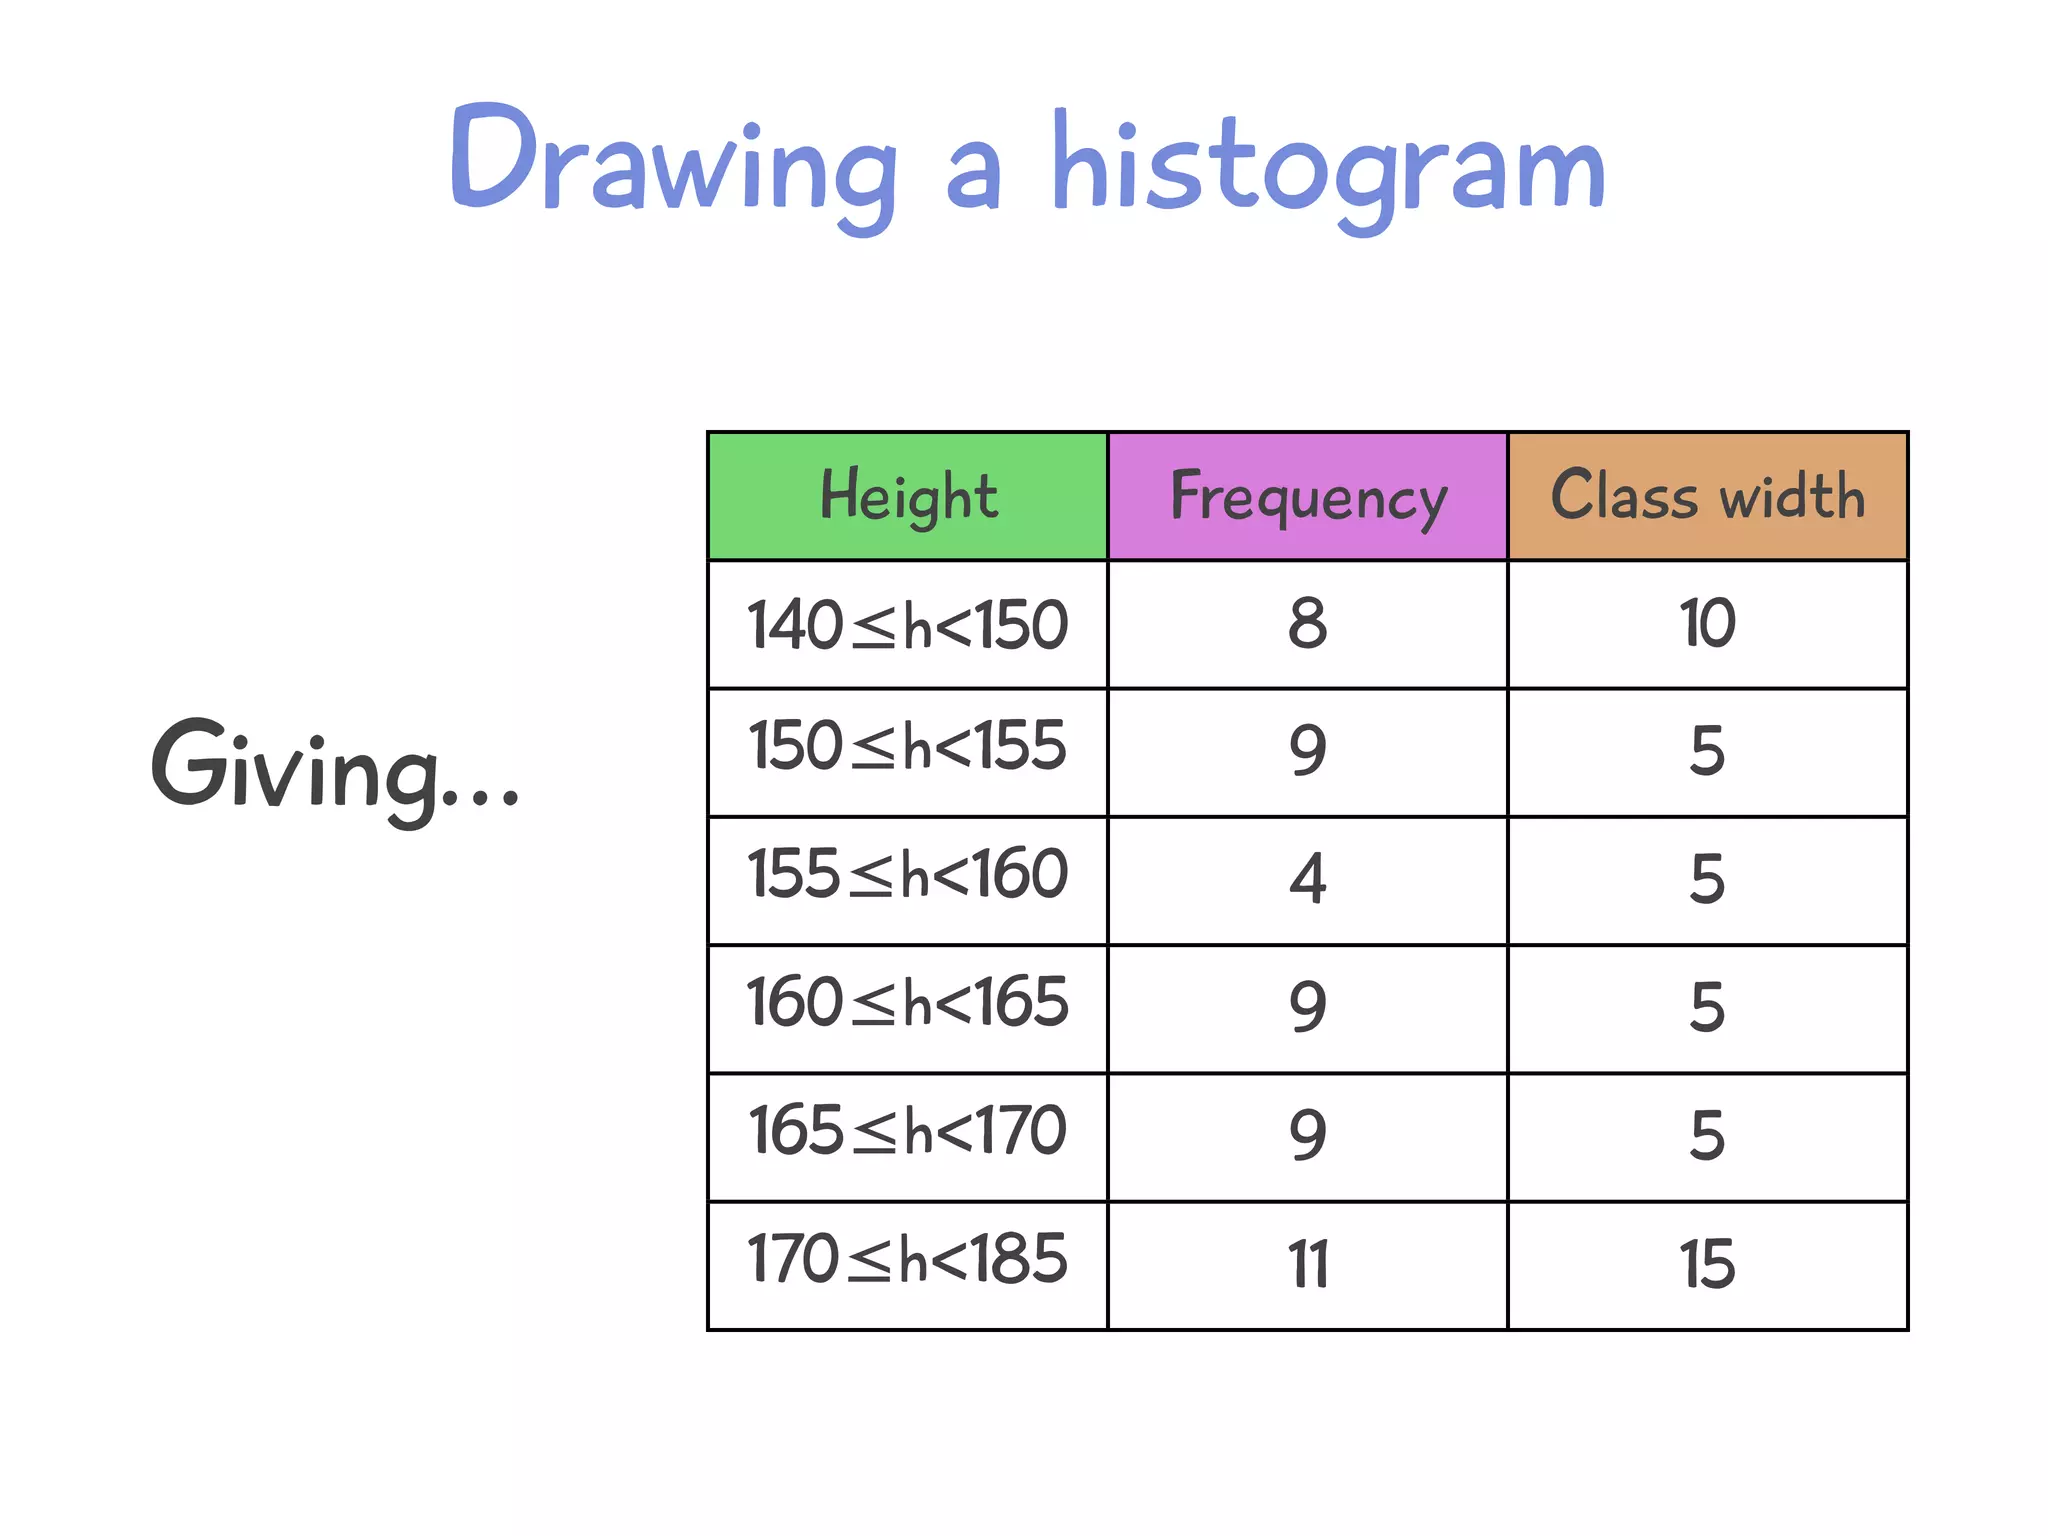
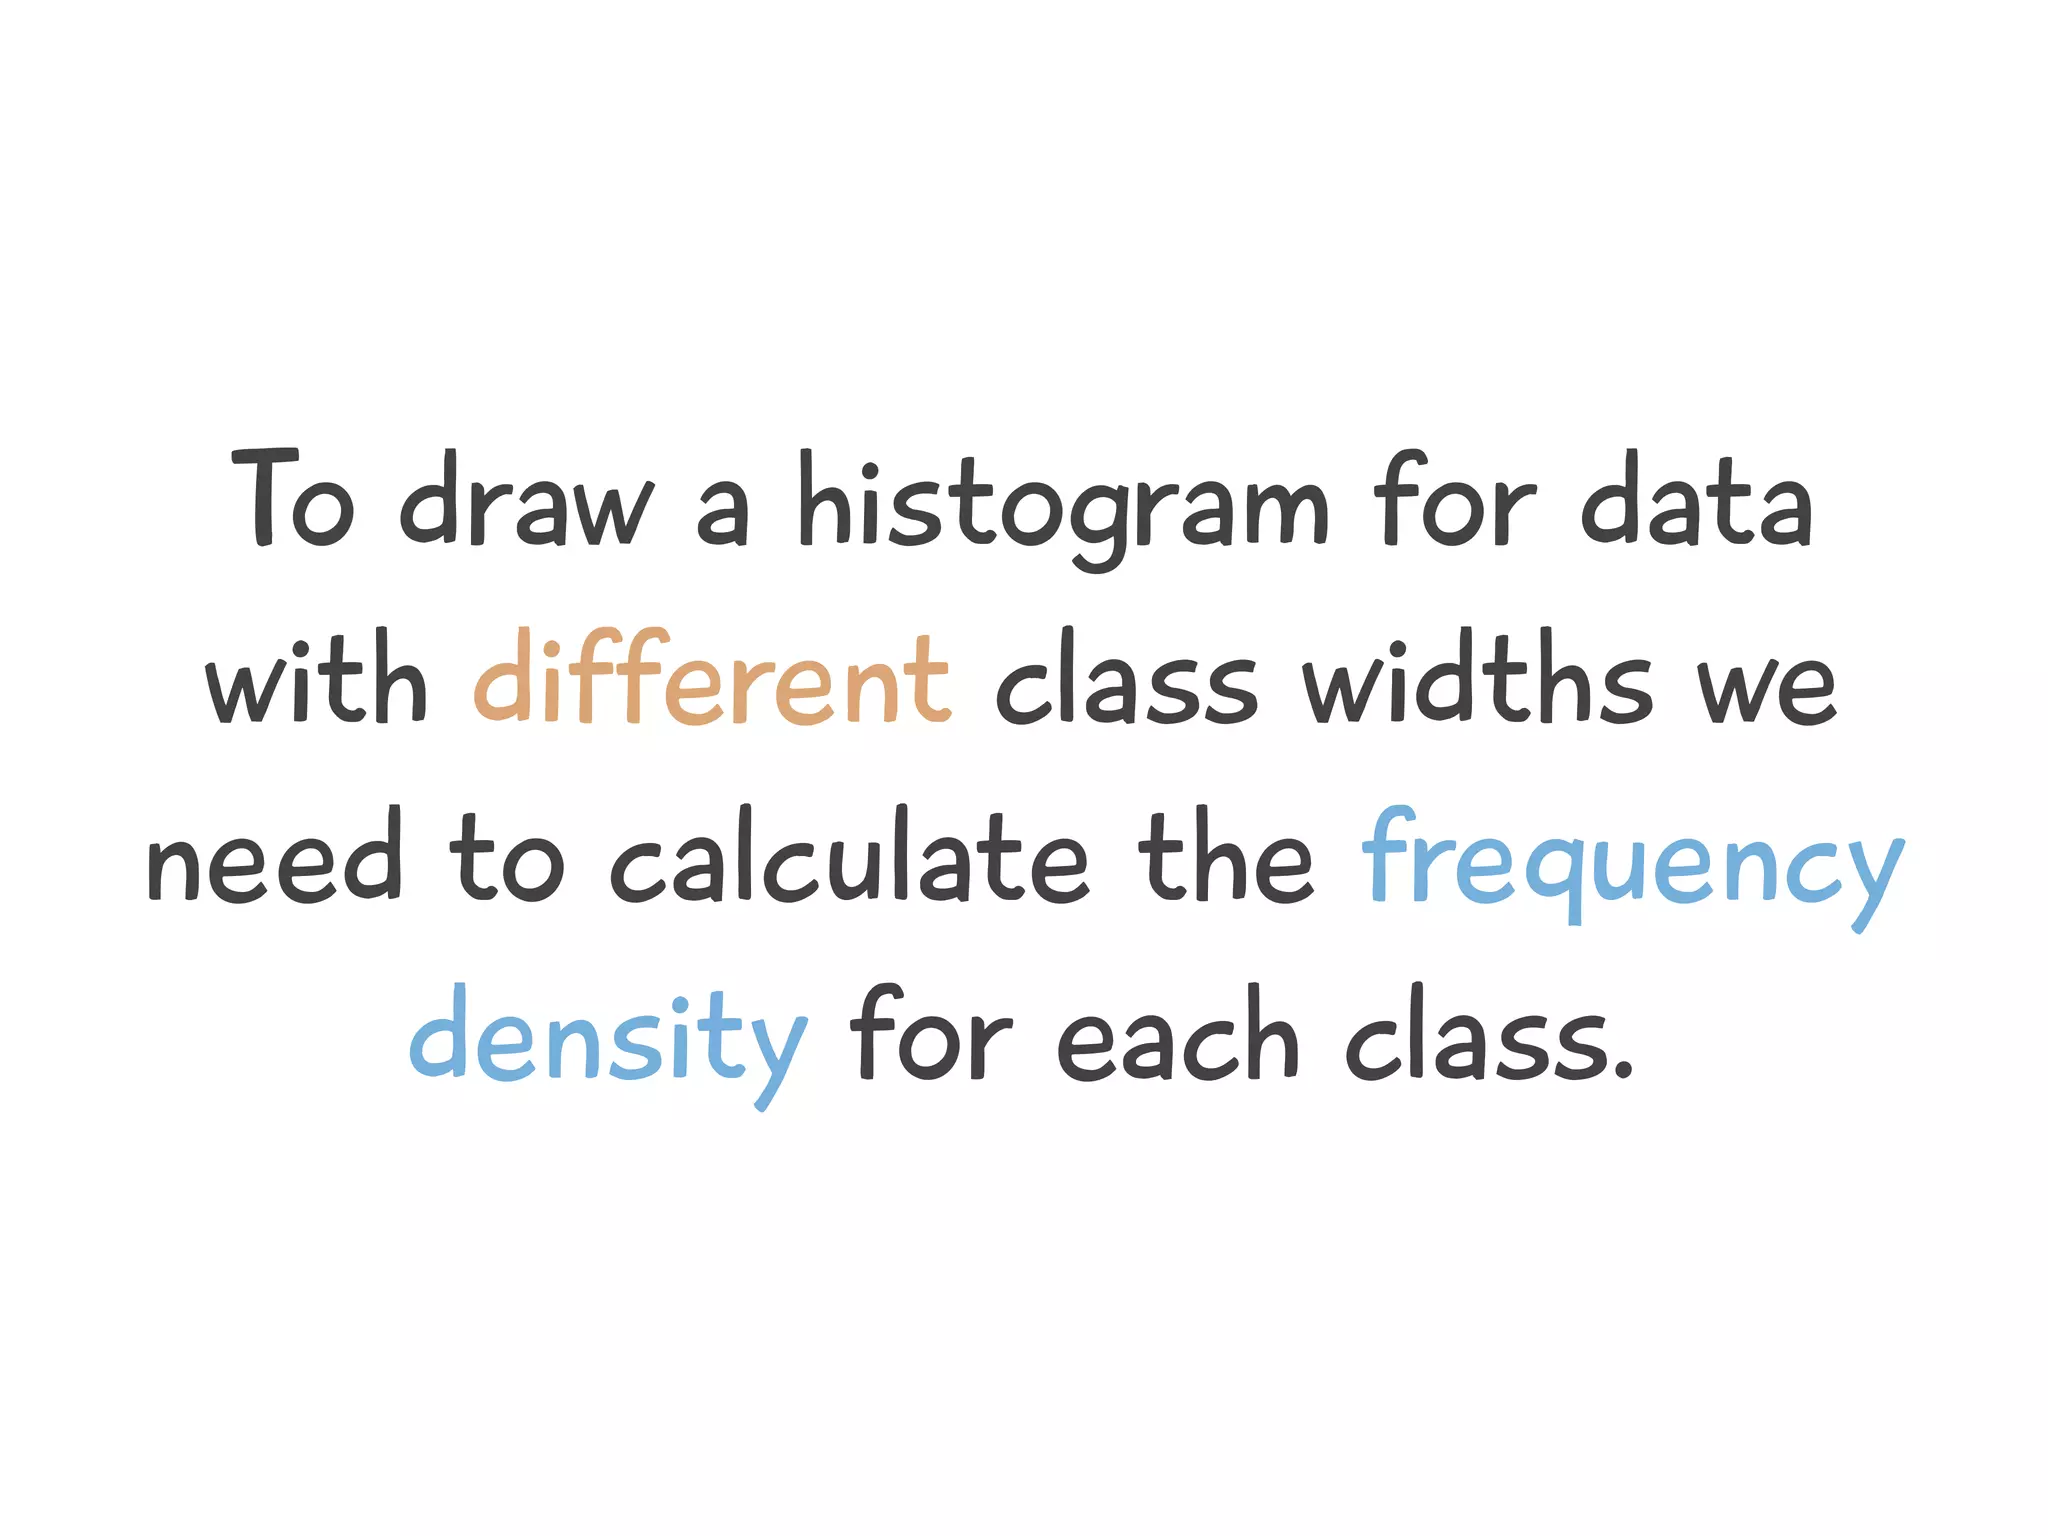
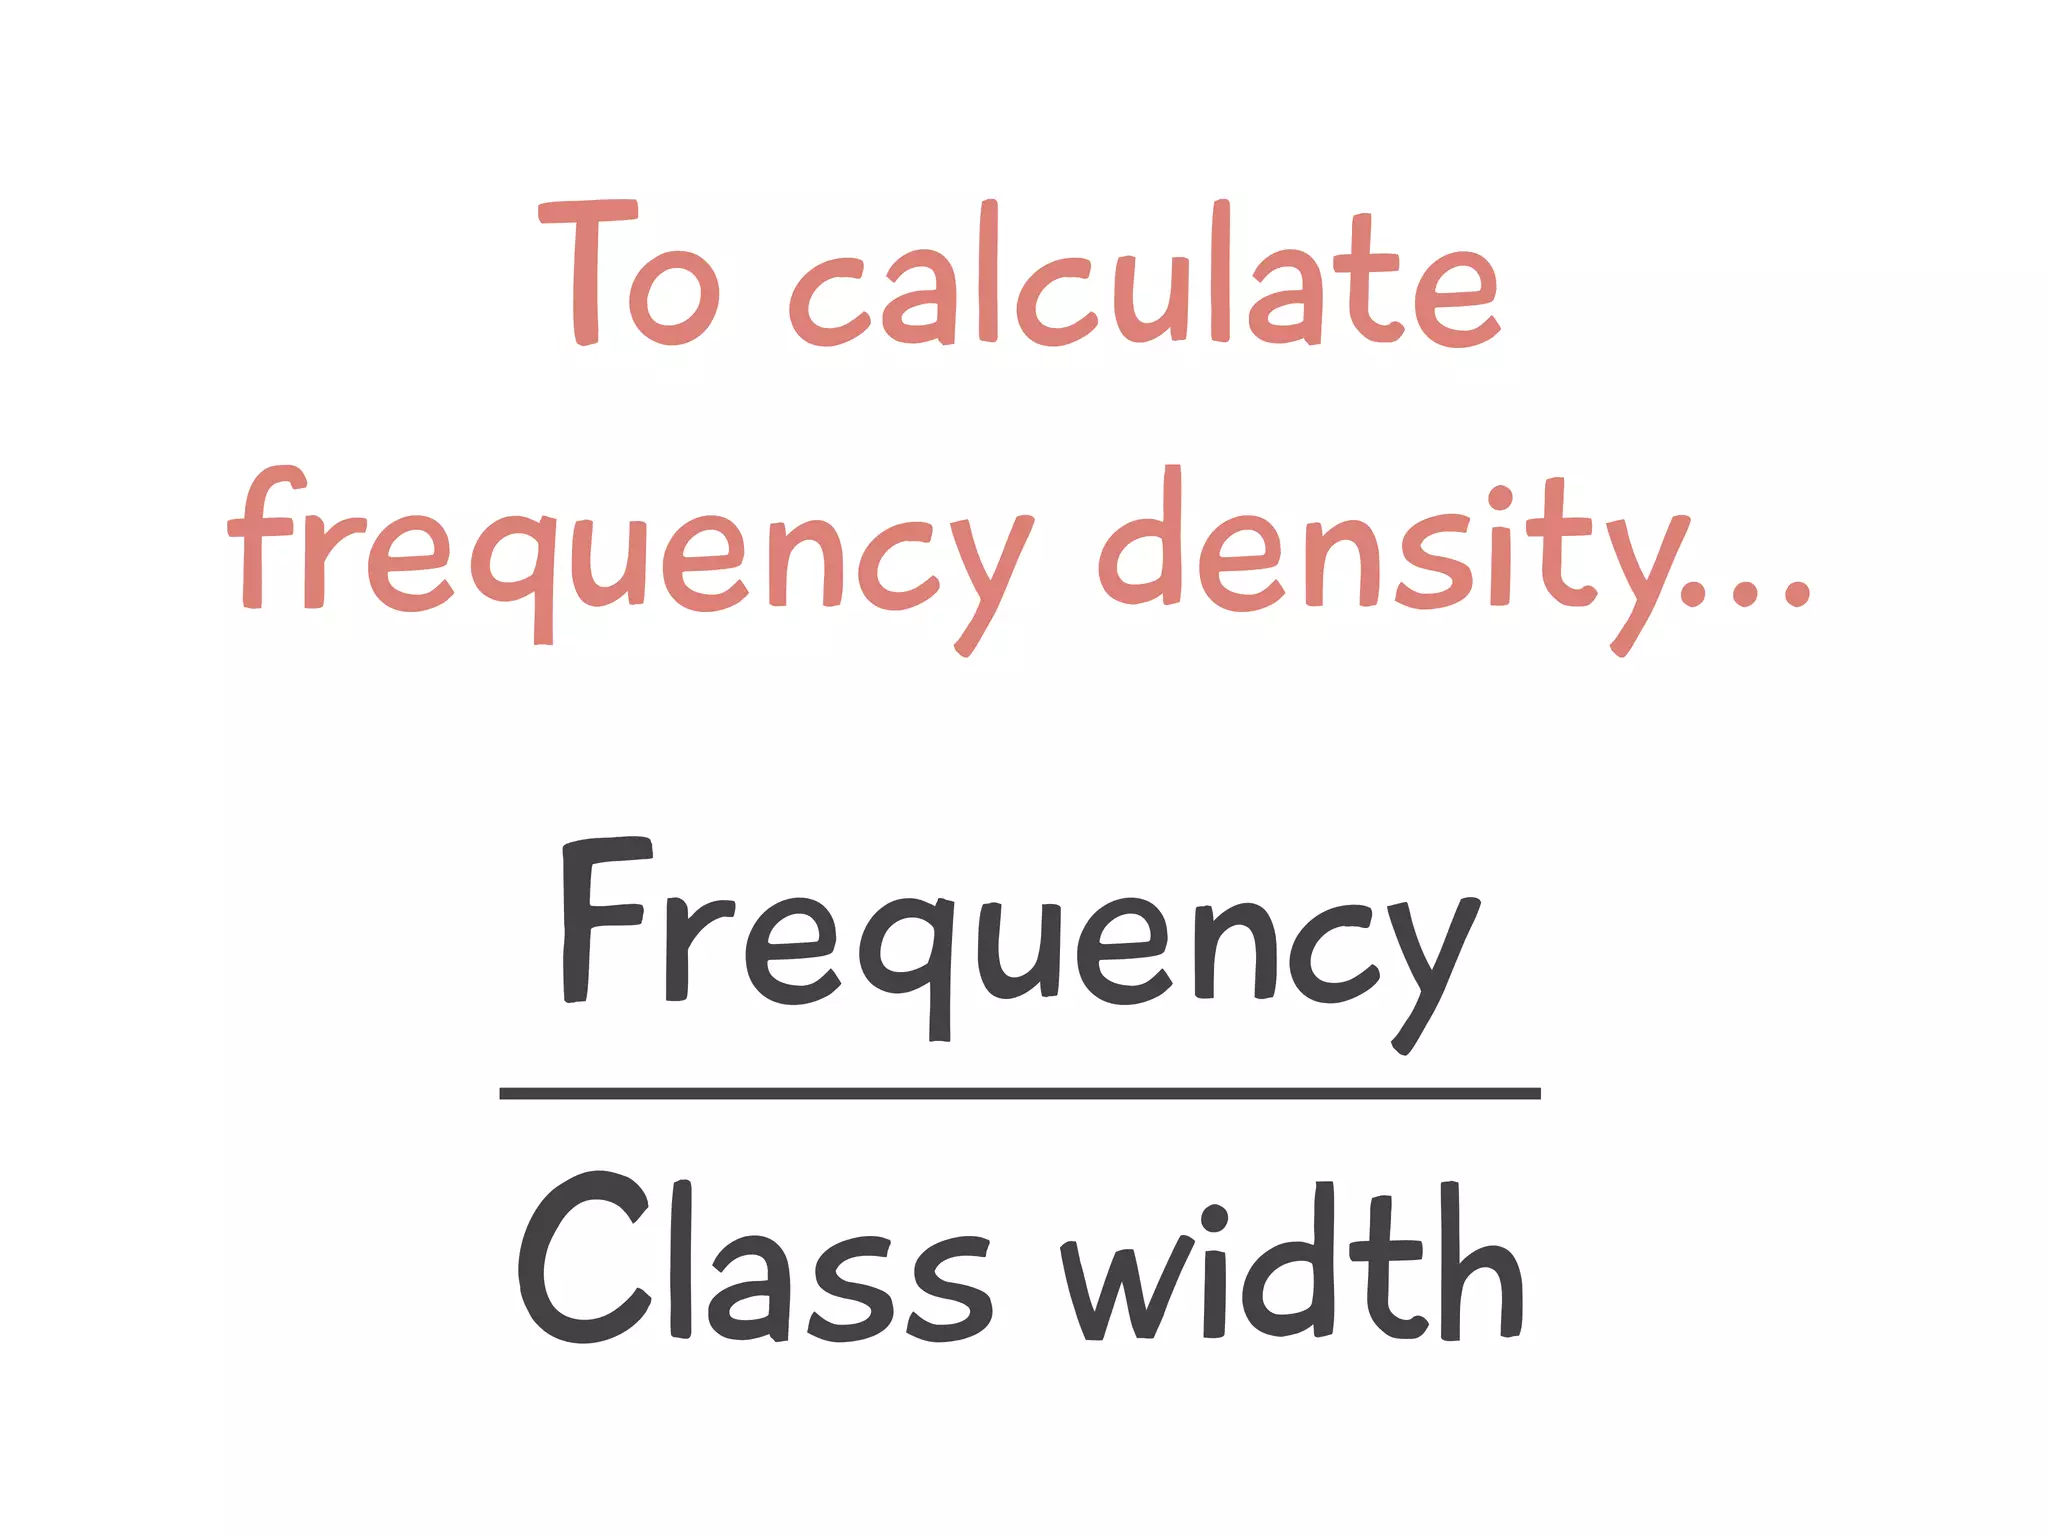
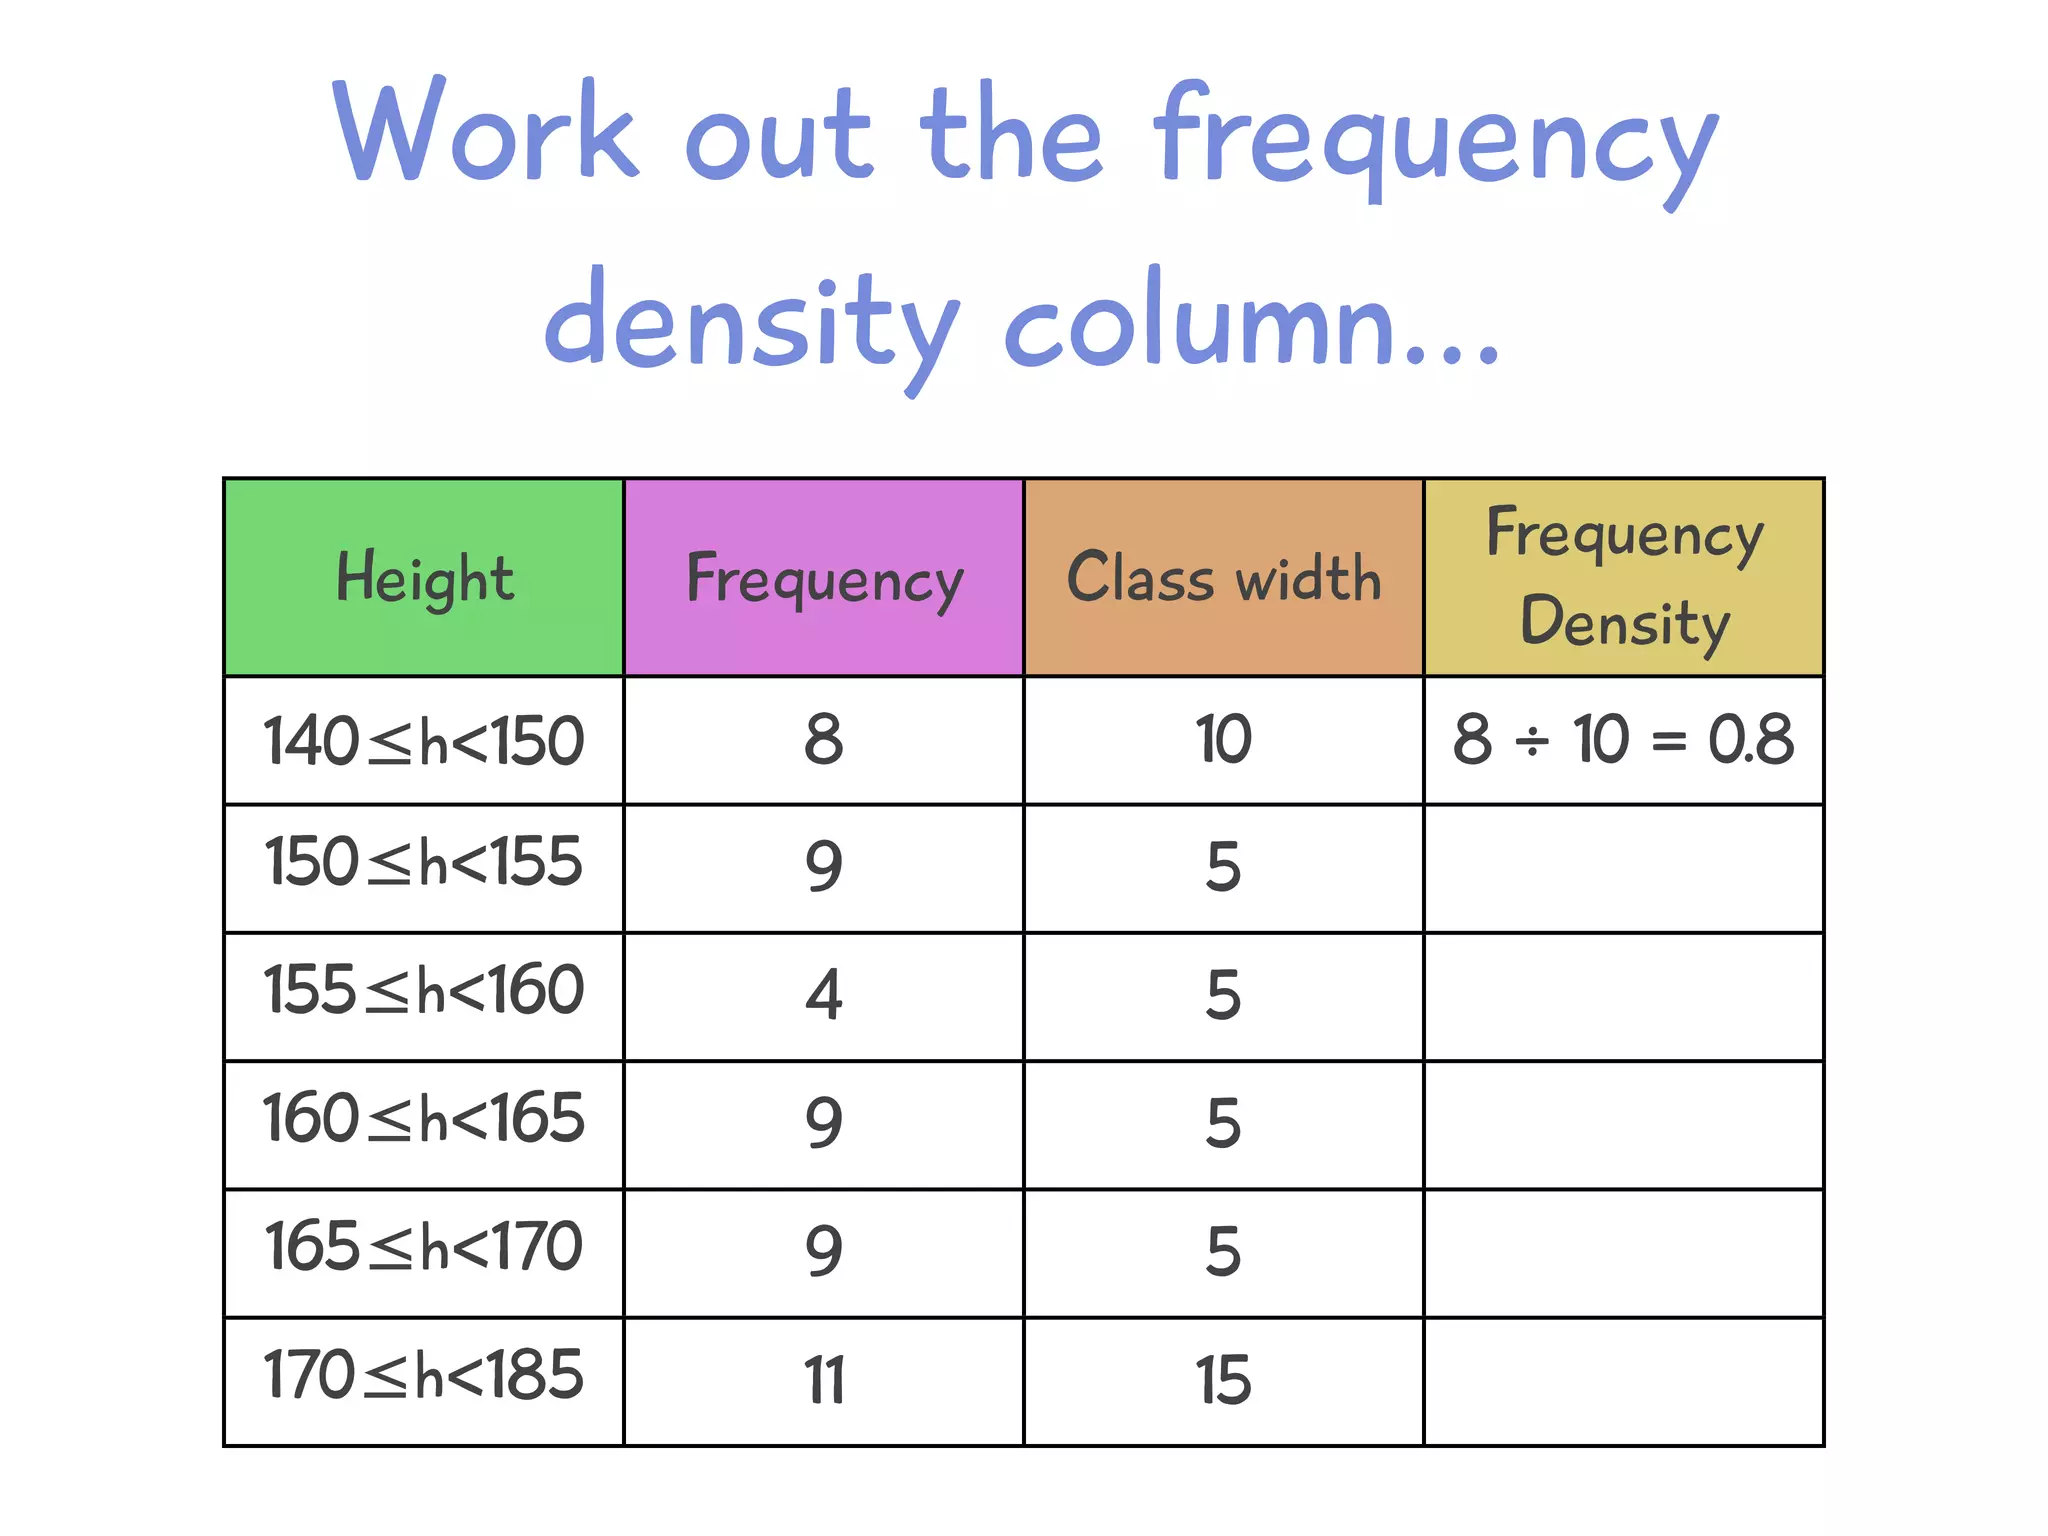
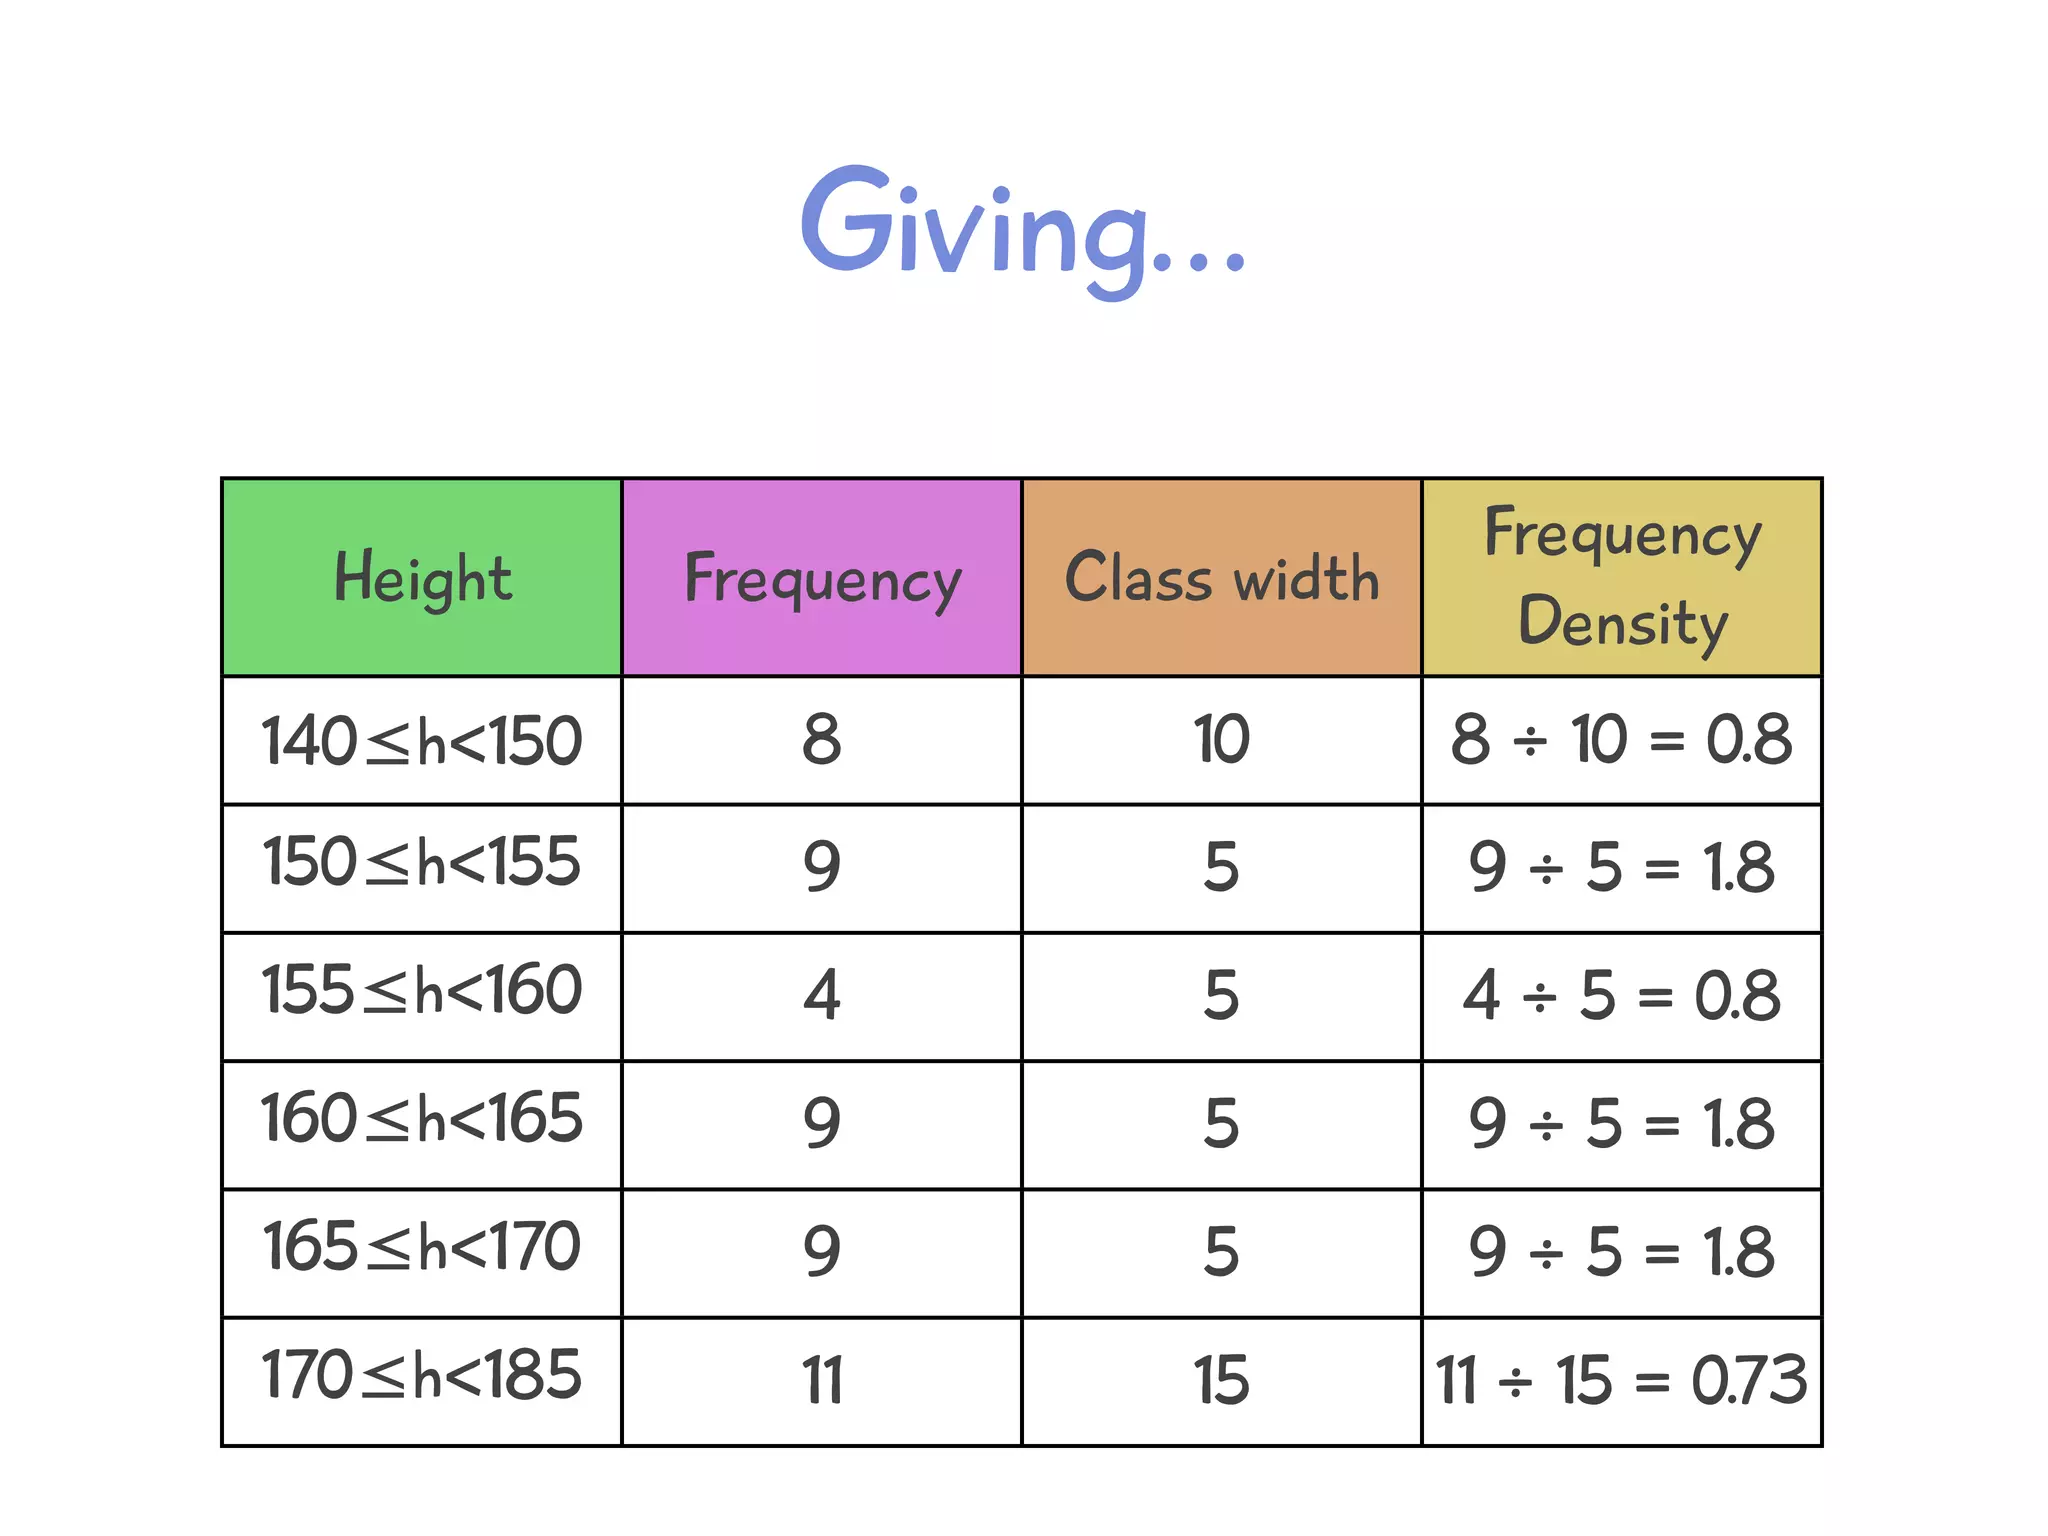
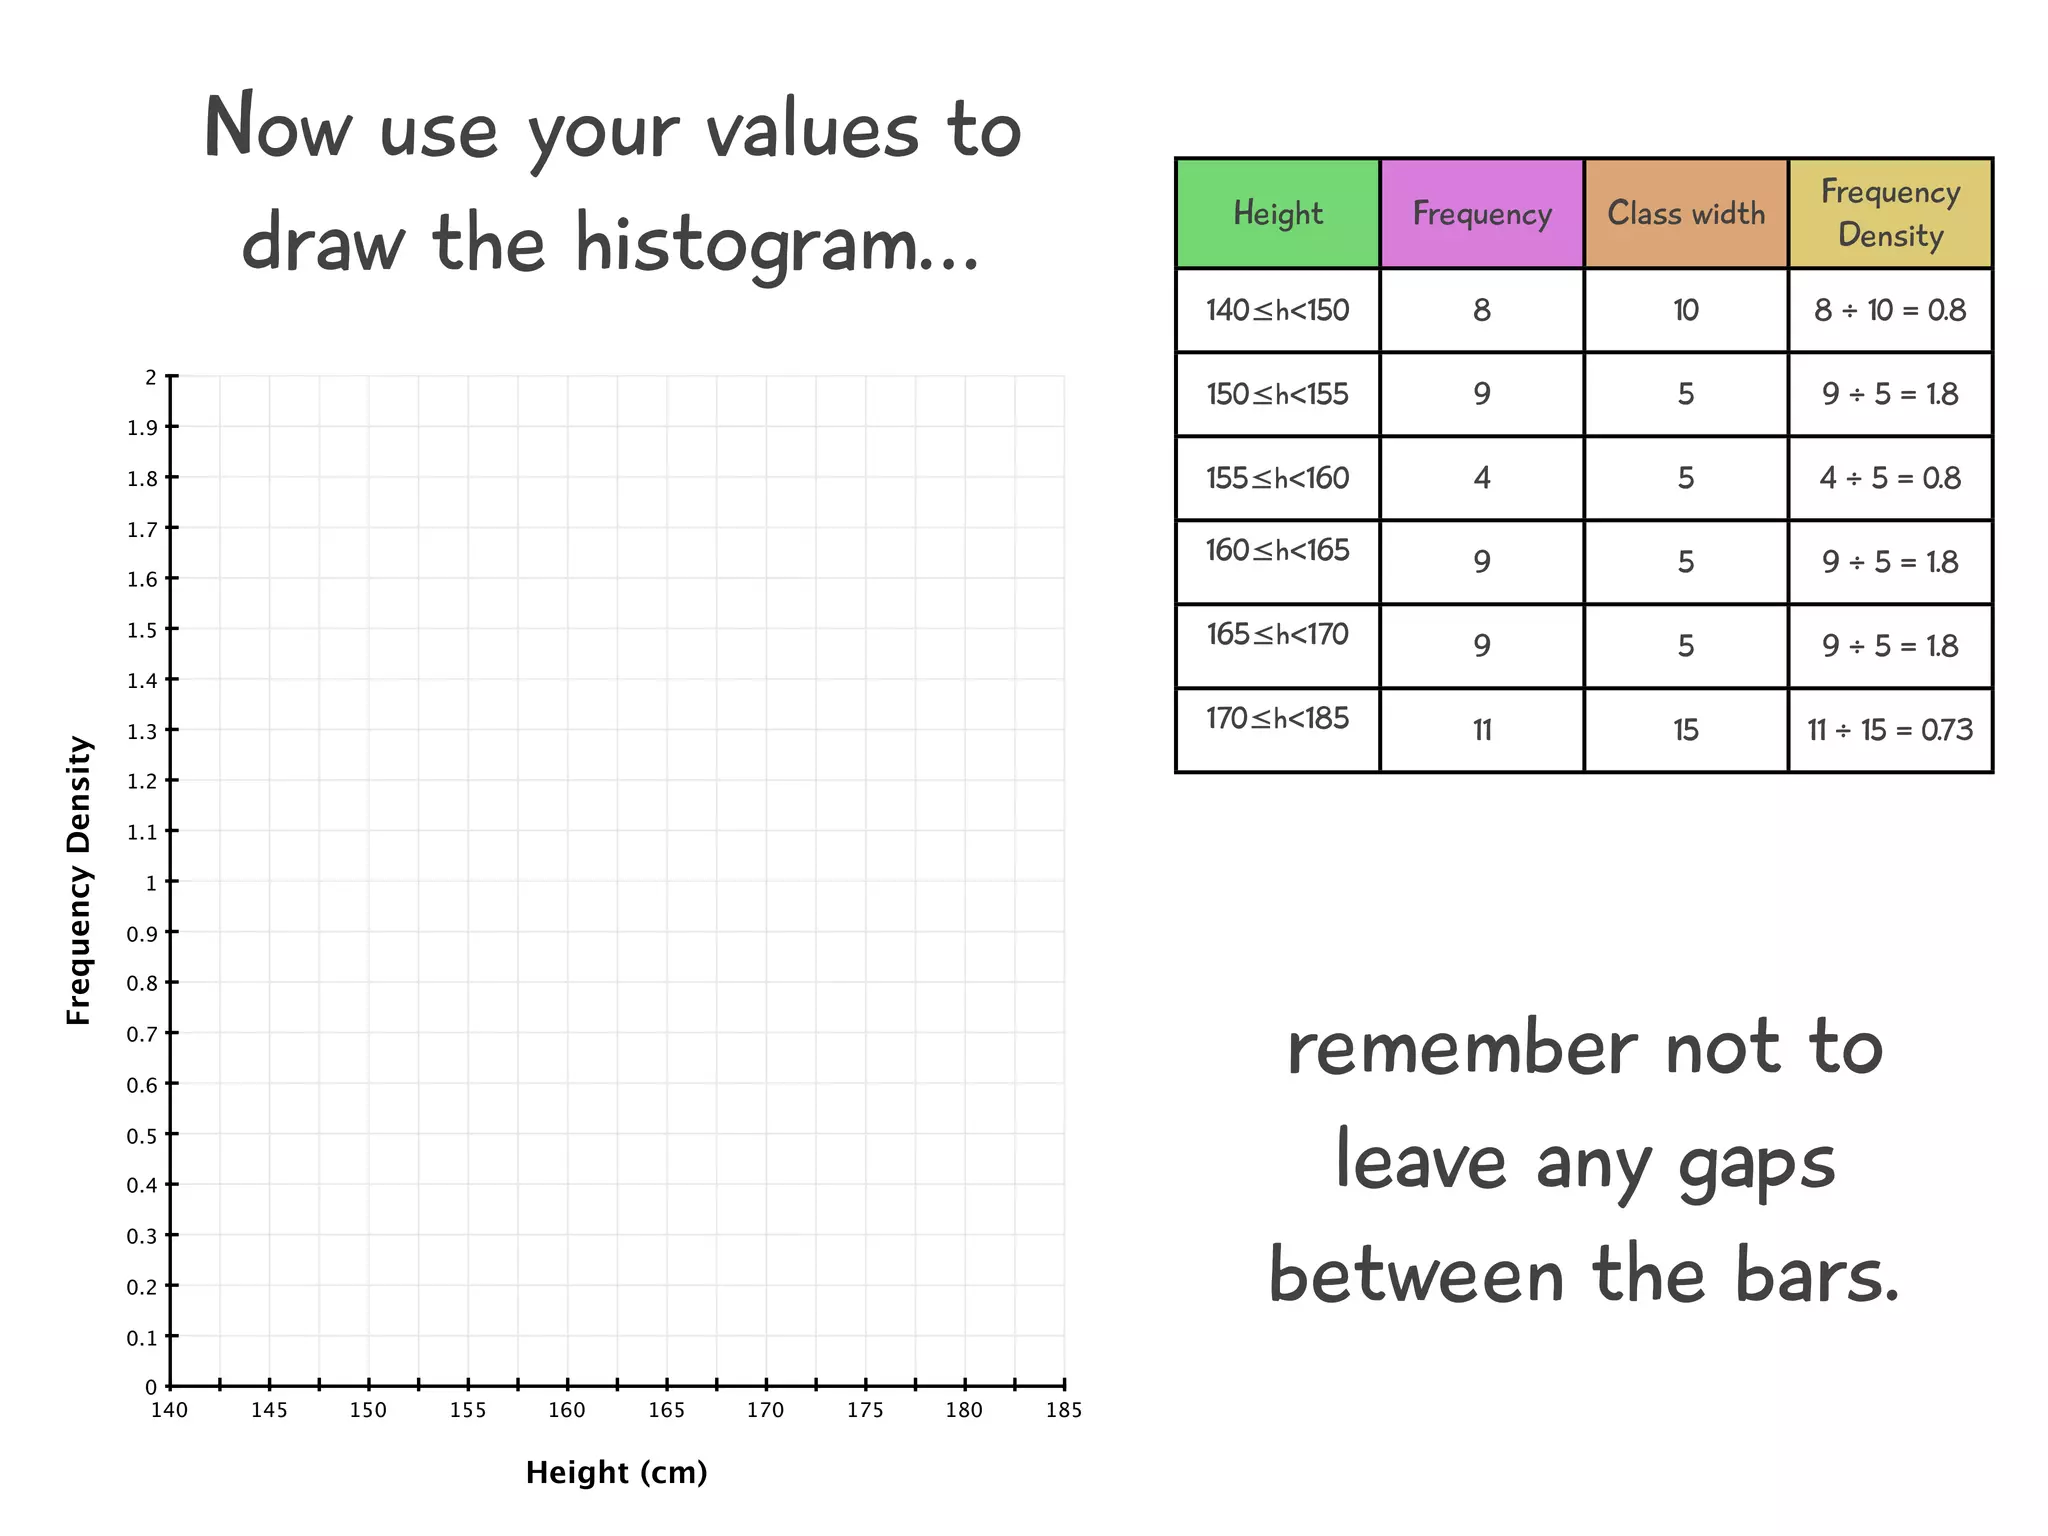
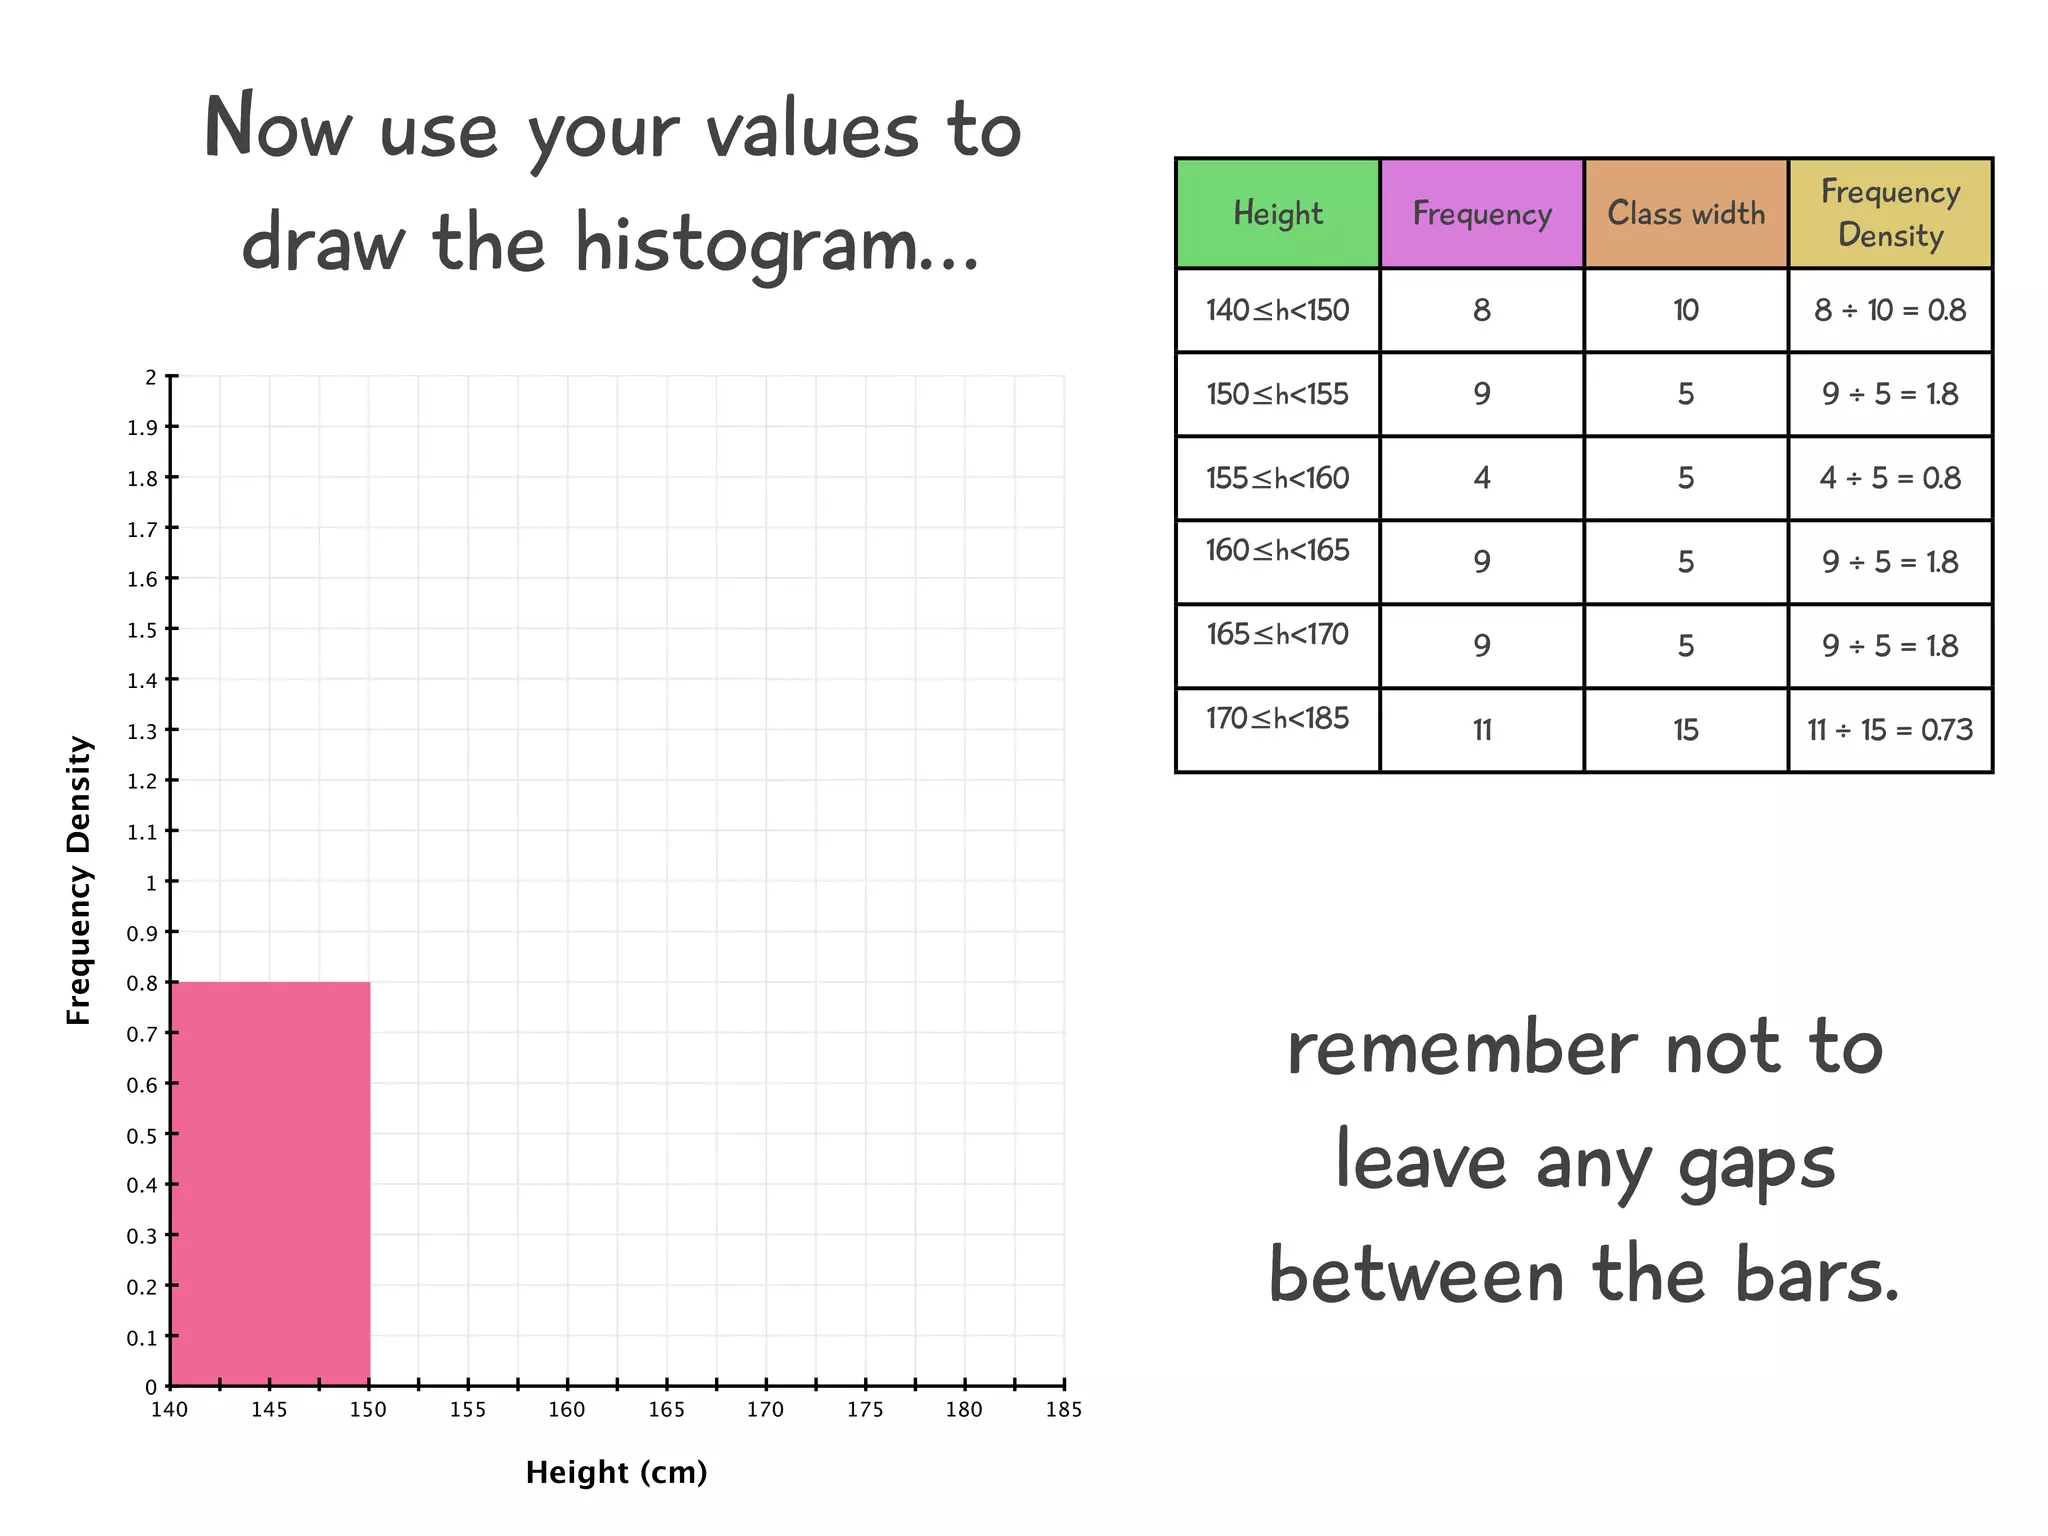
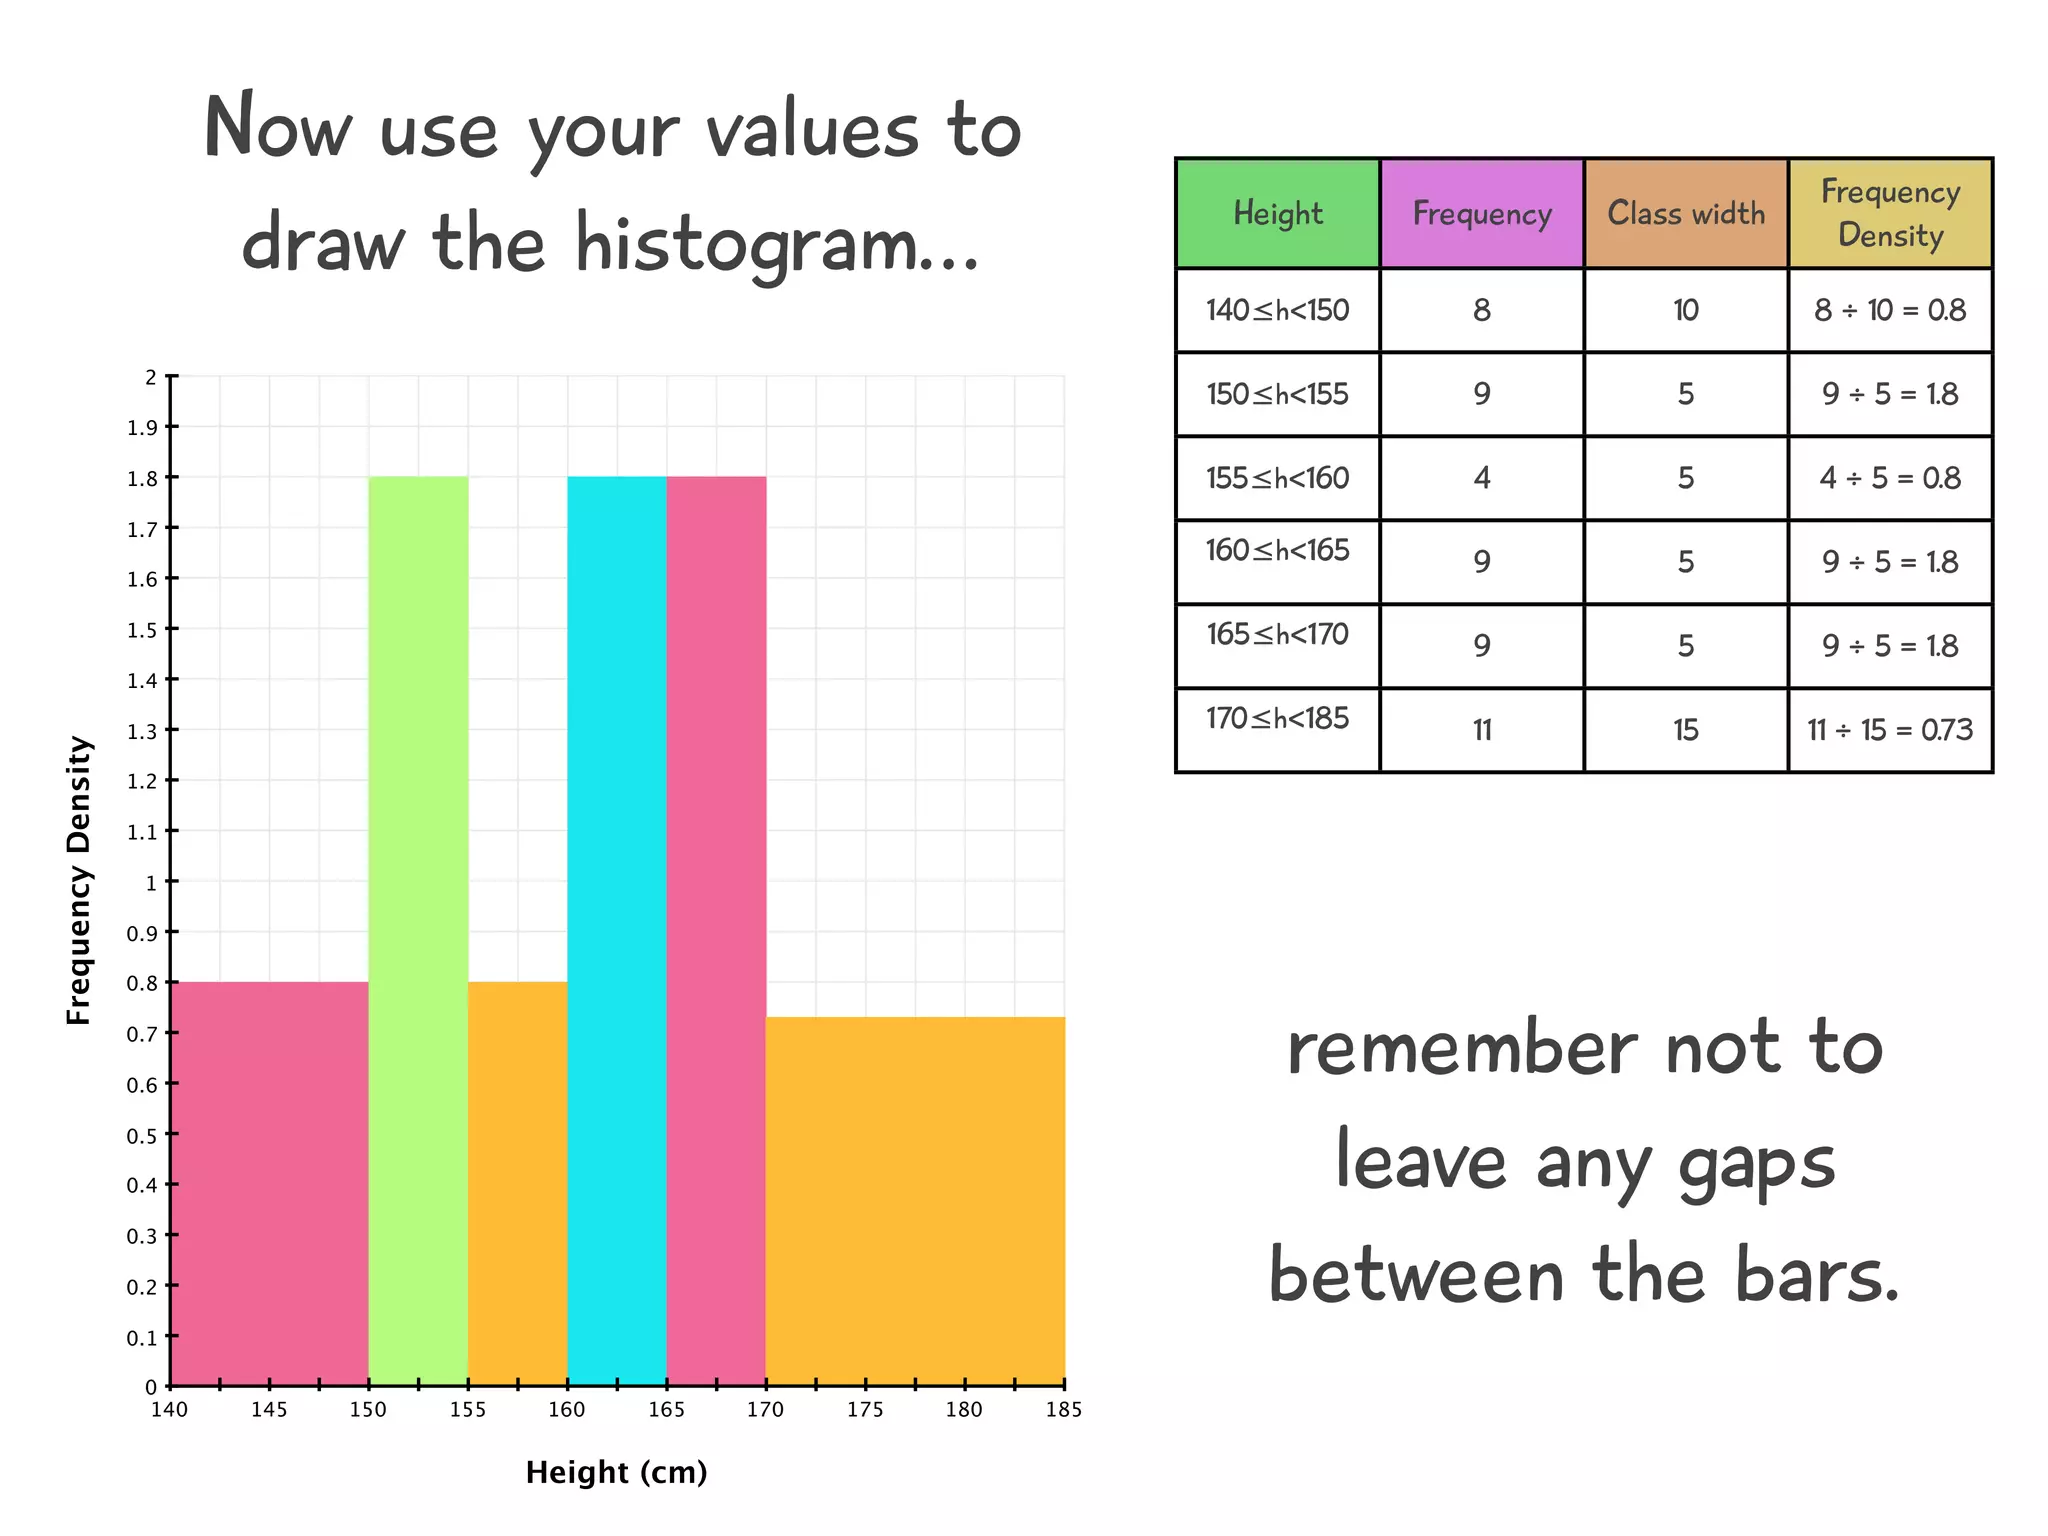

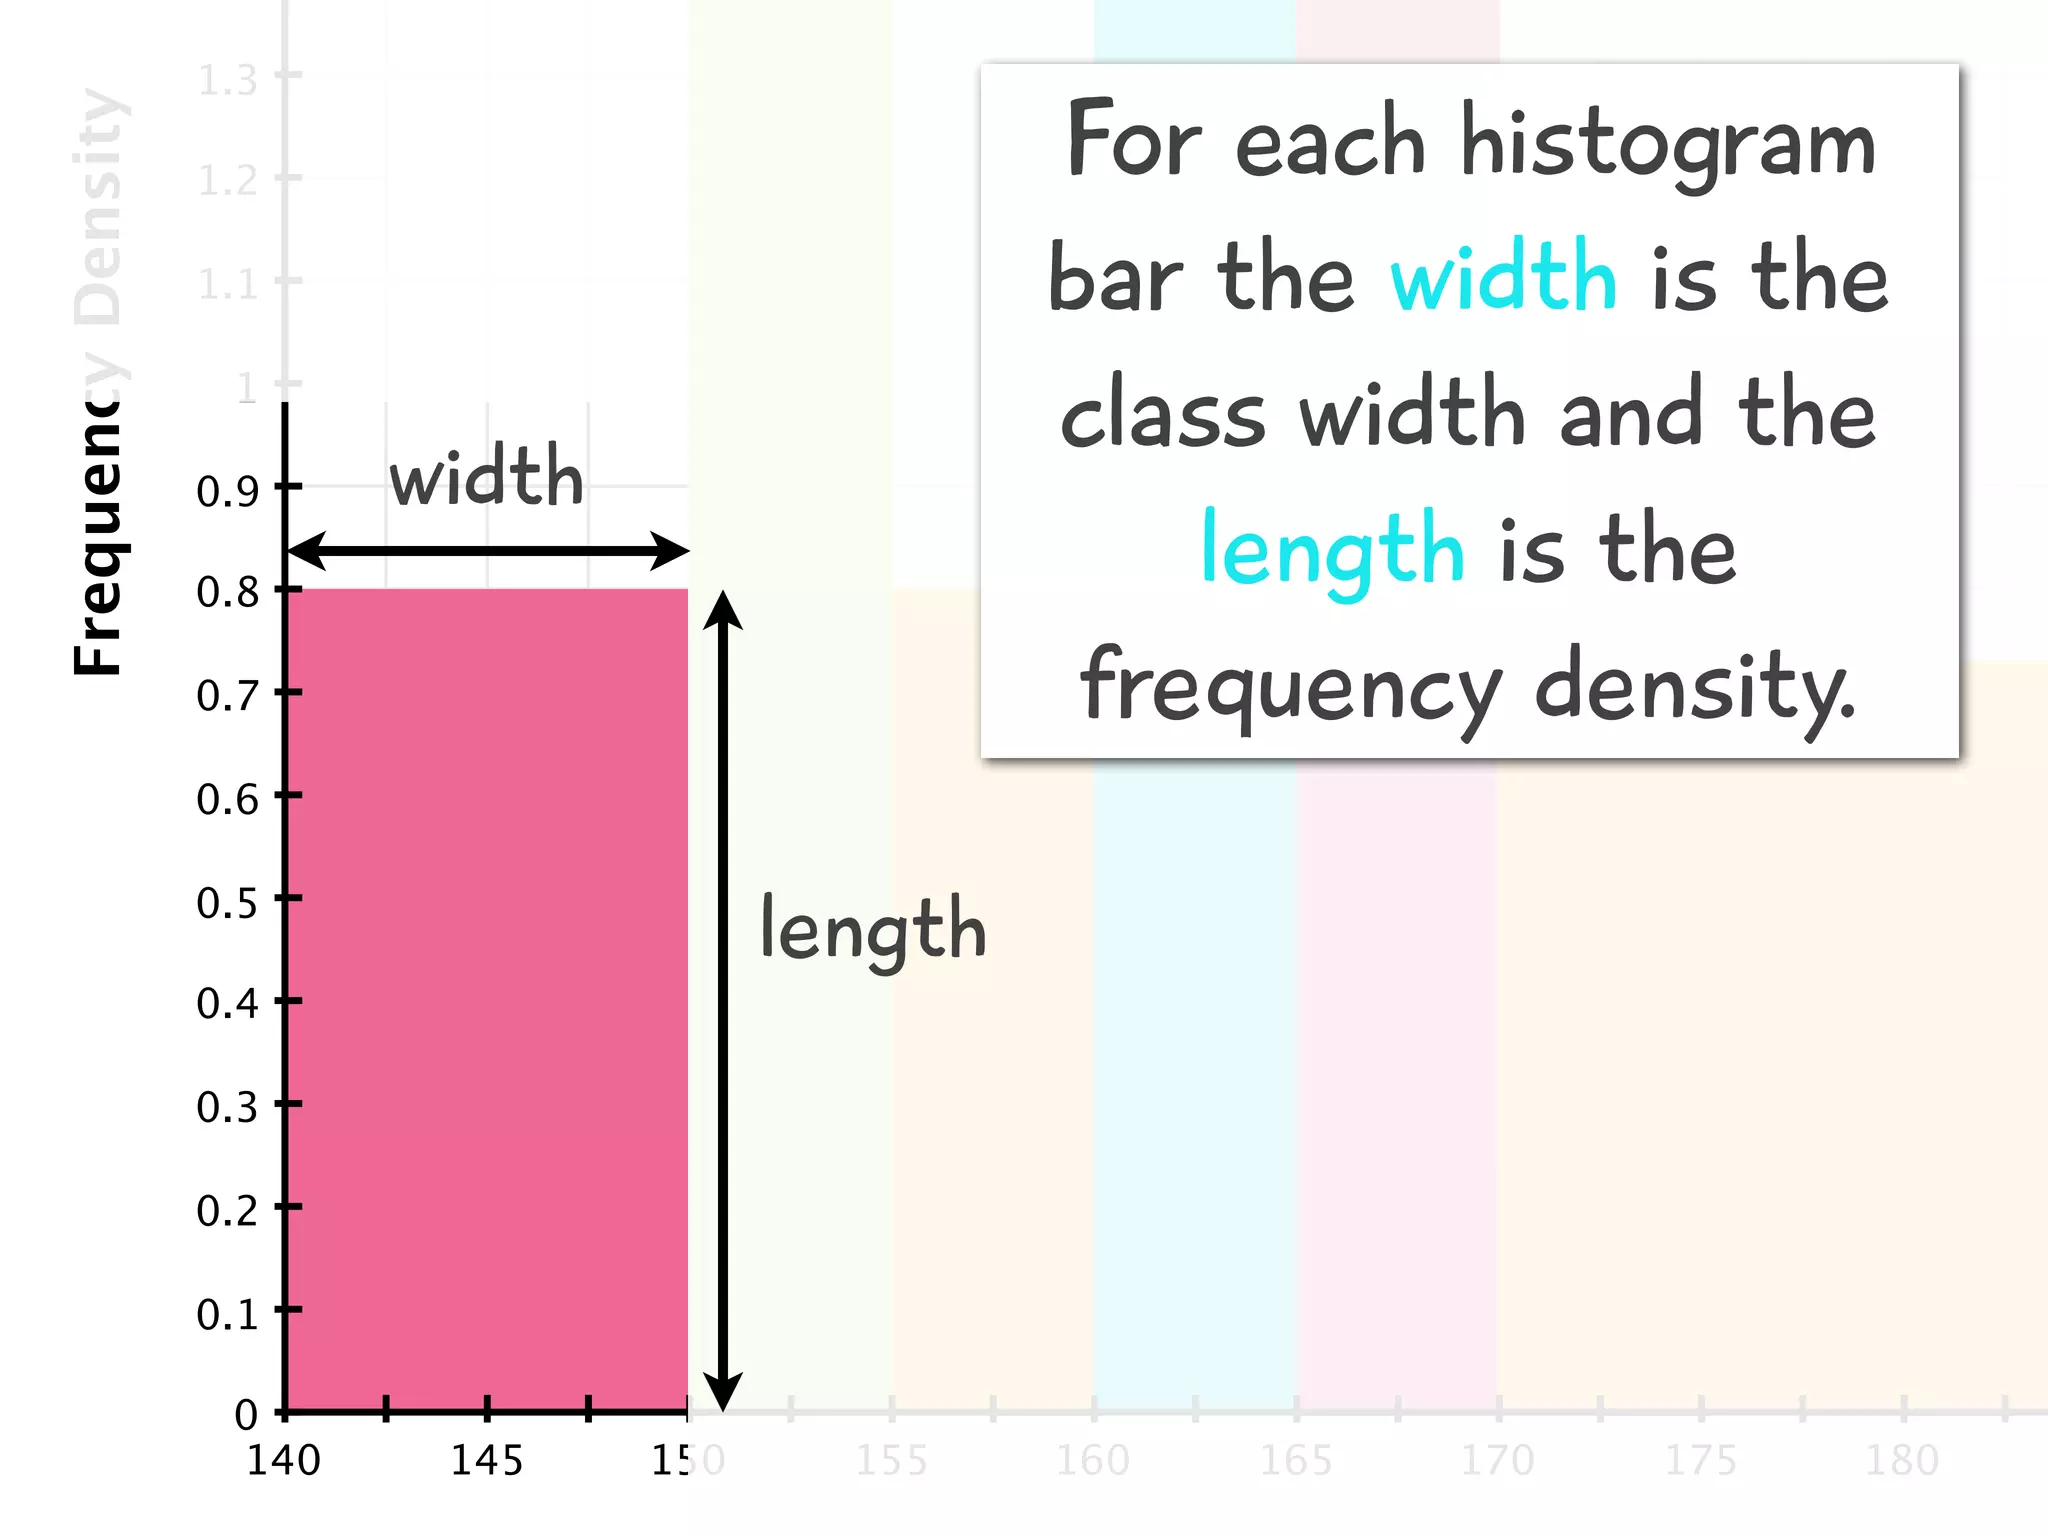
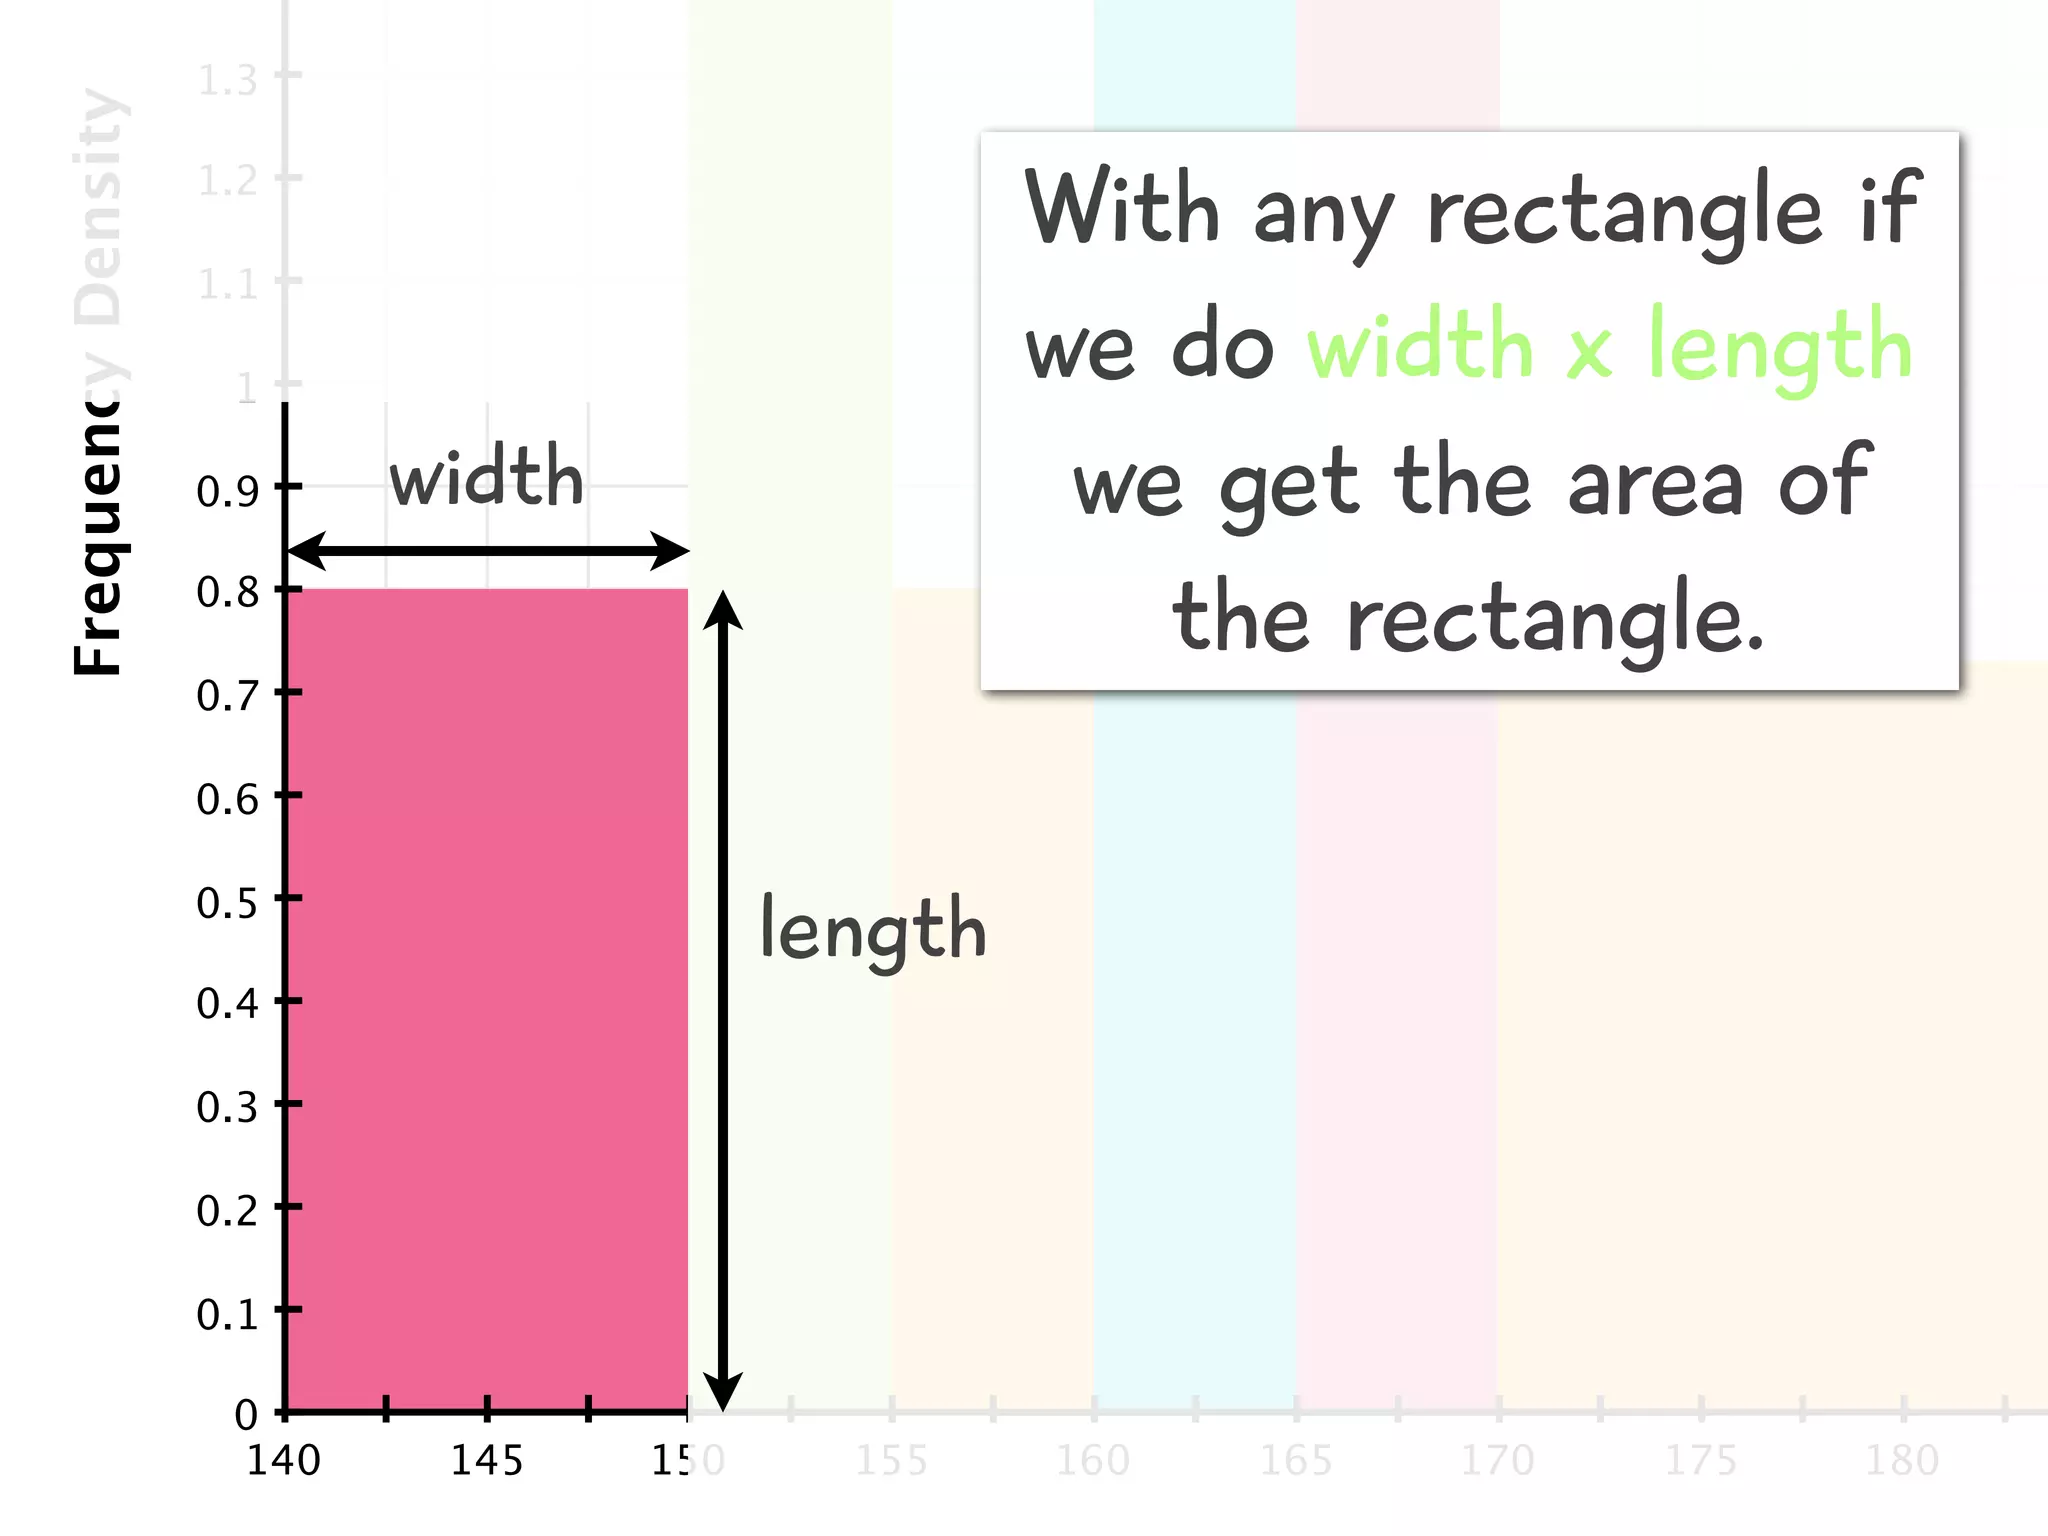
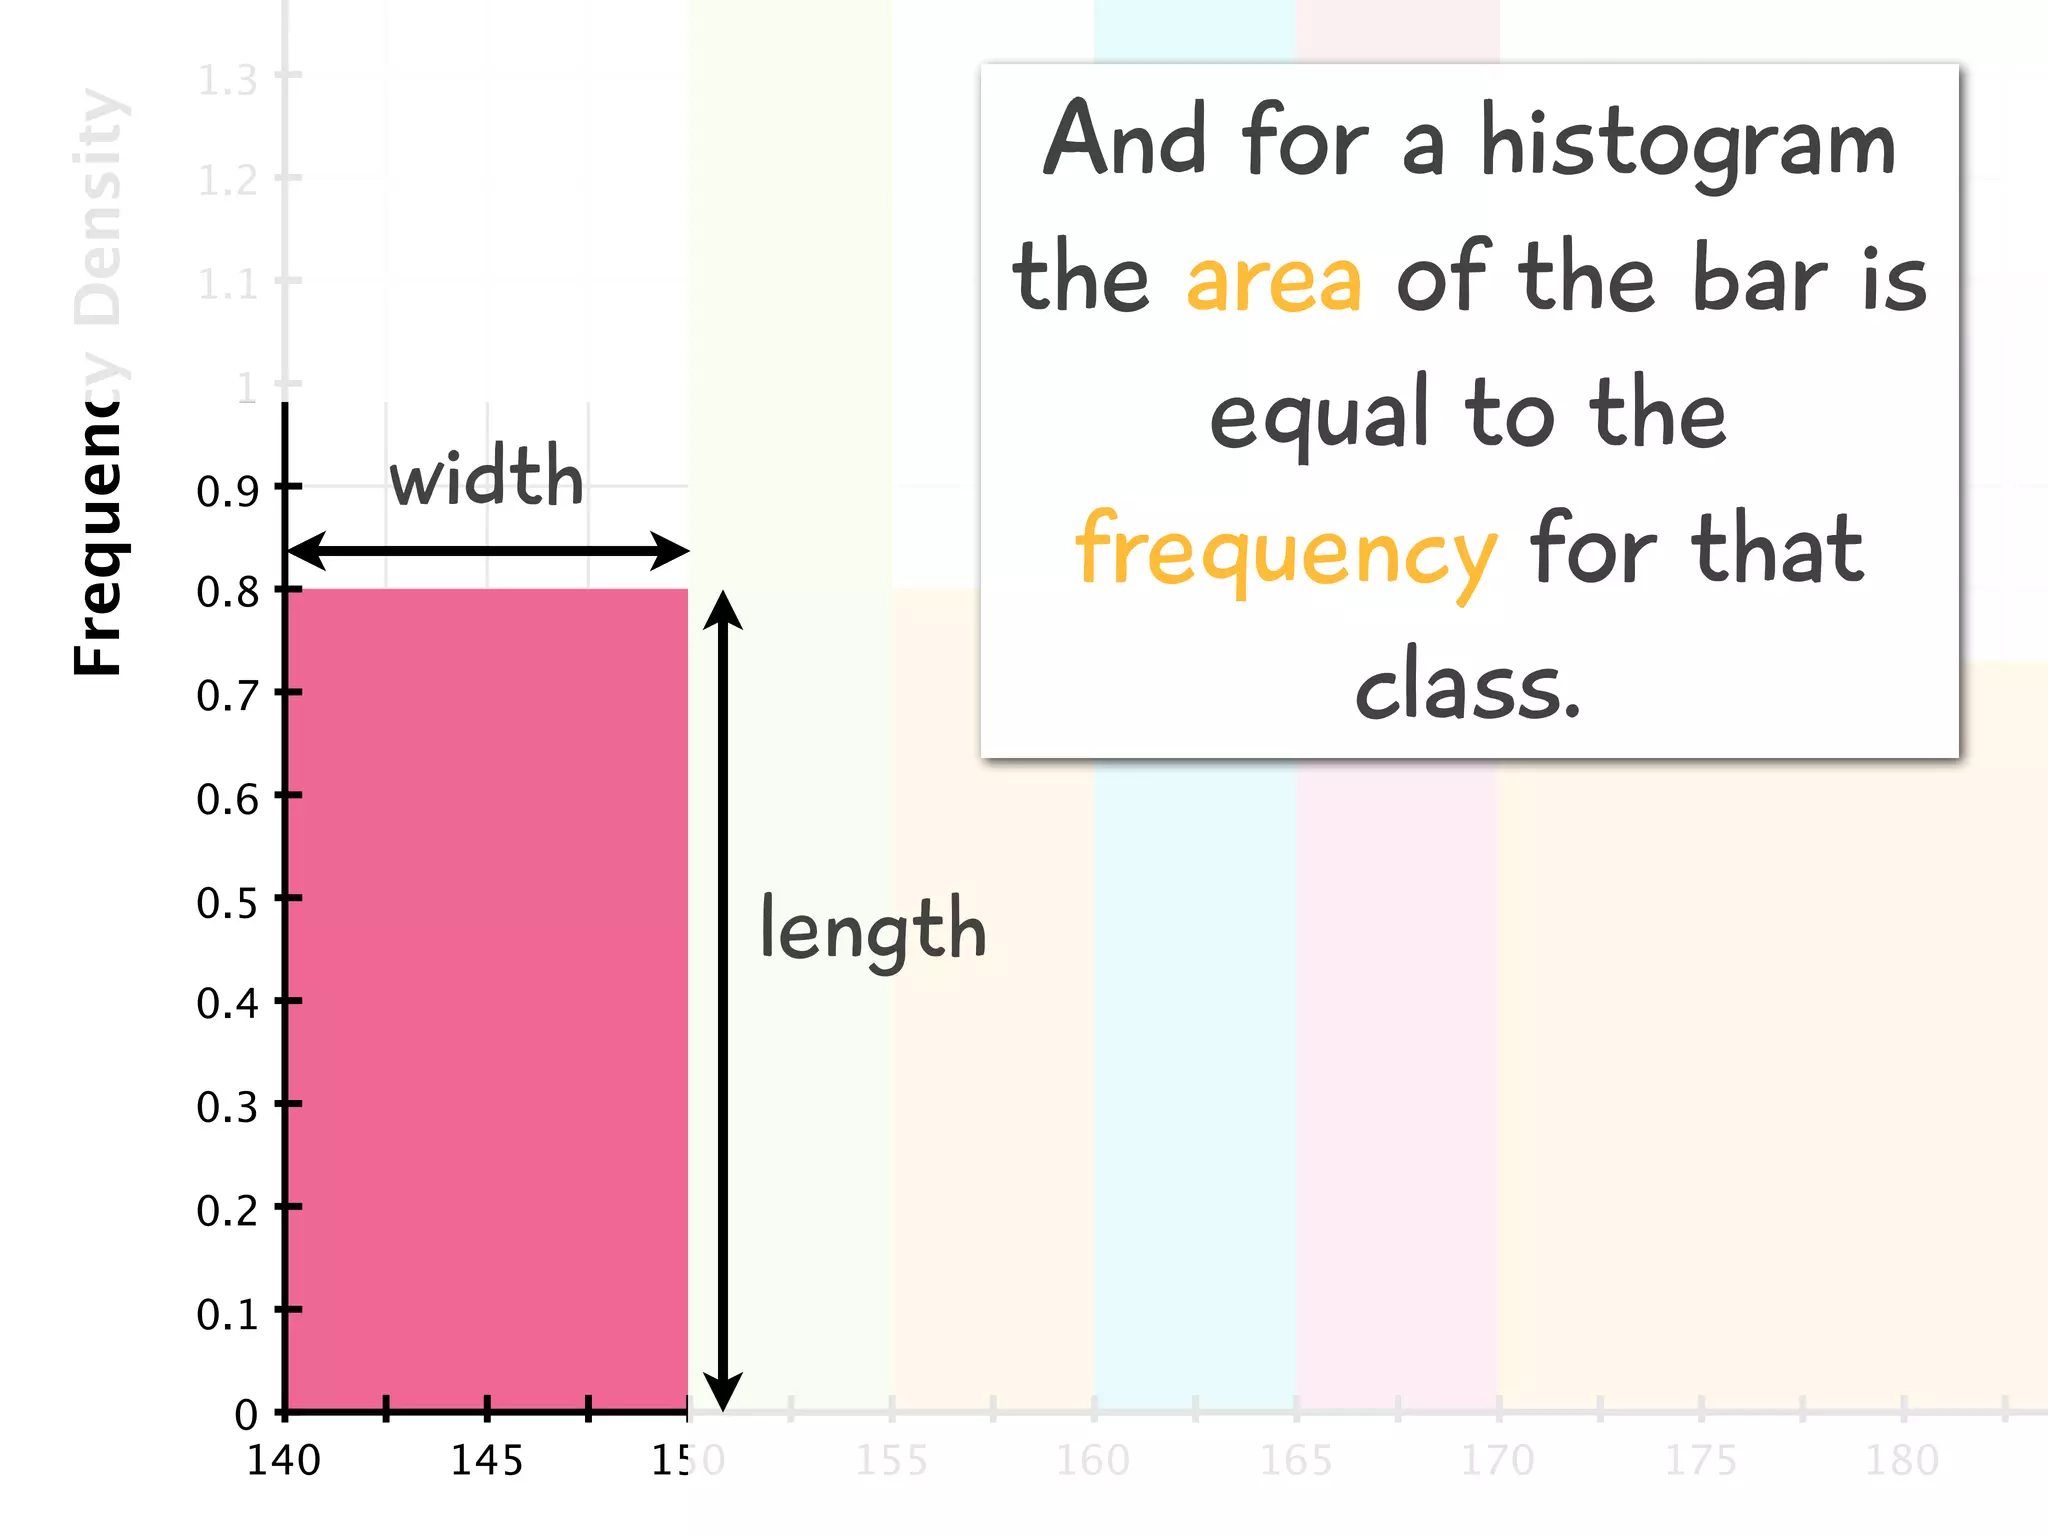
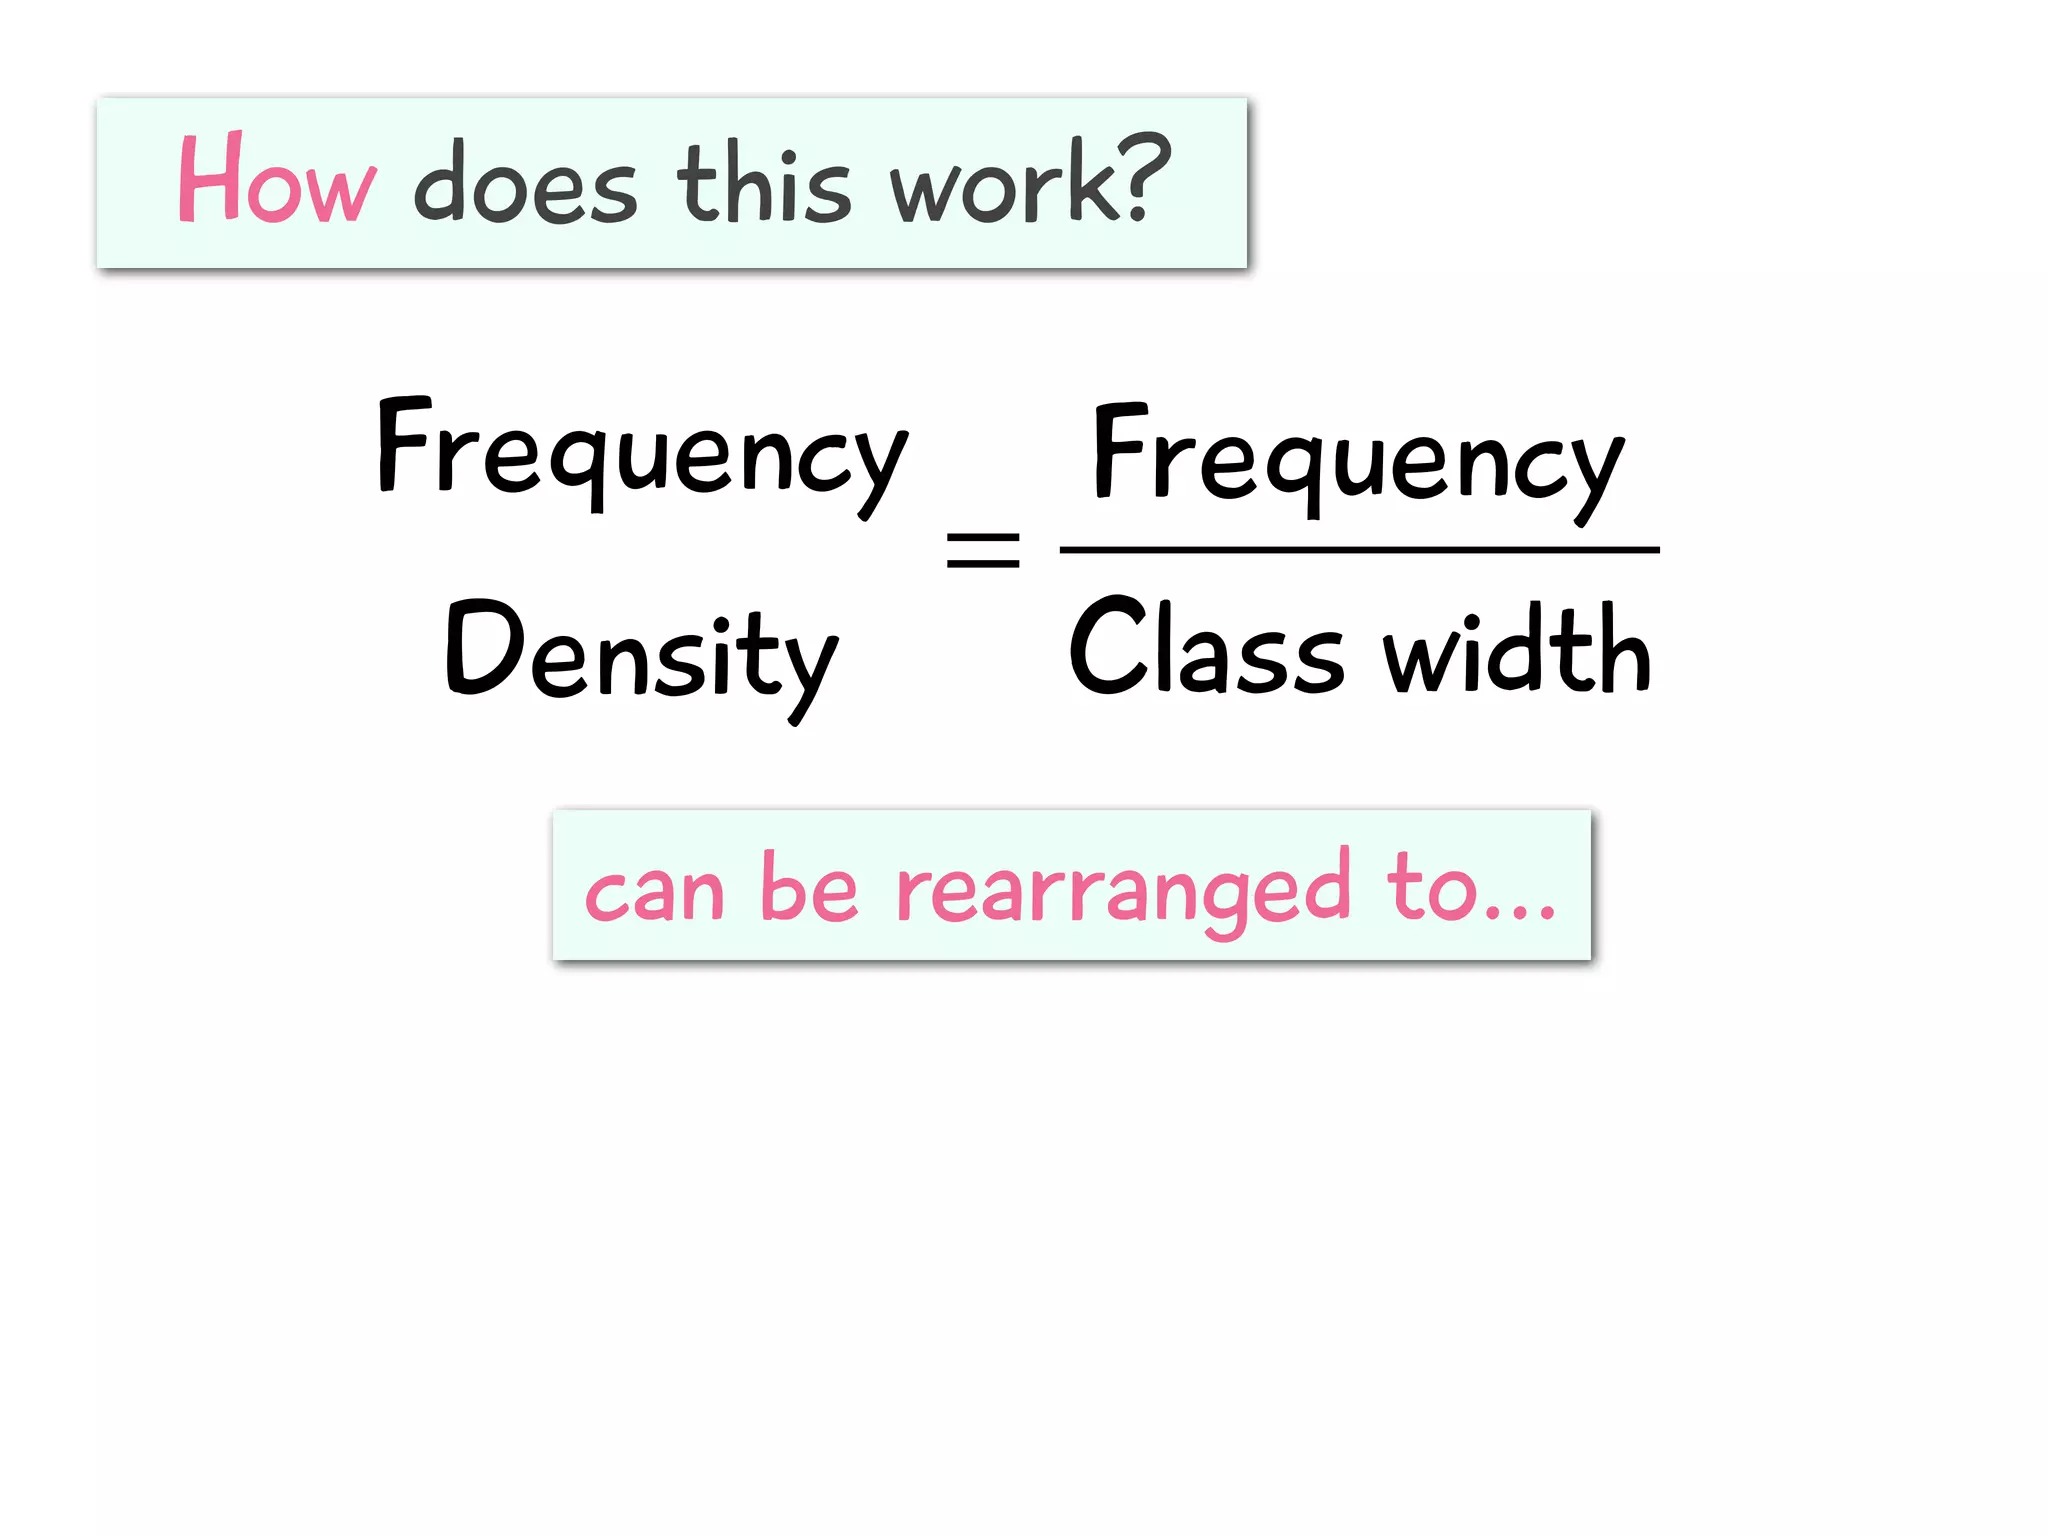
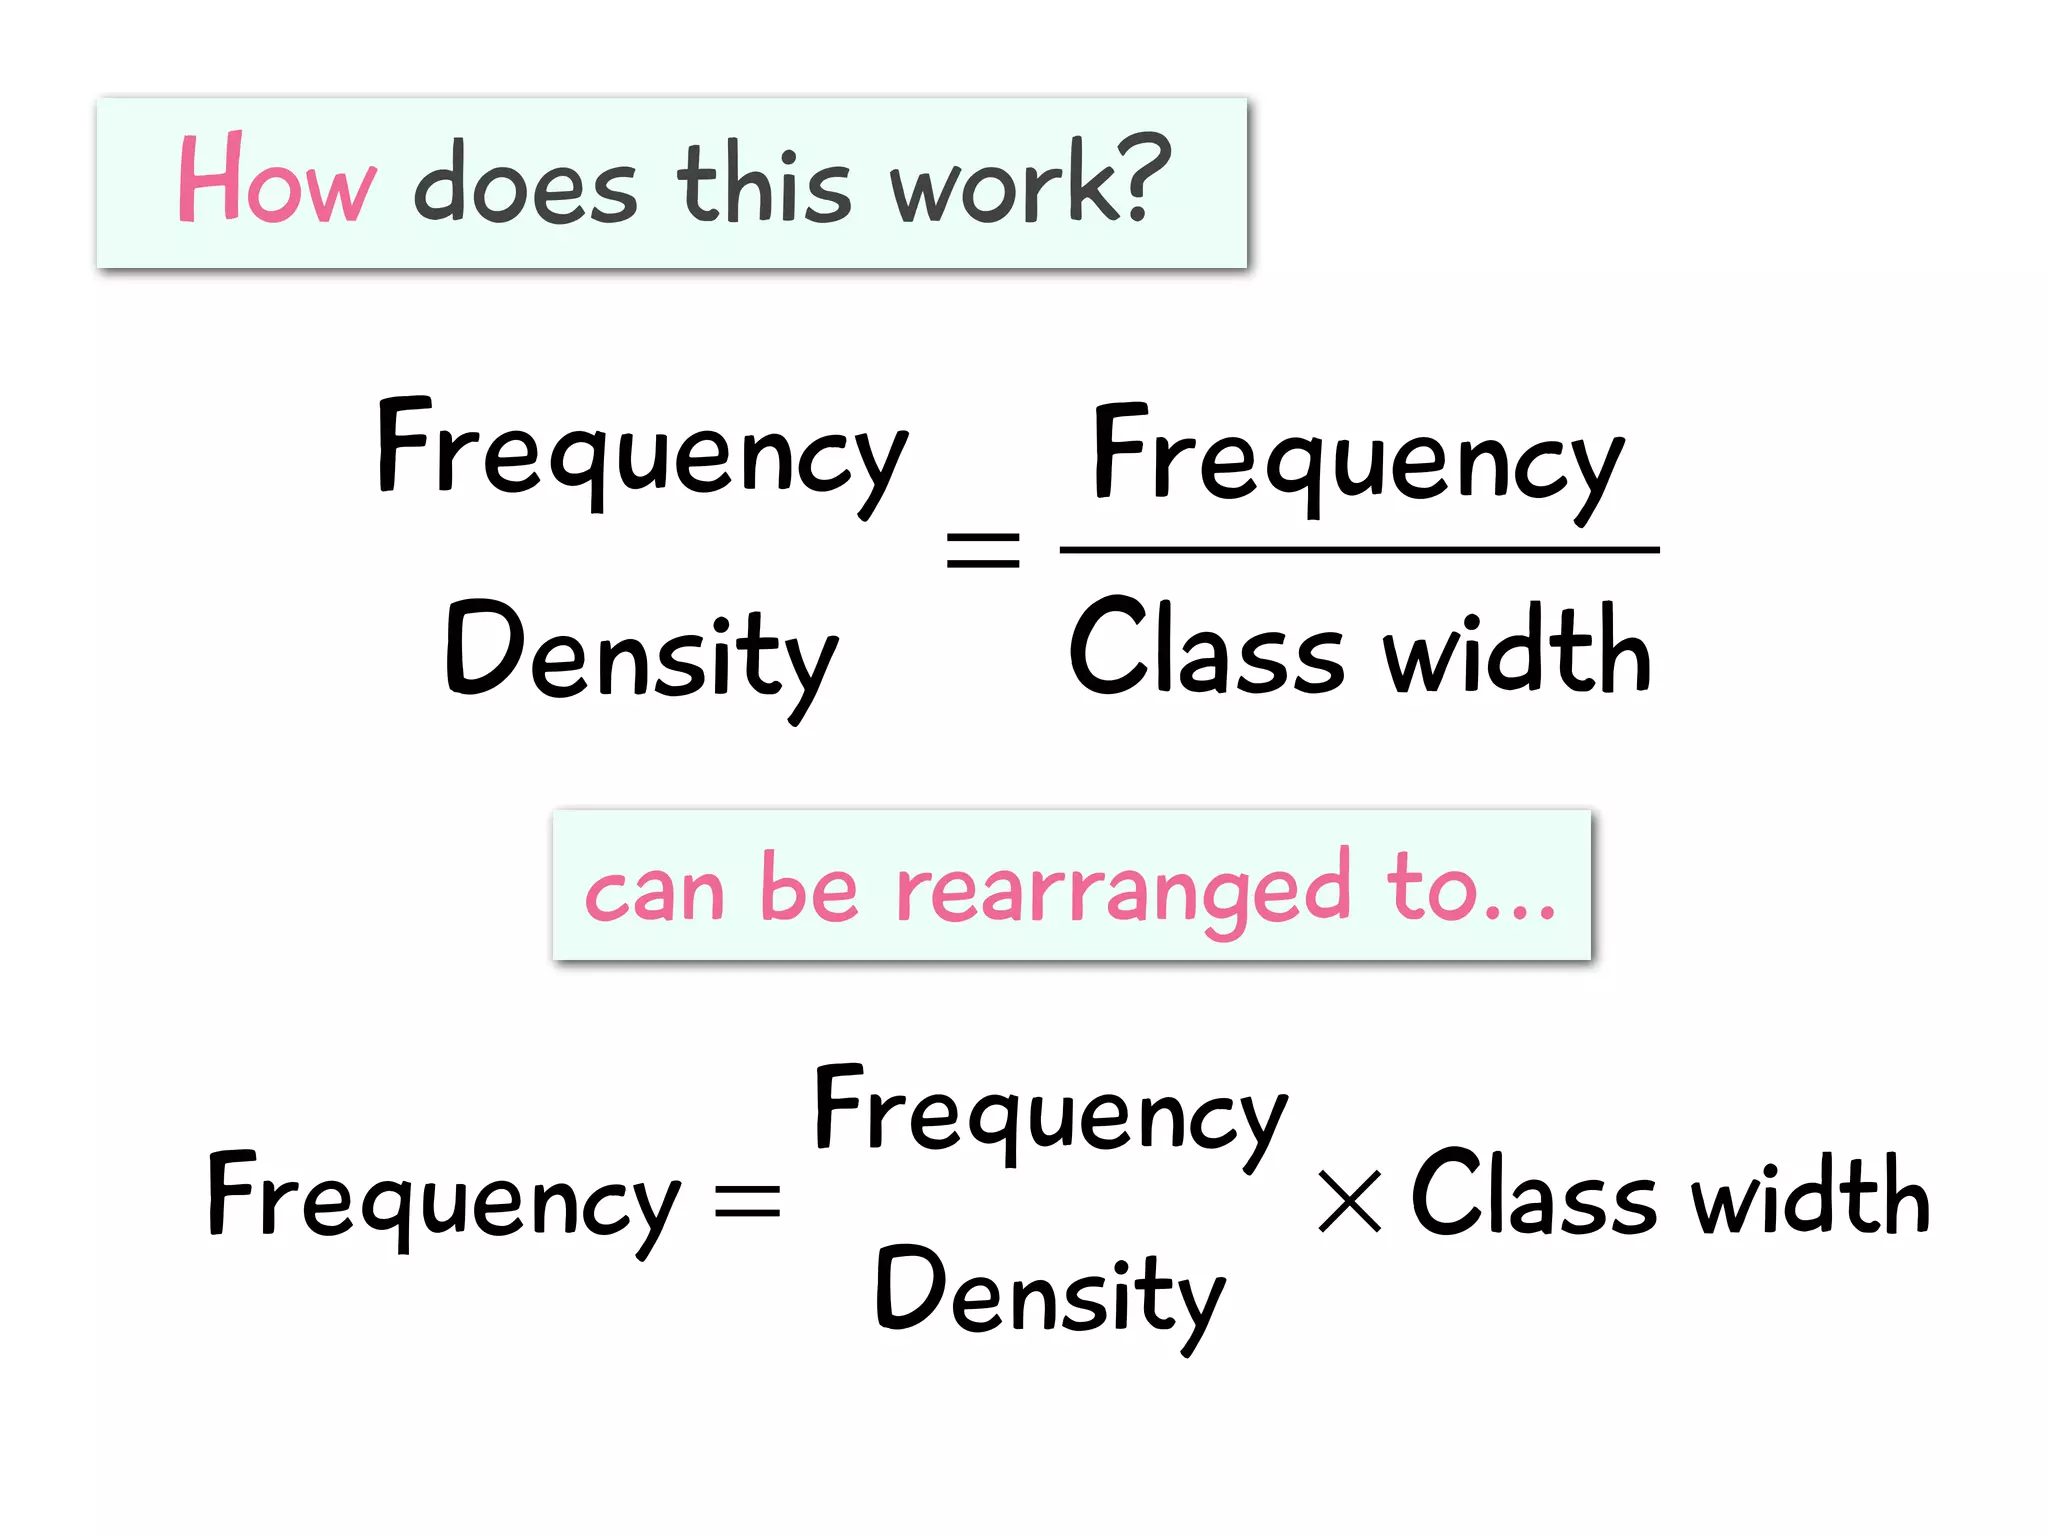
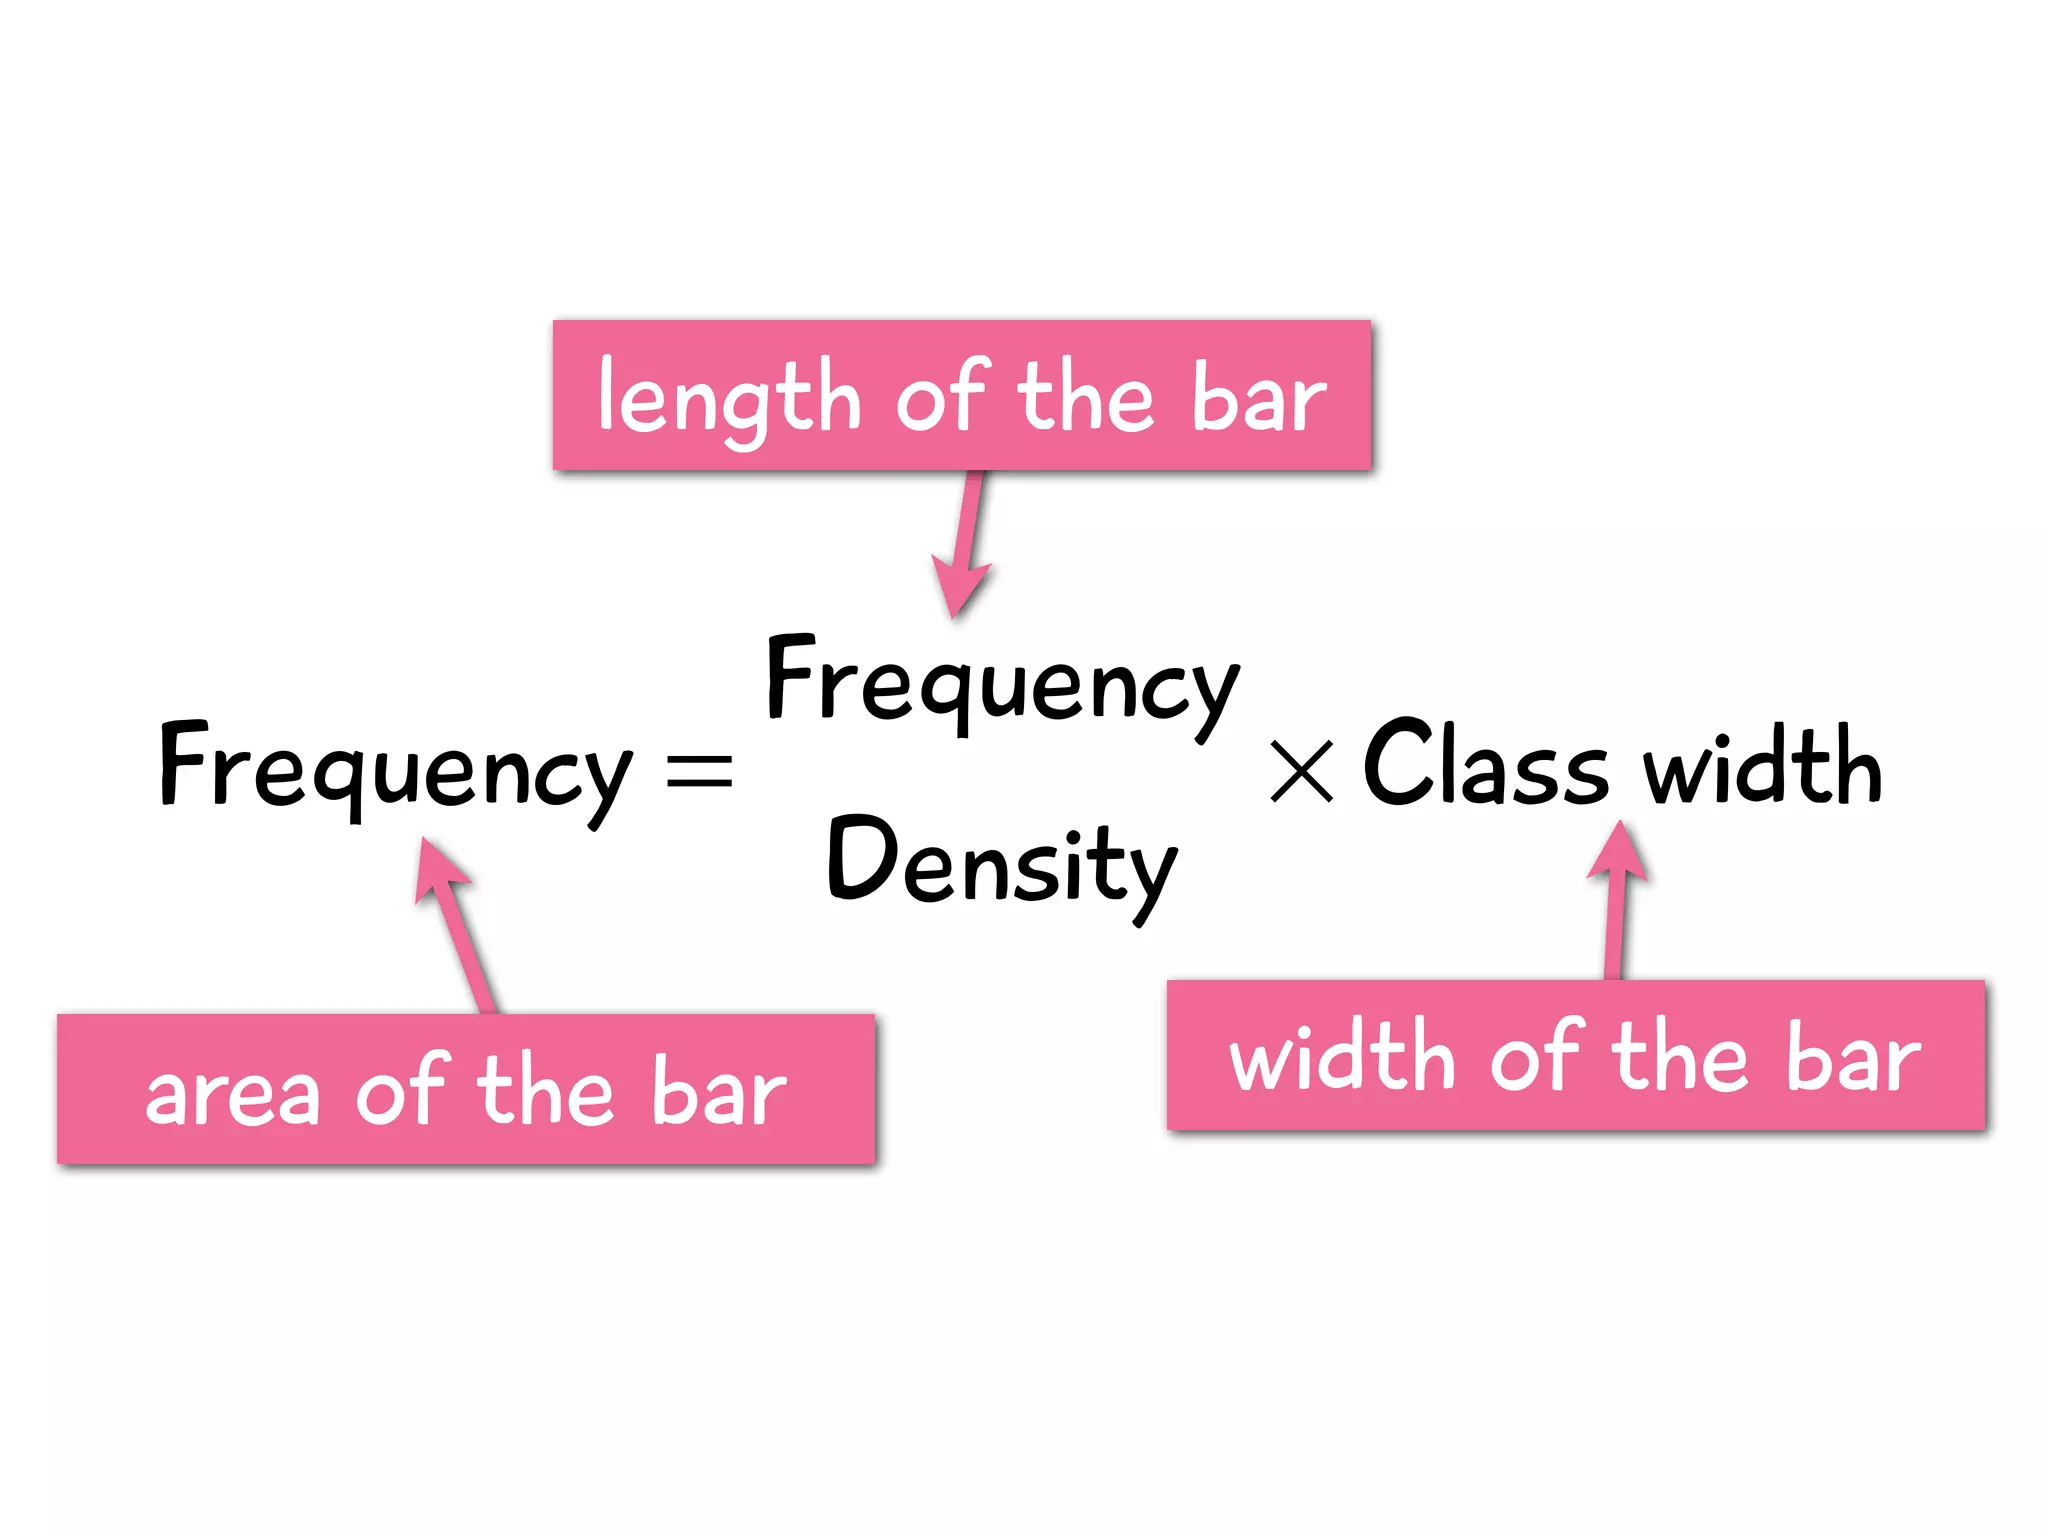
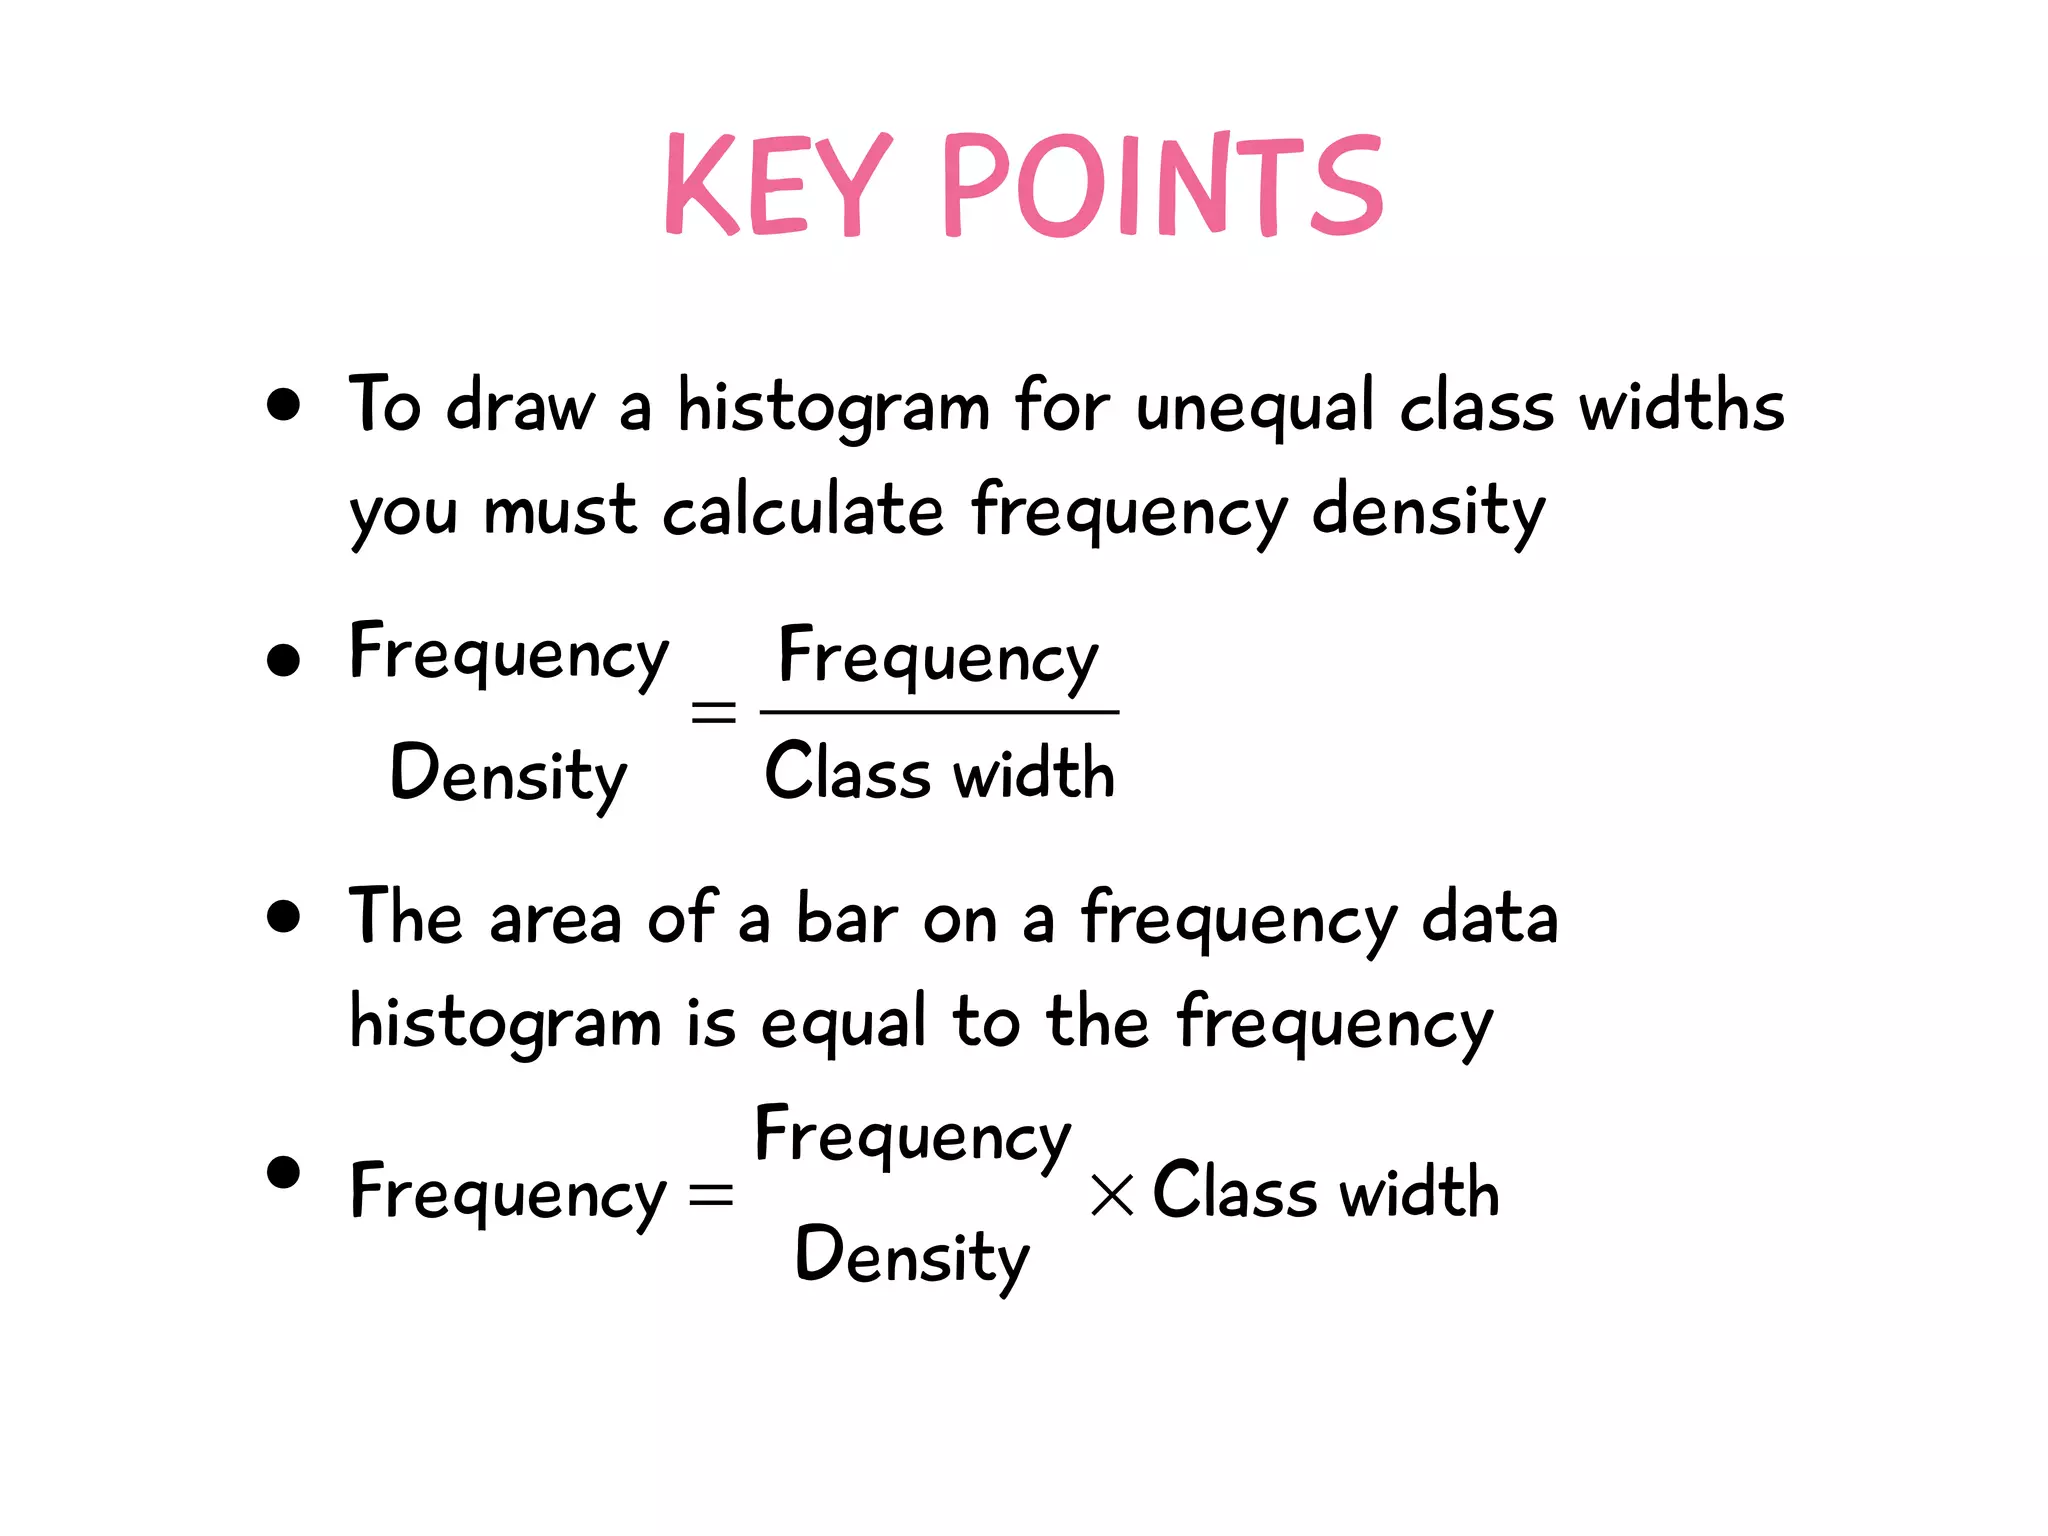

The document discusses how to draw a histogram when the class widths are unequal. It shows how to calculate frequency density for each class by dividing the frequency by the class width. This allows the heights of the bars to be represented as frequency density rather than frequency. The area of each bar then represents the frequency for that class. Calculating the frequency density is necessary to properly represent the data when class widths differ.