Download to read offline
![HOW TO DRAW A HISTOGRAM
Steps for constructing a frequency distribution bar graph
are as follows:
1. Count number of data points[n] from data sheet.
2. Compute the range of data[R].
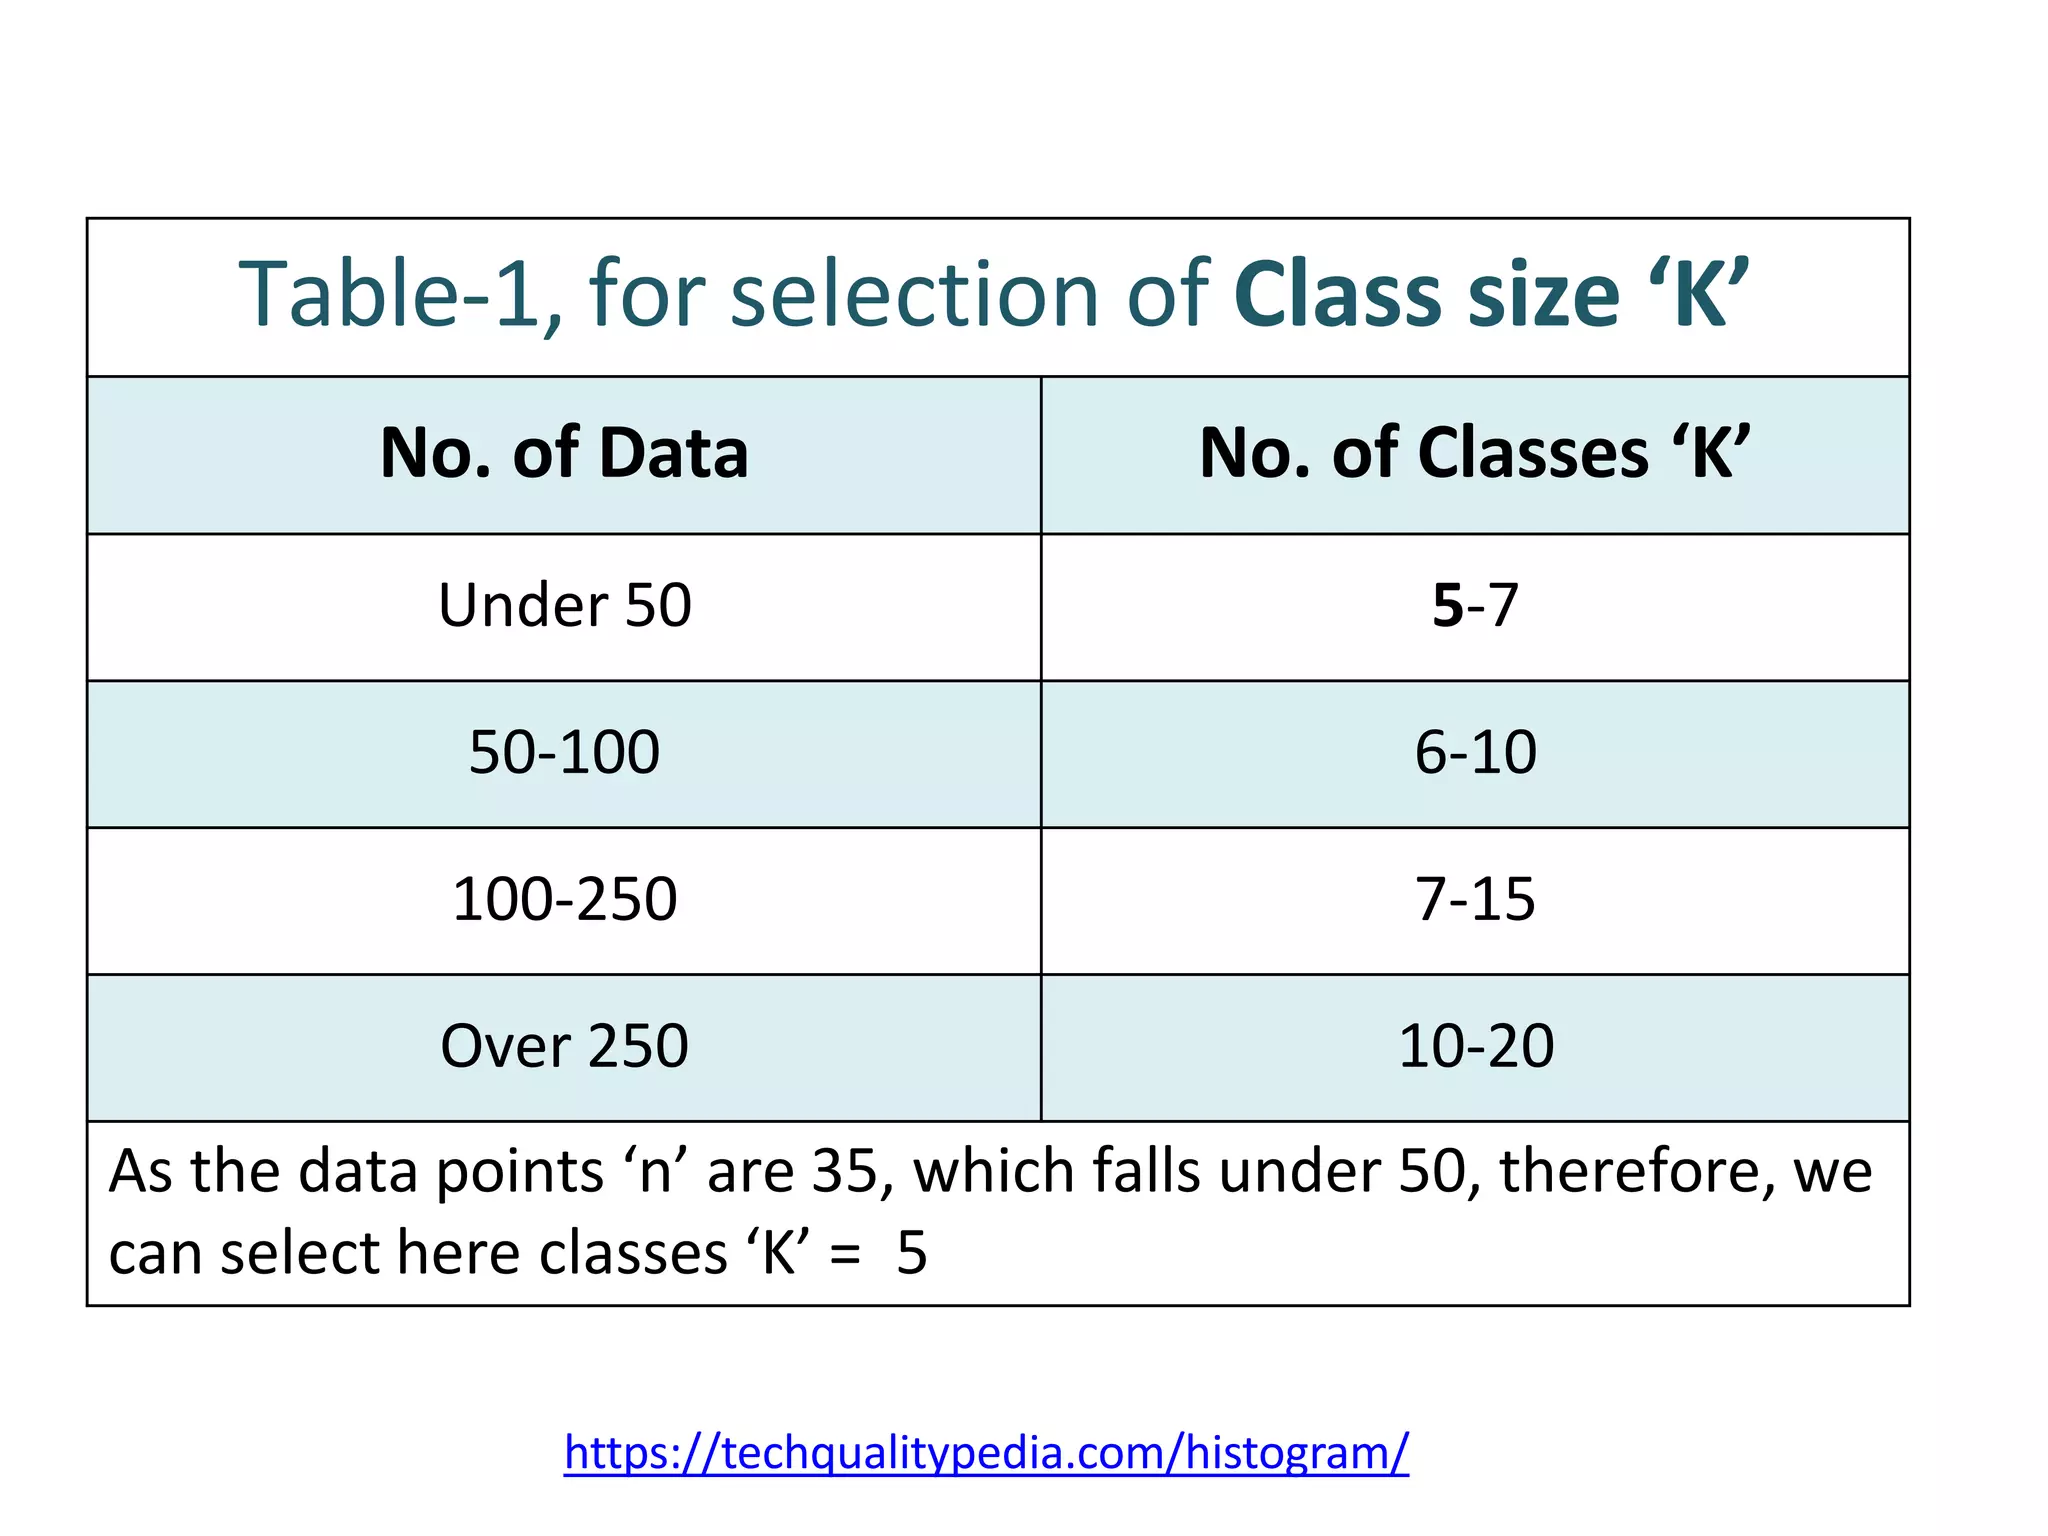
3. Determine the number of classes/interval or class size[K].
4. Compute class/interval width[H] using formula [ H = R/K ]
5. Determine the starting points of intervals.
6. Prepare Tally/Check sheet by summarize data on it.
7. Count number of parts in each intervals i.e. Number of
frequencies within a particular class.
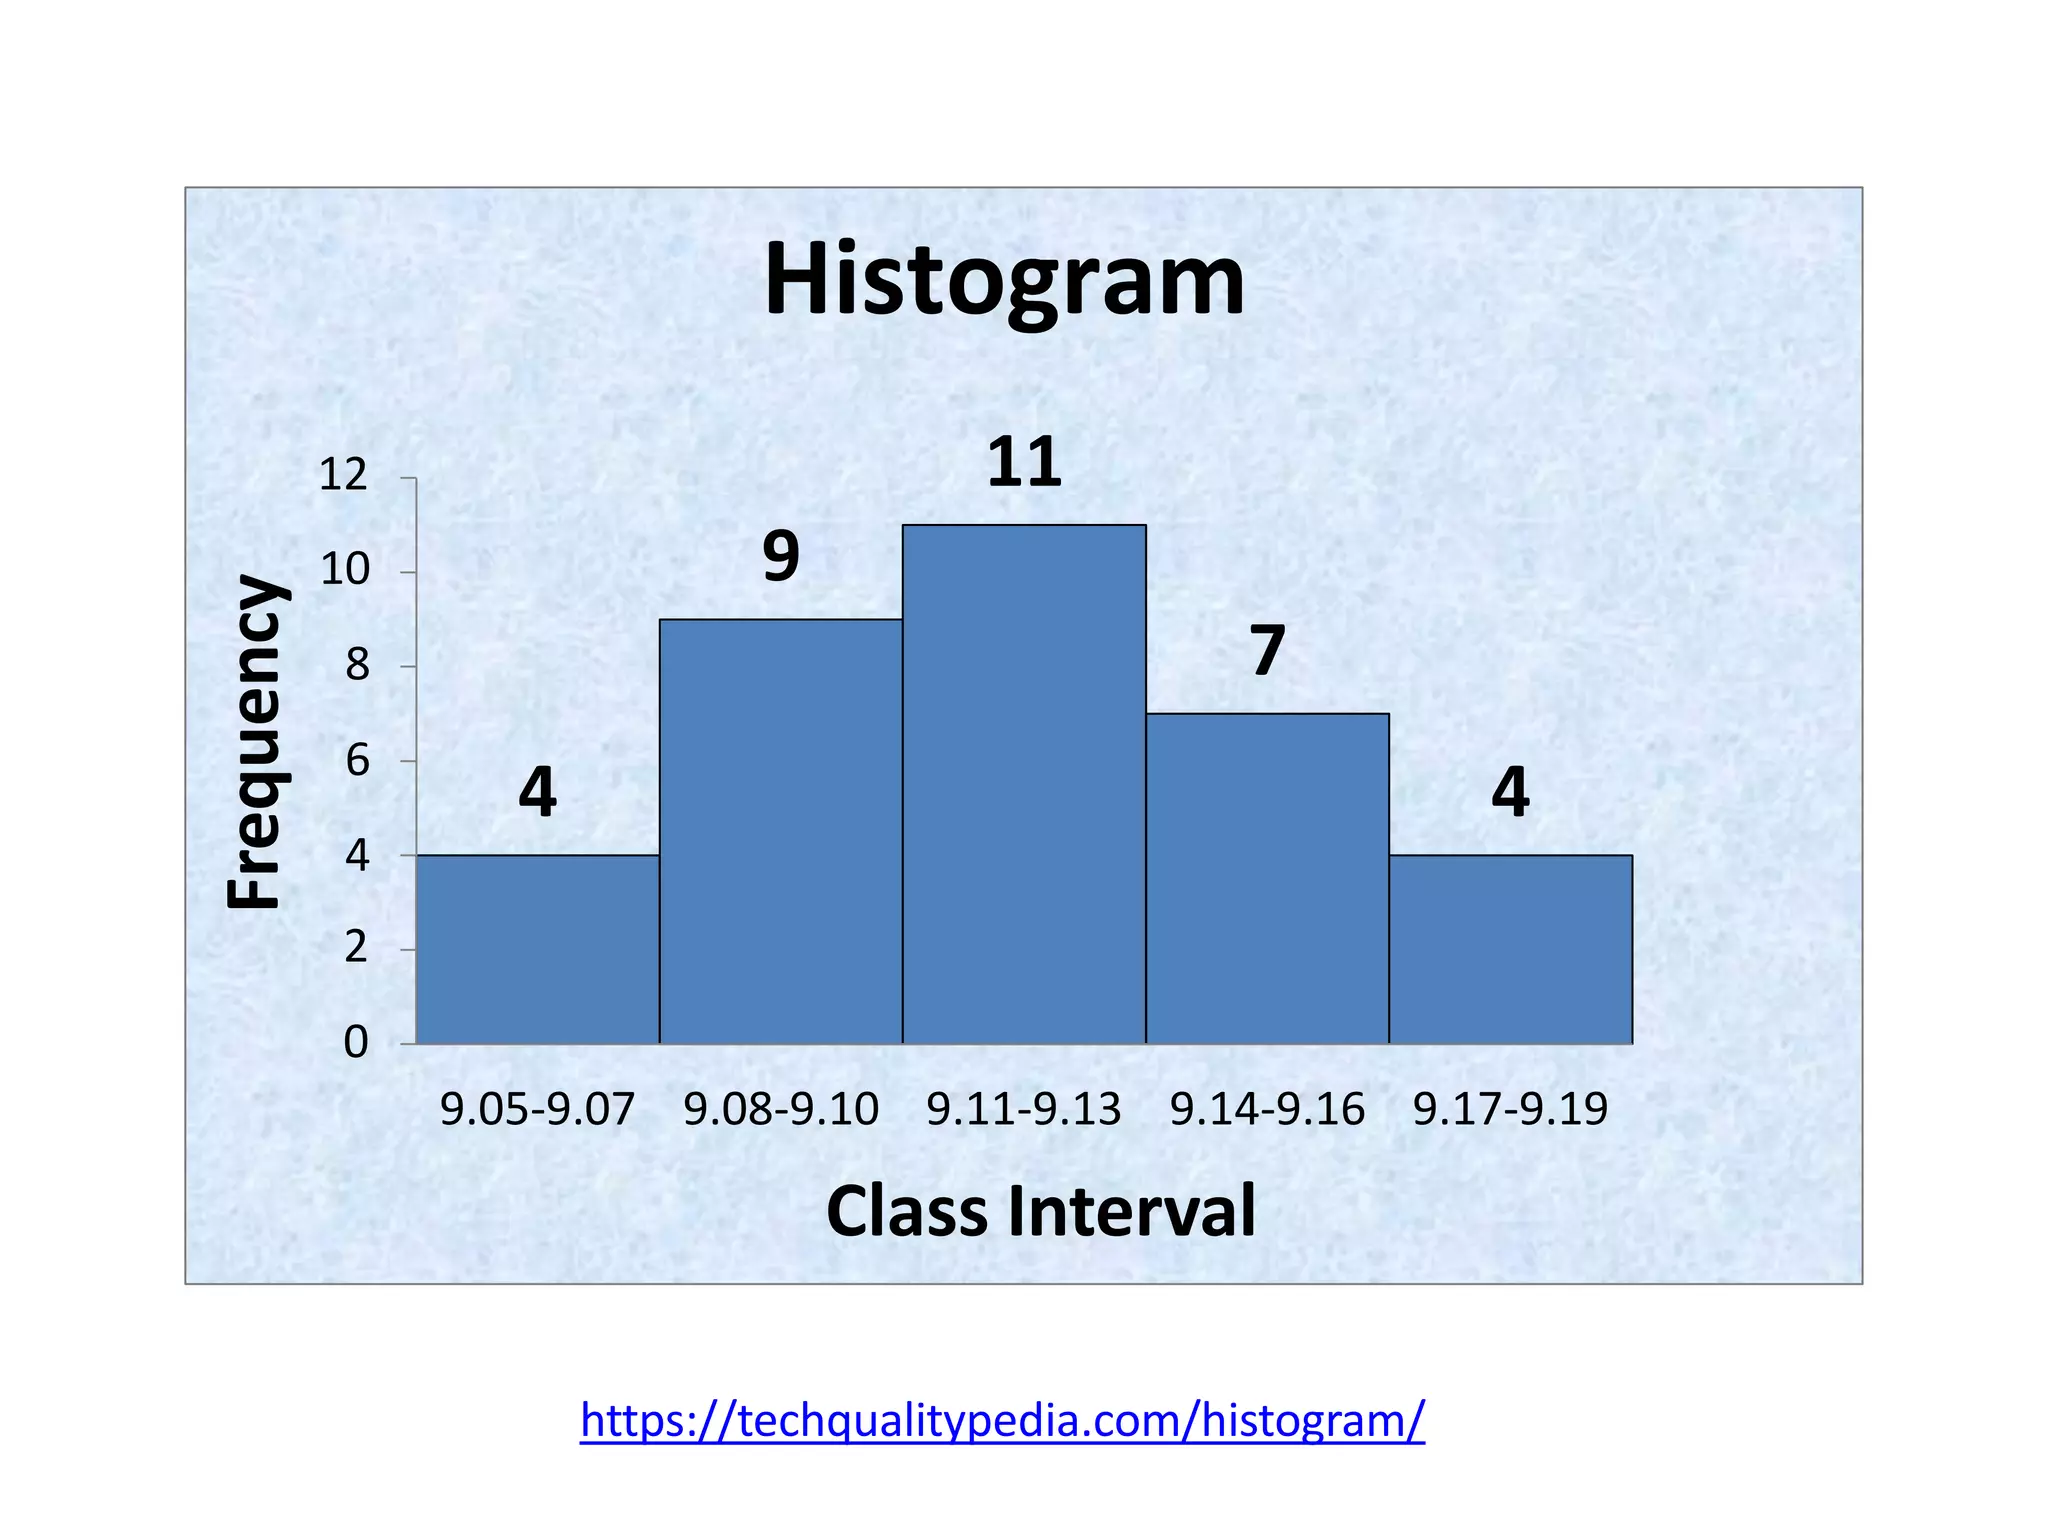
8. Now plot the graph. Place frequencies on vertical axis, and
class intervals on horizontal axis.
9. Interpret the histogram by seeing the shape distribution.
https://techqualitypedia.com/histogram/](https://image.slidesharecdn.com/how-to-make-a-histogram-230422021010-5e36839d/75/How-to-make-a-Histogram-pptx-1-2048.jpg)
![Data sheet
Shaft dia measurements against Specification : 9.0 +0.2
9.13 9.1 9.16 9.05 9.15 9.13 9.08
9.15 9.07 9.09 9.1 9.12 9.06 9.11
9.07 9.15 9.12 9.12 9.17 9.08 9.15
9.09 9.11 9.15 9.17 9.12 9.11 9.17
9.12 9.08 9.17 9.13 9.08 9.09 9.14
Number of measurements or data points ‘n’ = 35
Range ‘R’ = [Max. value - Min. value]
= 9.17 – 9.05 = 0.12
https://techqualitypedia.com/histogram/](https://image.slidesharecdn.com/how-to-make-a-histogram-230422021010-5e36839d/75/How-to-make-a-Histogram-pptx-2-2048.jpg)


To construct a histogram: 1. Count the number of data points and determine the data range. 2. Calculate the number of classes and the class width by dividing the range by the number of classes. 3. Prepare a tally sheet by summarizing the data within each class interval. 4. Plot the graph with frequencies on the vertical axis and class intervals on the horizontal axis to visualize the data distribution shape.


