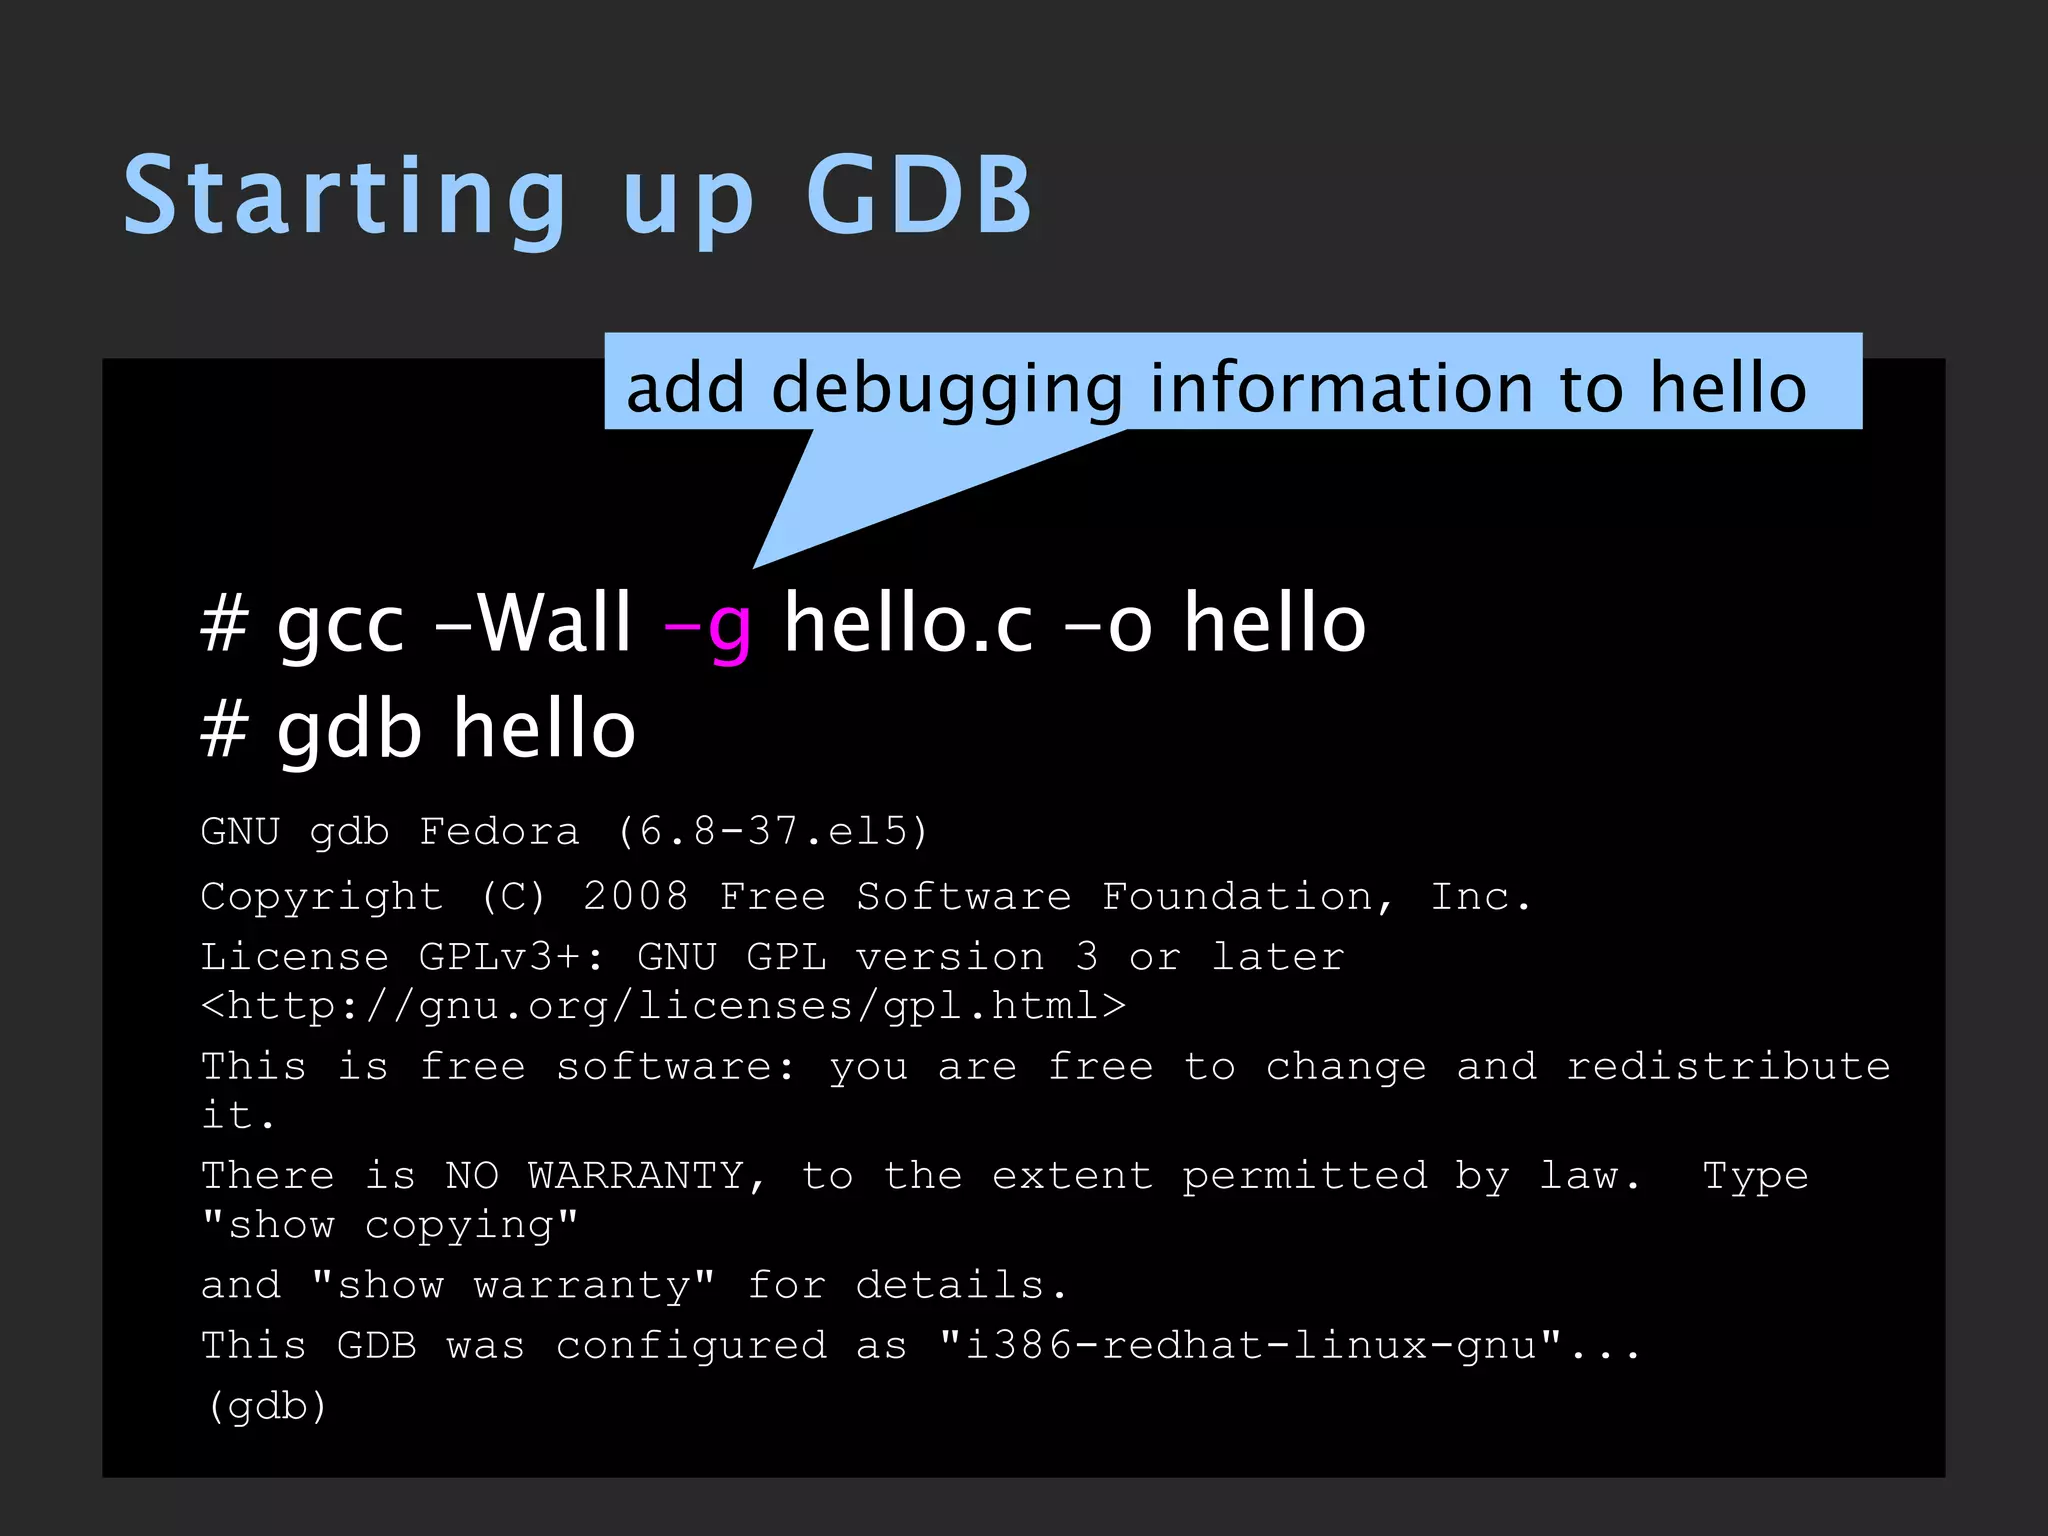
This document provides an introduction to GDB (GNU Debugger) including what it is, why it is useful, basic GDB commands, and examples of using GDB to debug a C program. Key points include:
- GDB is an interactive debugger that allows debugging of C/C++ programs.
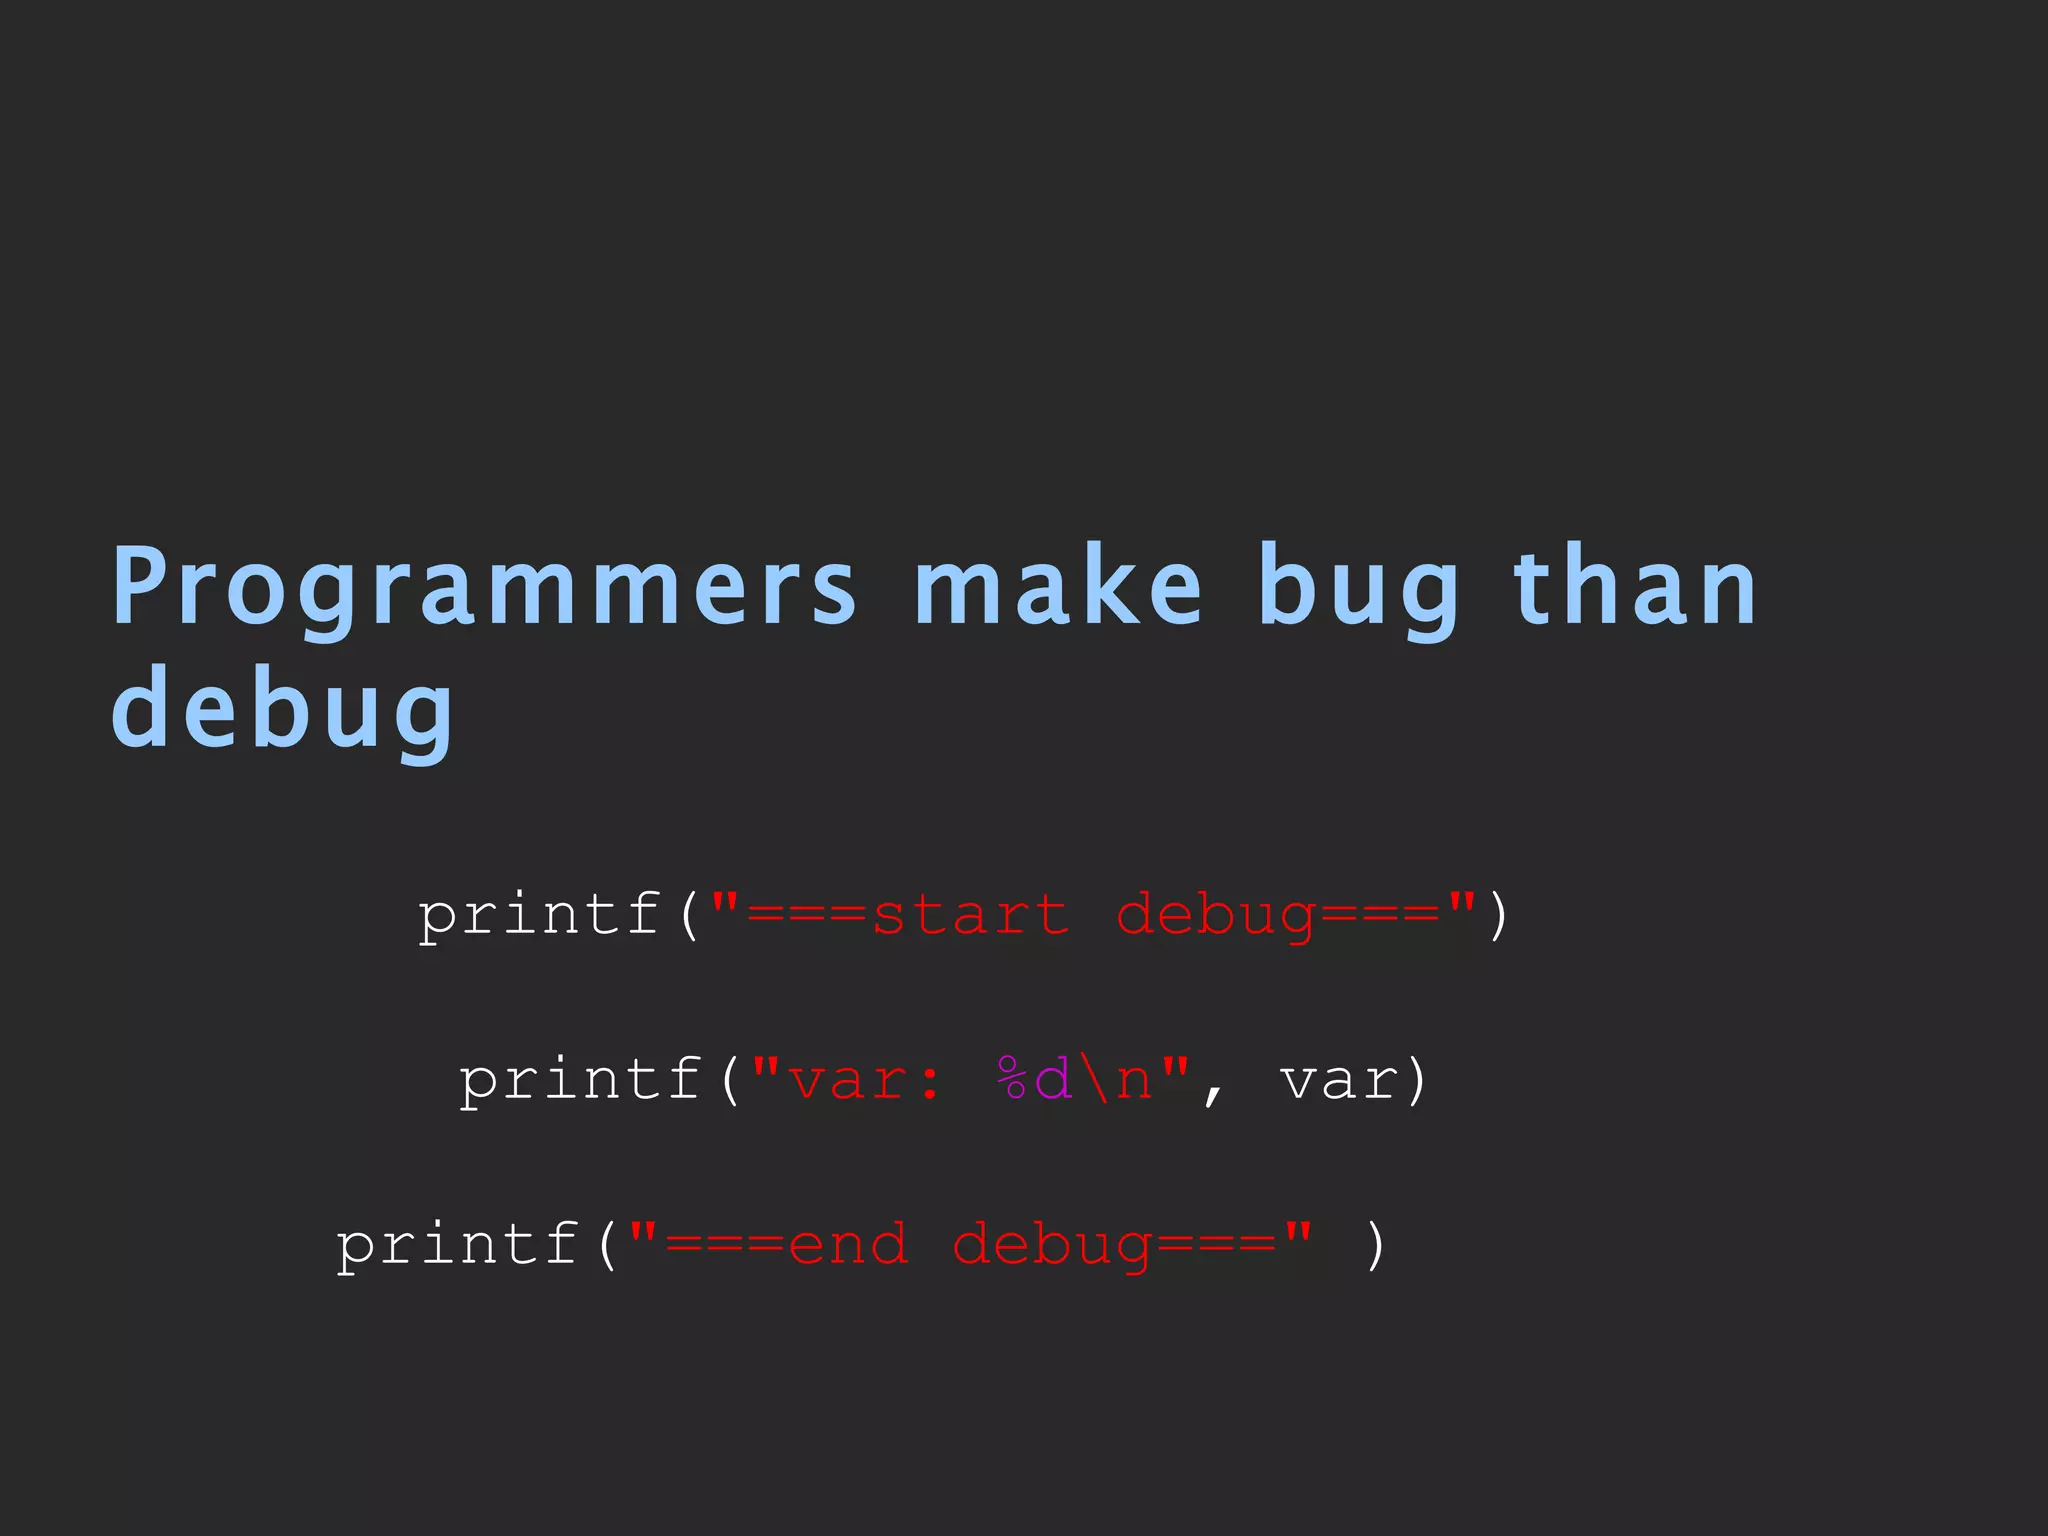
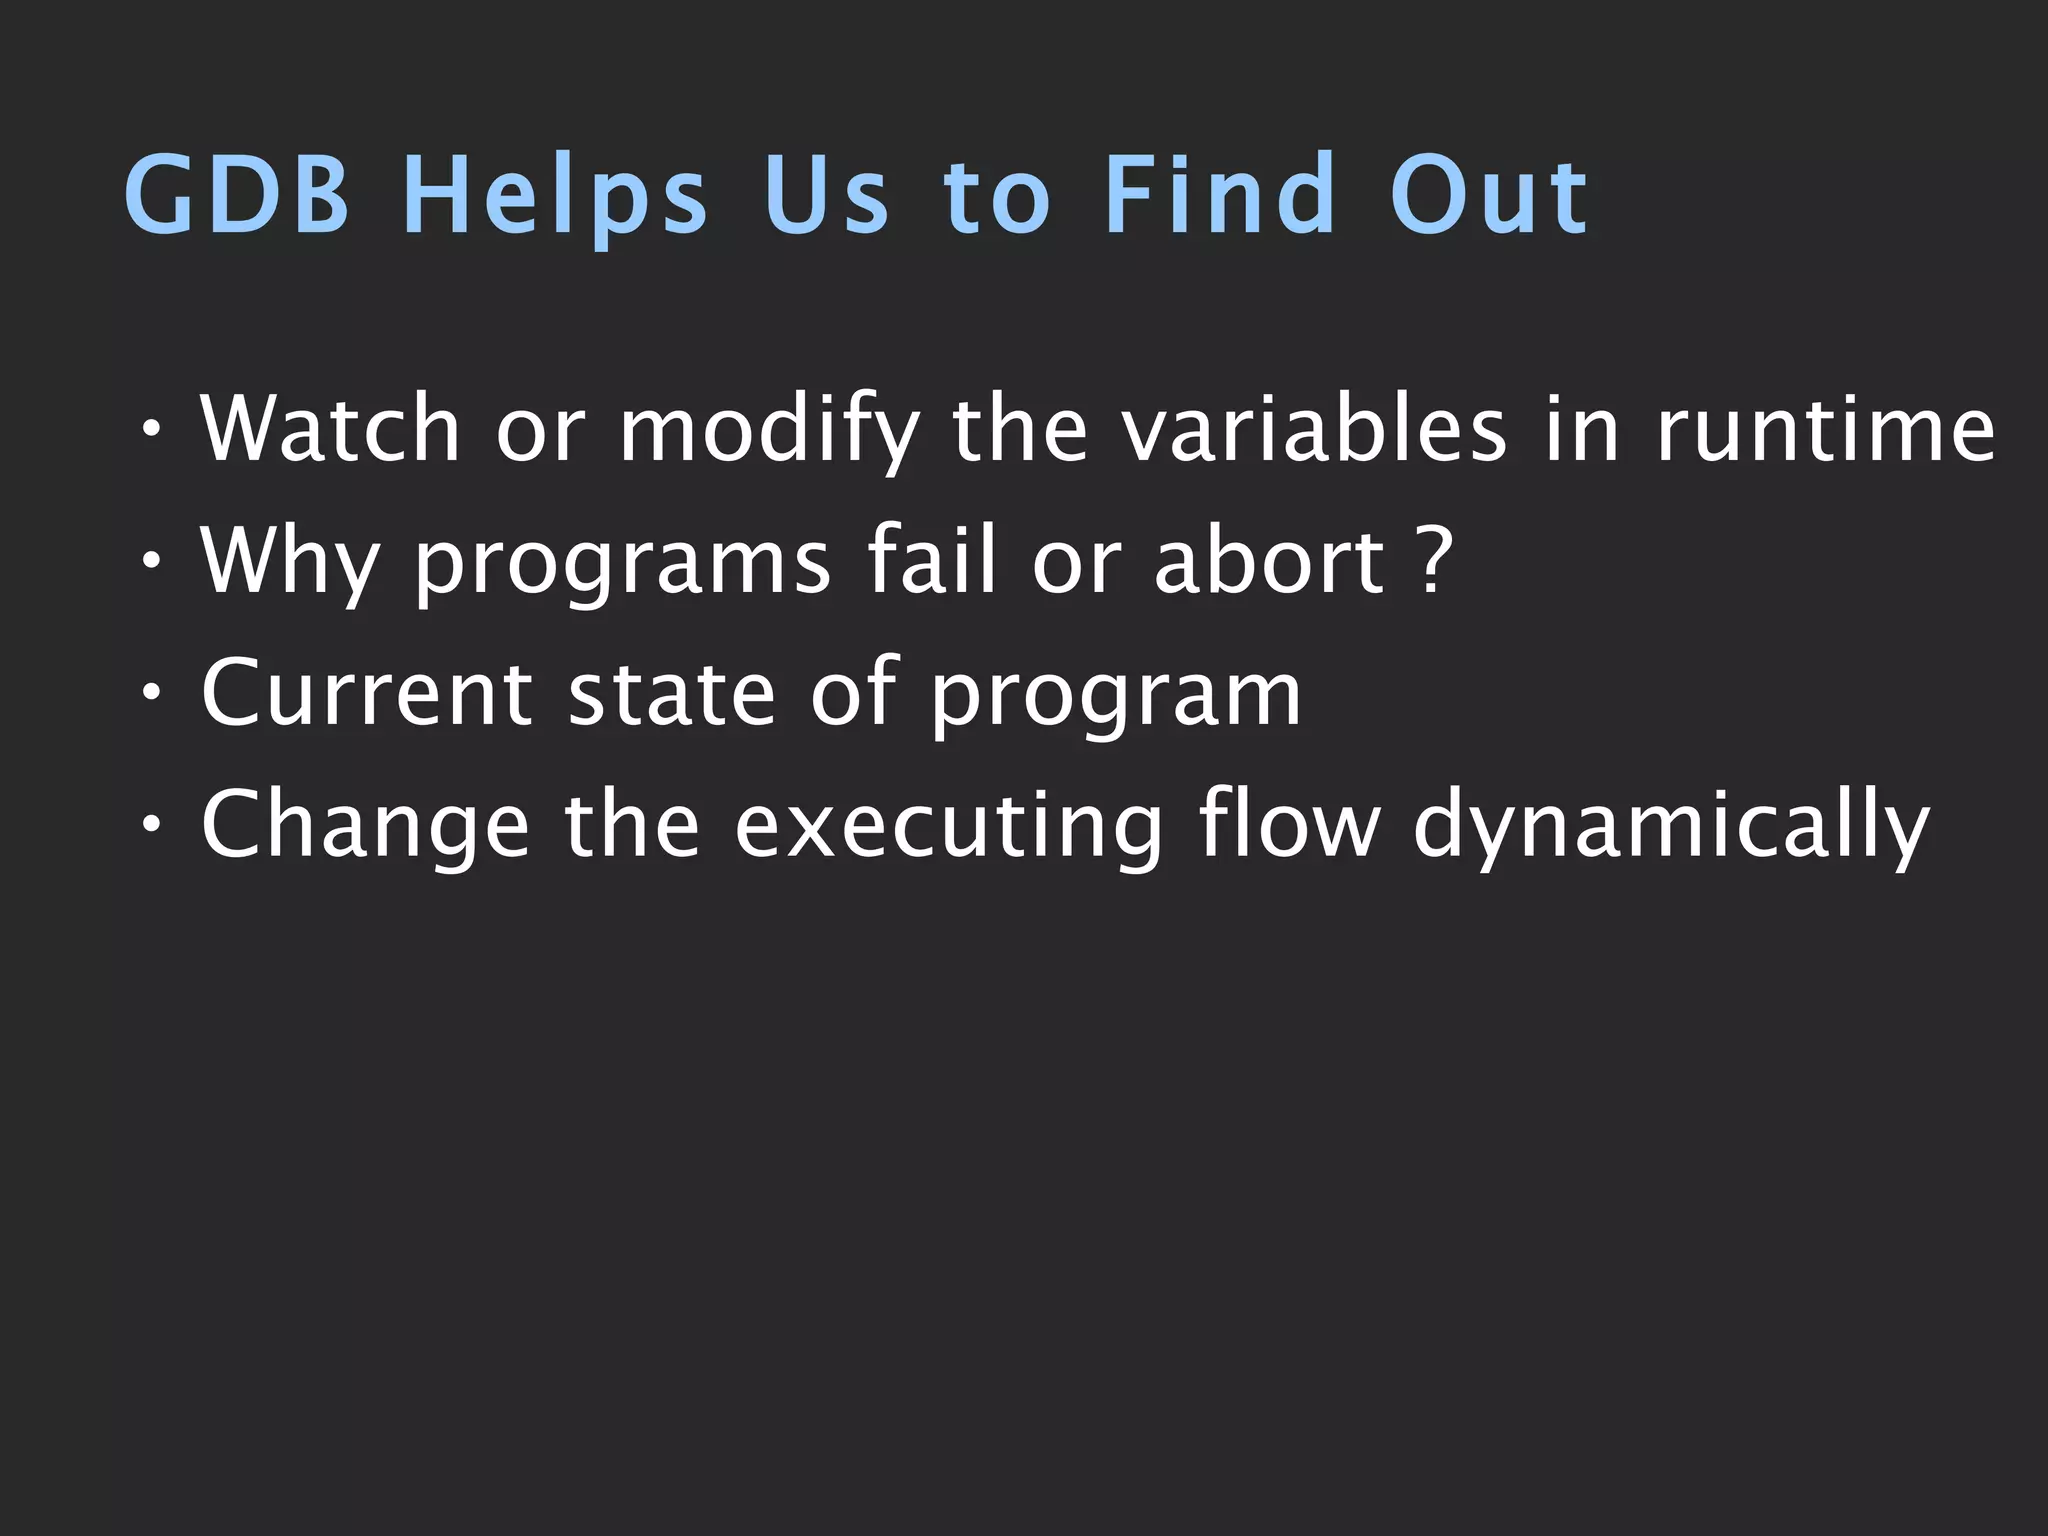
- It helps developers find bugs by allowing them to watch/modify variables, determine why programs fail, and change program flow.
- Basic GDB commands demonstrated include breakpoints, backtraces, printing variables, and stepping through code.
- An example program is debugged using GDB to step through functions and view variable values.

![HelloWorld Example 01 #include <stdio.h> 02 void func( char *pMem) { 03 printf( "- func: %p\n\n " , pMem); 04 } 03 05 const char *szHello = "Hello World"; 06 int main( int argc, char *argv[]) 07 { 08 printf( " \n%s\n\n " , szHello); 09 10 int i; 11 for (i= 0 ; i<argc; i++) { 12 printf( "argv[ %d ] \n " , i); 13 printf( "- main: %s\n " , argv[i]); 14 func(argv[i]); 15 } 16 17 return 0 ; 18 }](https://image.slidesharecdn.com/introductiontogdb-100420110950-phpapp02/75/Introduction-to-gdb-8-2048.jpg)
![Compile hello.c # gcc -Wall hello.c -o hello # ./hello 123 abc Hello World argv[0] - main: ./hello - func: 0xbfbf099b argv[1] - main: 123 - func: 0xbfbf09a3 argv[2] - main: abc - func: 0xbfbf09a7 display all messages](https://image.slidesharecdn.com/introductiontogdb-100420110950-phpapp02/75/Introduction-to-gdb-9-2048.jpg)
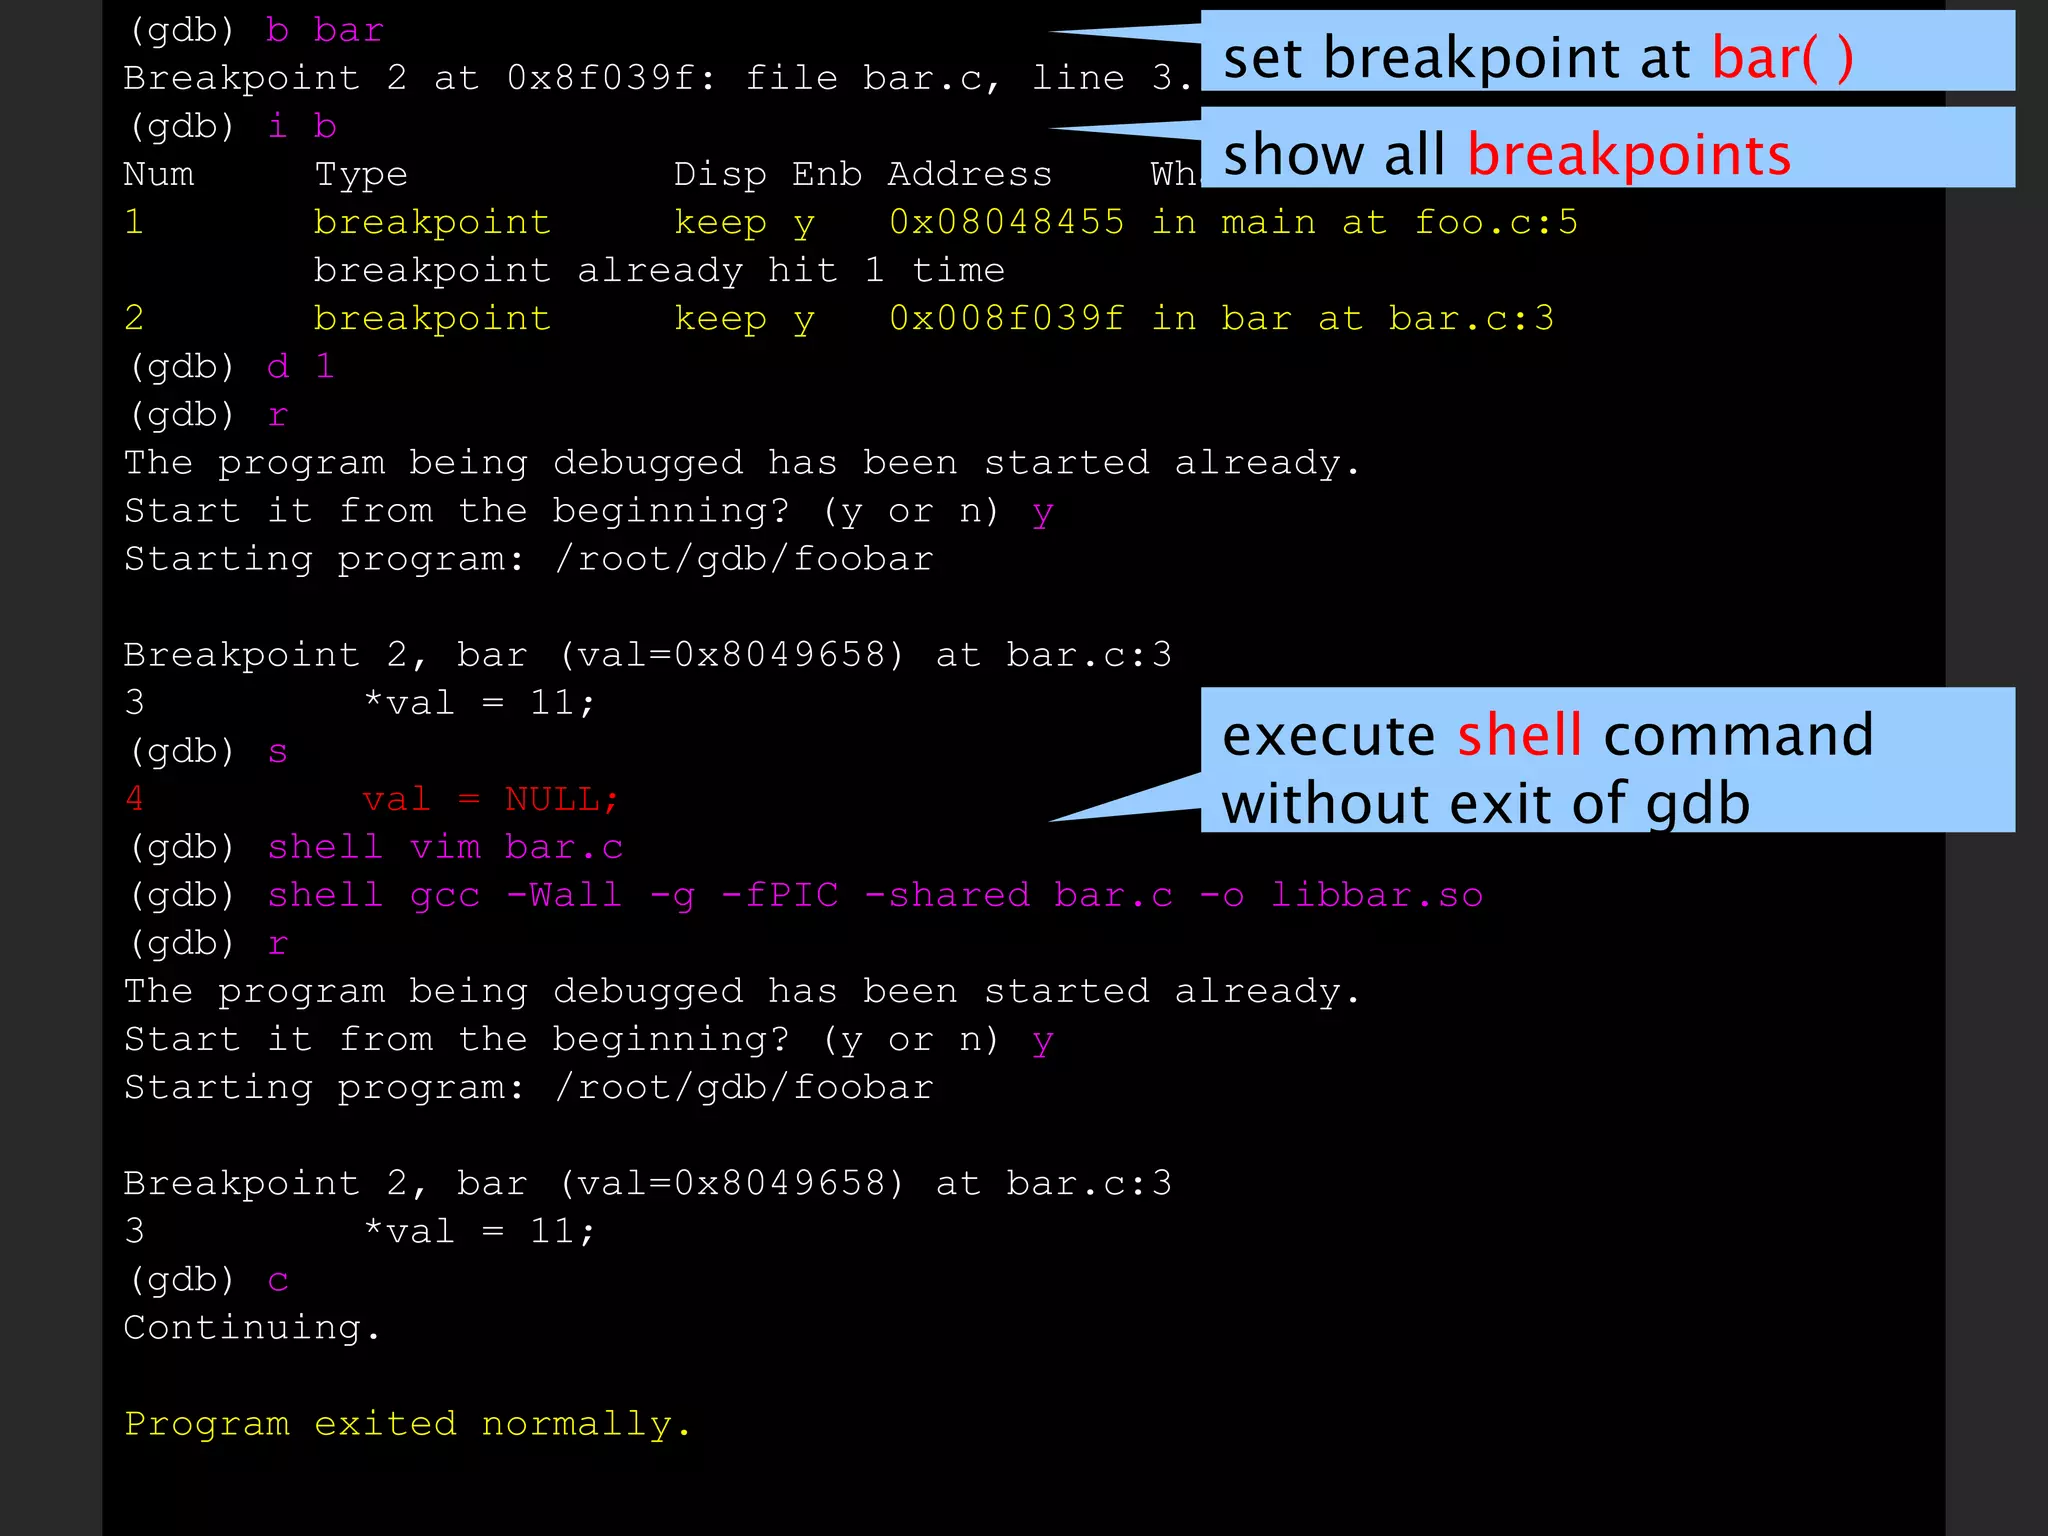
![Basic GDB Commands 顯示目前堆疊 (stack) 狀況 backtrace 顯示 expression 的值 [exp] print 說明 Command 說明 [subcommand] help 即時修改變數的值 [var=val] print 列出程式碼 [line/function] list 單步執行 ( 會進入 function) step 單步執行 ( 不會進入 function) next 執行到被中斷為止 continue 在條件成立時中斷 [condition] break 設定 breakpoint [line/function] break 開始執行 ( 並自動在 main break) [args] start 開始執行 [args] run](https://image.slidesharecdn.com/introductiontogdb-100420110950-phpapp02/75/Introduction-to-gdb-11-2048.jpg)
![This GDB was configured as "i386-redhat-linux-gnu"... (gdb) break main Breakpoint 1 at 0x80483b3: file hello.c, line 9. (gdb) run 123 abc Starting program: /root/gdb/hello Breakpoint 1, main (argc=3, argv=0xbffe6a24) at hello.c:9 9 printf("\n%s\n\n", szHello); (gdb) list 4 } 5 6 char *szHello = "Hello World"; 7 int main(int argc, char *argv[]) 8 { 9 printf("\n%s\n\n", szHello); 10 11 int i; 12 for (i=0; i<argc; i++) { 13 printf("argv[%d]\n", i); (gdb) break 14 Breakpoint 2 at 0x80483e4: file hello.c, line 14. (gdb) continue Continuing. Hello World argv[0] Breakpoint 2, main (argc=3, argv=0xbffe6a24) at hello.c:14 14 printf("- main: %s\n", argv[i]); set breakpoint at main run with @parm 123 abc list code set breakpoint at 14th line continue to breakpoint](https://image.slidesharecdn.com/introductiontogdb-100420110950-phpapp02/75/Introduction-to-gdb-12-2048.jpg)
![(gdb) next - main: /root/gdb/hello 15 func(argv[i]); (gdb) step func (pMem=0xbffe797e "/root/gdb/hello") at hello.c:3 3 printf("- func: %x\n\n", pMem); (gdb) backtrace #0 func ( pMem=0xbffe797e "/root/gdb/hello" ) at hello.c:3 #1 0x08048418 in main (argc=3, argv=0xbffe6a24) at hello.c:15 (gdb) list 1 #include <stdio.h> 2 void func(char *pMem) { 3 printf("- func: %x\n\n", pMem); 4 } 5 6 char *szHello = "Hello World"; 7 int main(int argc, char *argv[]) 8 { 9 printf("\n%s\n\n", szHello); 10 (gdb) print pMem $1 = 0xbffe797e "/root/gdb/hello" (gdb) continue Continuing. - func: 0xbffe797e argv[1] Breakpoint 2, main (argc=3, argv=0xbffe6a24) at hello.c:14 14 printf("- main: %s\n", argv[i]); execute to next statement step into to next statement print backtrace of all stack frames print the value of pMem](https://image.slidesharecdn.com/introductiontogdb-100420110950-phpapp02/75/Introduction-to-gdb-13-2048.jpg)
![(gdb) next - main: 123 15 func(argv[i]); (gdb) step func (pMem=0xbffe798e "123") at hello.c:3 3 printf("- func: %x\n\n", pMem); (gdb) print pMem $2 = 0xbffe798e "123" (gdb) print *pMem $3 = 49 '1' (gdb) continue Continuing. - func: 0xbffe798e argv[2] Breakpoint 2, main (argc=3, argv=0xbffe6a24) at hello.c:14 14 printf("- main: %s\n", argv[i]); (gdb) next - main: abc 15 func(argv[i]); (gdb) next - func: 0xbffe7992 12 for (i=0; i<argc; i++) { (gdb) continue Continuing. Program exited normally. pMem 的型態為 char*, 因此只會印出 1 的 ASCII 碼](https://image.slidesharecdn.com/introductiontogdb-100420110950-phpapp02/75/Introduction-to-gdb-14-2048.jpg)
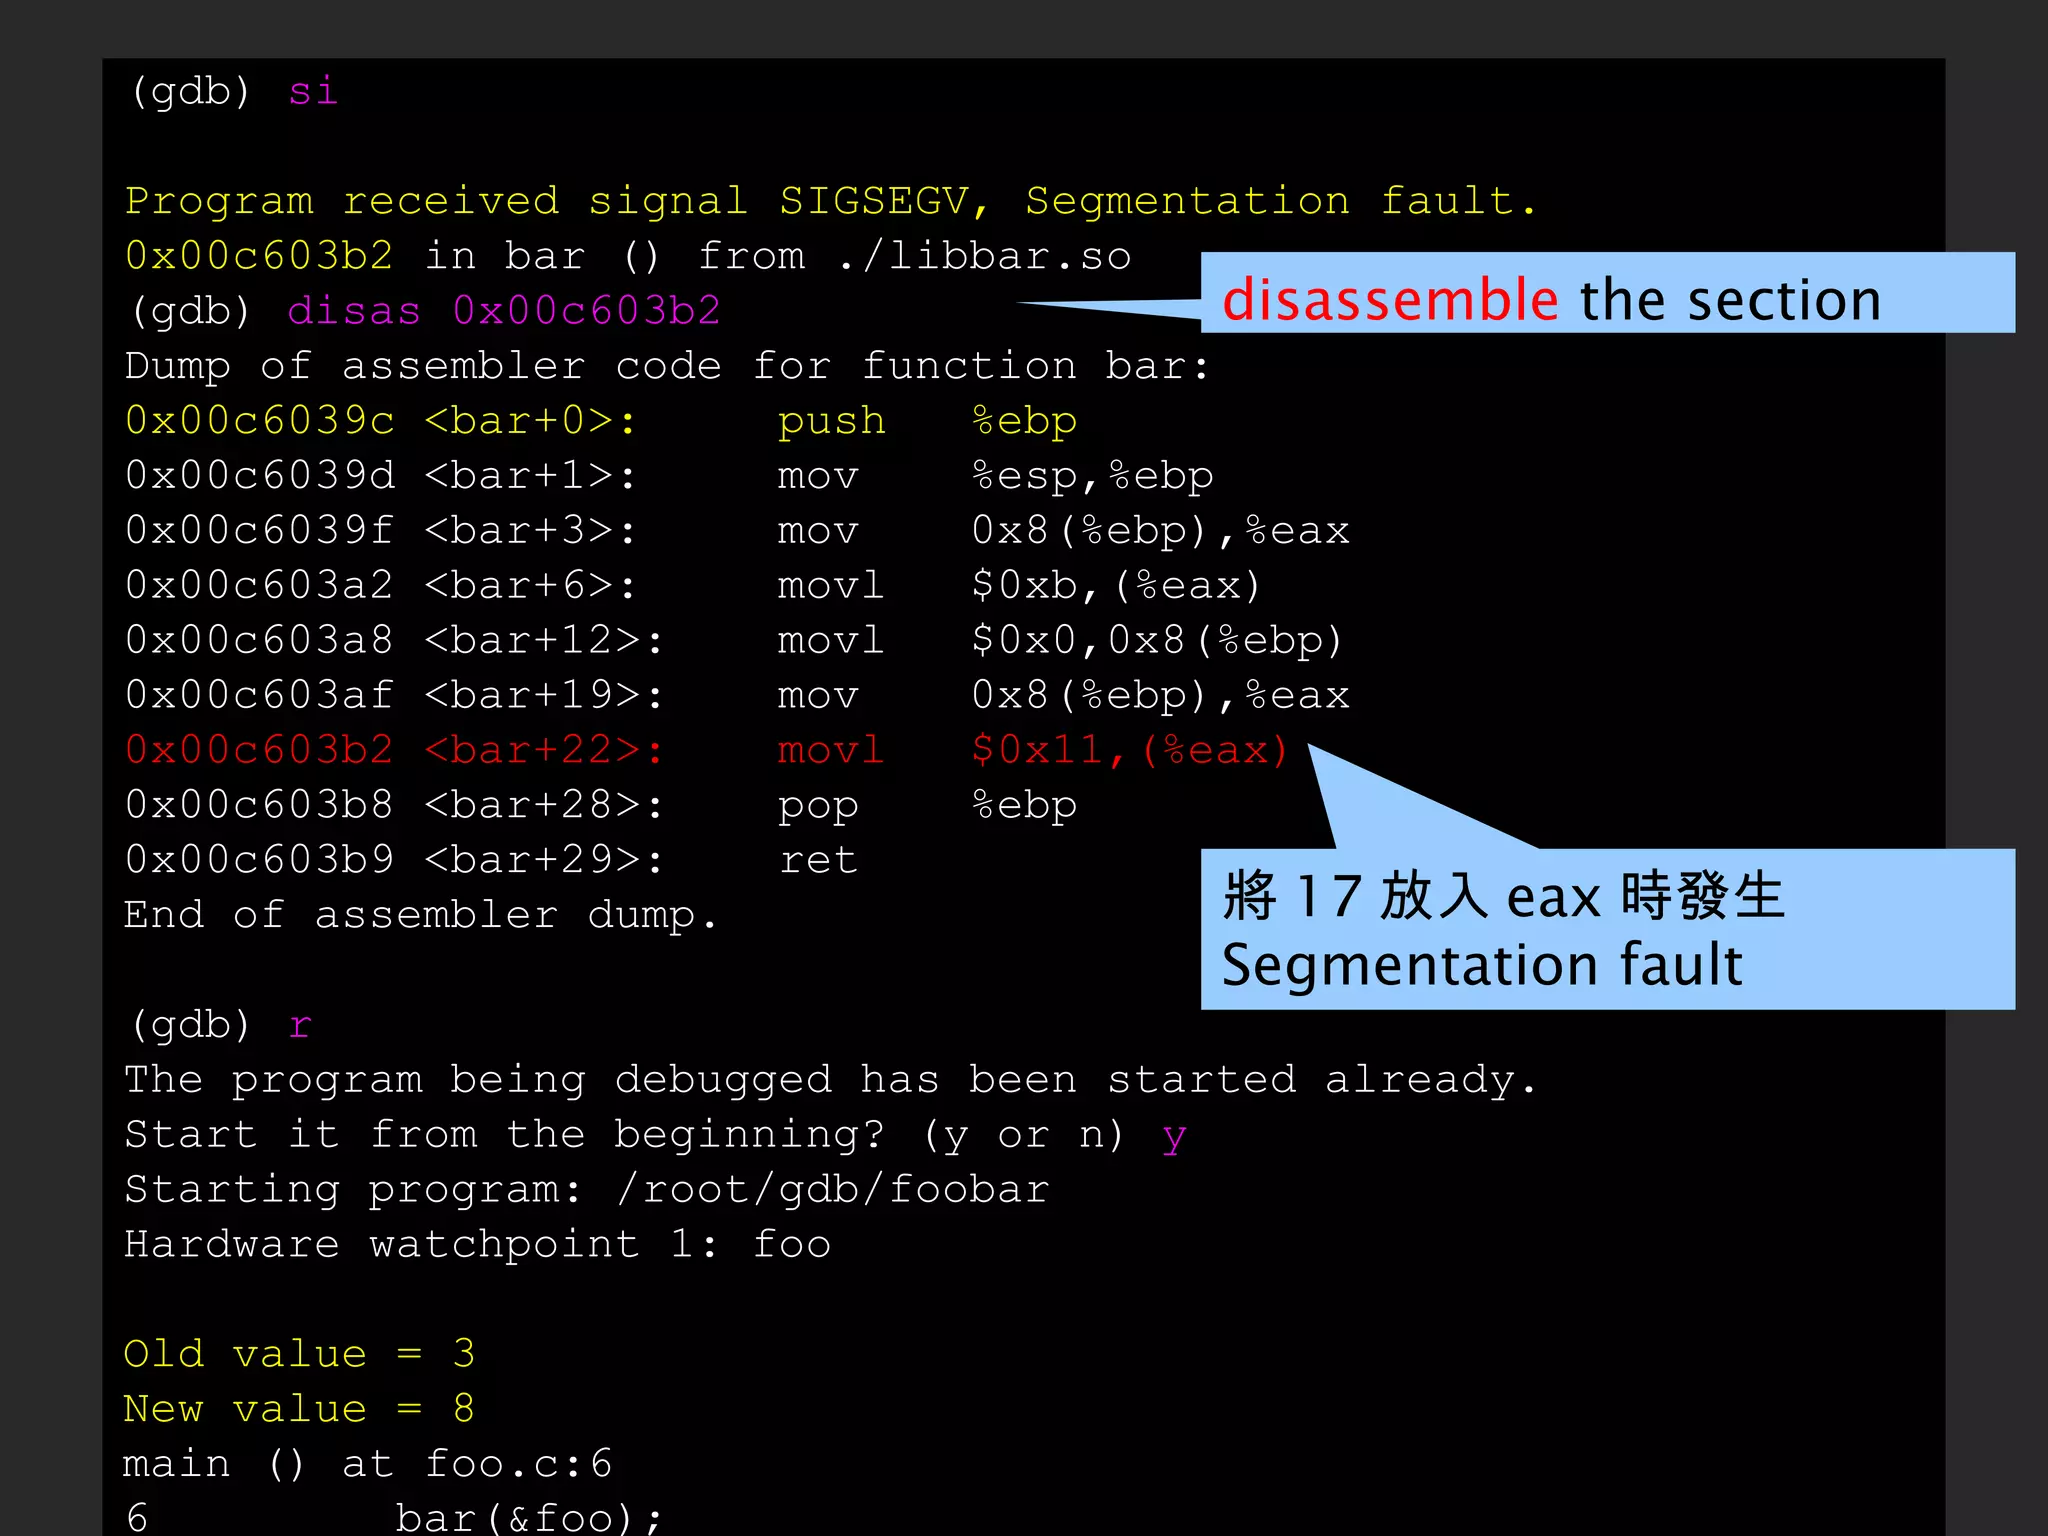
![Breakpoint 單指令執行 ( 會進入 function) stepi 說明 Command 將特定記憶體位址區段做反組譯 [addr] disassemble 單指令執行 ( 不會進入 function) nexti 刪除 breakpoint( 編號 ) [n] delete 當 expression 變動時 break [exp] watch](https://image.slidesharecdn.com/introductiontogdb-100420110950-phpapp02/75/Introduction-to-gdb-26-2048.jpg)
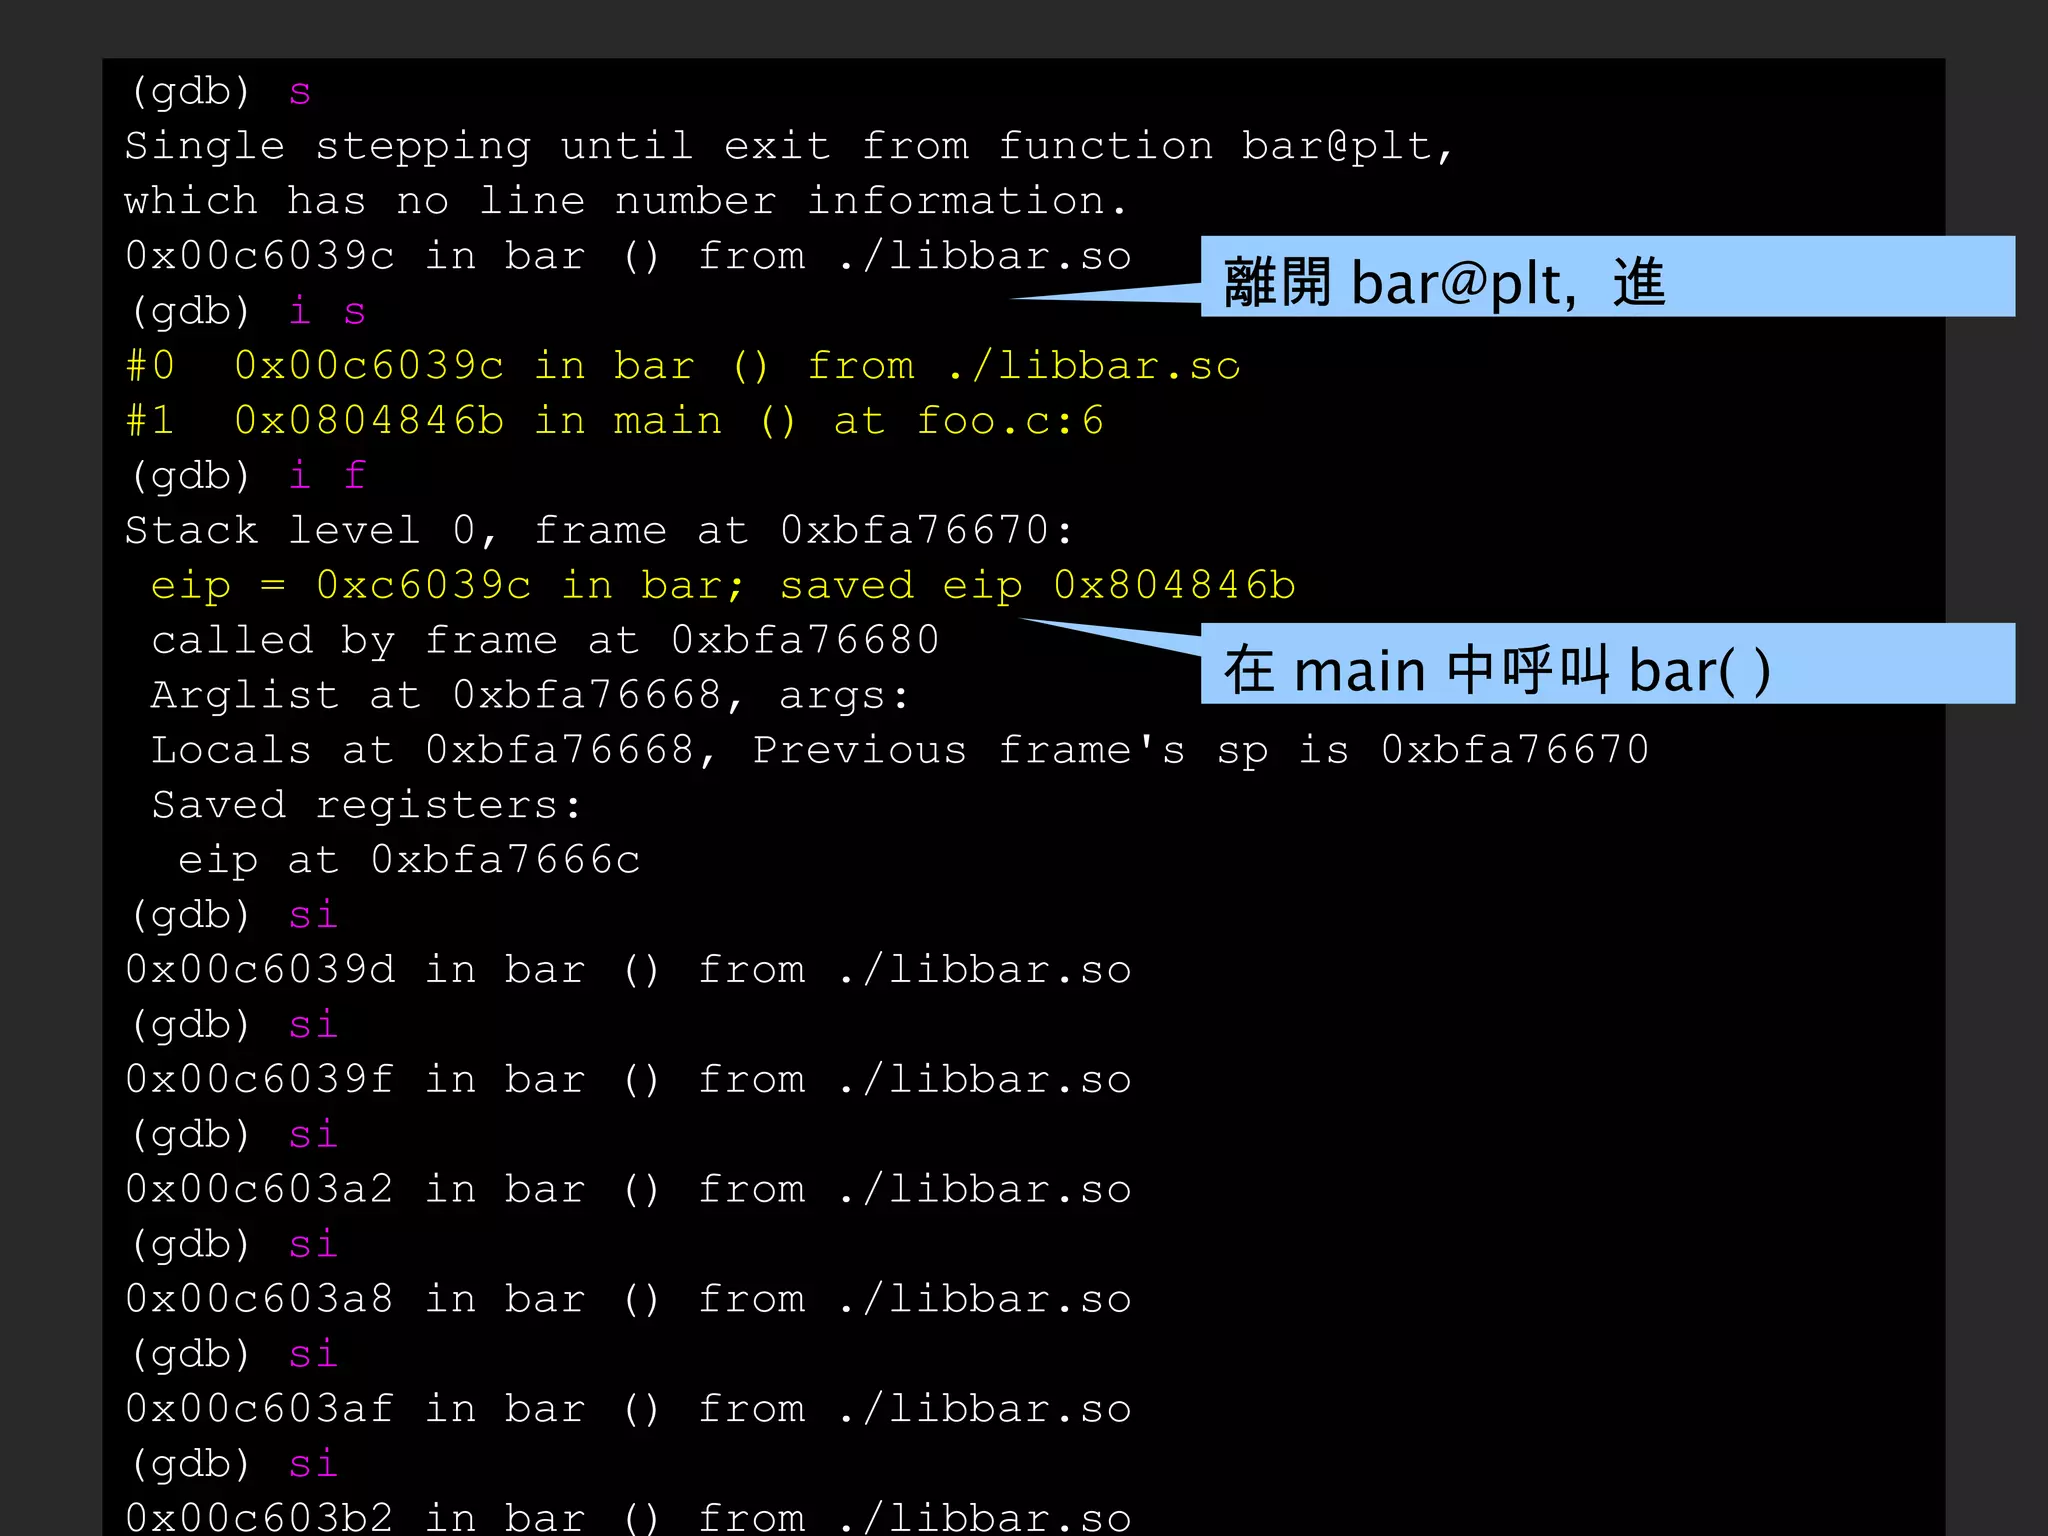
![(gdb) wa foo Hardware watchpoint 1: foo (gdb) r Starting program: /root/gdb/foobar Hardware watchpoint 1: foo Old value = 3 New value = 8 main () at foo.c:6 6 bar(&foo); (gdb) si 0x08048466 6 bar(&foo); (gdb) si 0x08048340 in bar@plt () (gdb) i s #0 0x08048340 in bar@plt () #1 0x0804846b in main () at foo.c:6 (gdb) i f Stack level 0, frame at 0xbfa76670: eip = 0x8048340 in bar@plt; saved eip 0x804846b called by frame at 0xbfa76680 Arglist at 0xbfa76668, args: Locals at 0xbfa76668, Previous frame's sp is 0xbfa76670 Saved registers: eip at 0xbfa7666c set watchpoint to foo 當 foo 改變時 , 將自動顯示 step one instruction exactly show stack frame info 在 main 中呼叫 [email_address]](https://image.slidesharecdn.com/introductiontogdb-100420110950-phpapp02/75/Introduction-to-gdb-27-2048.jpg)
![(gdb) shell objdump -d libbar.so|less (gdb) shell vim libbar.so :%!xxd ... 0000390: d283 c404 5b5d c38b 1c24 c390 5589 e58b ....[]...$..U... 00003a0: 4508 c700 0b00 0000 c745 0800 0000 00 8b E........E...... 00003b0: 4508 c700 1100 0000 5dc3 9090 9090 9090 E.......]....... ... ... 0000390: d283 c404 5b5d c38b 1c24 c390 5589 e58b ....[]...$..U... 00003a0: 4508 c700 0b00 0000 9090 9090 9090 90 8b E........E...... 00003b0: 4508 c700 1100 0000 5dc3 9090 9090 9090 E.......]....... ... :%!xxd -r :wq! (gdb) r The program being debugged has been started already. Start it from the beginning? (y or n) y Starting program: /root/foo/foobar Program exited normally. 只好手動修改 libbar.so 內容](https://image.slidesharecdn.com/introductiontogdb-100420110950-phpapp02/75/Introduction-to-gdb-31-2048.jpg)