SlideShare a Scribd company logo
1 of 8
Download to read offline
Paper No.
 00446
                                               CORROSION                                                    2000
                                       R E F I N E R Y C H E M I C A L CLEANING:
                                   C R I T E R I A FOR DETERGENT S E L E C T I O N


                                                       Chris Spurrell
                                                 Chevron Products Company
                                                  324 W. El Segundo Blvd.
                                                   El Segundo, CA 90245

                                                       Mialeeka Bibbs
                                                 Chevron Products Company
                                                  324 W. El Segundo Blvd.
                                                   El Segundo, CA 90245


                                                              Abstract

Mechanical equipment in the oil processing industry can operate for years between shutdowns. During
this time there is often a tendency for scale, debris and sludges to form within this equipment. During
the shutdowns these fouling materials have to be removed before mechanical work or even entry can be
allowed. Detergents have been developed to speed the cleaning and decontamination of equipment.
These detergents alone or in combination with other chemicals such as oxidizing agents have reduced
the need for caustic and acid washing of refinery equipment. Detergents, however, can interfere with the
subsequent reprocessing of the oil removed. And they may have adverse effects on the refinery's water
effluent system. Several criteria for detergent selection and field test methods are presented.

                                                            Introduction

Oil processing equipment has long been known to accumulate fouling materials while in operation.
These can range from polymeric sludges, sometimes called coke, to various corrosion derived materials,
such as iron sulfide, and scale forming mineral deposits formed from calcium, magnesium, barium, and
silica among others. There are also components of the crude such as benzene which can permeate the
equipment and must be removed to meet OSHA requirements. And, of course, flammability must be
reduced.

For many years the techniques of caustic washing and acid washing have addressed many of these
concerns. However, the generation of hazardous wastes from high or low pH washes has prompted the
development of detergent cleaners which can remove or mitigate many of the expected foulants without
generating hazardous or "listed" wastes. Further, a careful selection of detergent qualities can provide the


                                                                Copyright
@2000 by NACE International.Requests for permission to publish this manuscript in any form, in part or in whole must be in writing to NACE
International, Conferences Division, P.O. Box 218340, Houston, Texas 77218-8340. The material presented and the views expressed in this
paper are solely those of the author(s) and are not necessarily endorsed by the Association. Printed in U.S.A.
best cleaning during turnarounds while minimizing troublesome reprocessing of the recovered oil and
water solutions.

Many detergent formulations have been offered to the petroleum processing industry as
"environmentally friendly heavy duty degreasers." While noble in word and goal, these terms are hardly
quantifiable. Fairly objective measurements like the Hydrophilic / Lipophilic Balance fail to answer the
necessary questions of cleaning ability and subsequent processing impacts.

In order to arrive at a detergent selection criteria the Chevron E1 Segundo refinery embarked on a series
of tests, mostly field expedients, in order to provide a rational basis for selecting a cleaner to use during
shutdowns.

The main concerns of widespread use of detergent / surfactant materials around the refinery were:

1)   How well does it clean?

2)   How much emulsion will it form in the effluent system?

3)   In contact with other hydrocarbon streams, how much oil and grease will the detergent put into the
     effluent water?

4)   How toxic is the detergent to the microbes in the effluent system's activated sludge plant?

5)   How much foam will be generated in the drains and effluent system, especially in the Induced Air
     Flotation (IAF) systems?

SOAPS TESTED

       JAYNE PRODUCT: JPX, Energy Plus Red, Energy

       W. R. GRAINGER: Ball-o-Solv, Knockdown, Red Eye, Jump Start, Gobble

        CHEMCO: Citrifresh, Synthene, APC

        DIANA INDUSTRIES: HS-1000, EP680AC, Citrus EP680AC

       WEST PENETONE: Citrikleen HD-CH

        UNITED LABORATORIES: Zyme flow

        RAMCO: Pac Attack

        PROCTOR & GAMBLE: Joy

        DOW: Fantastik

        CHEMISOLVE: US 1600

        CA RECYCLING CENTER: D - 99

        HARVEY UNIVERSAL INC.: Harvey's Power Grease & Tar Cutter
We chose these detergents to represent a broad spectrum. While we never investigated the active
materials in these cleaners, their advertising and characteristics indicated that we had examples of citrus
or terpene based cleaners, enzyme-based cleaners as well as commercially available household cleaning
formulations.


CLEANING ABILITY TEST

In order to rank the various soaps cleaning ability we coated thin carbon steel strips (corrosion coupons)
with residuum (from SJV crude) and then exposed the treated strips to a 160 Deg. F stirred water
solution which contained 10% of the various soaps. The residuum percent removal (by weight) was then
recorded. Only the terpene based cleaners were effective under these conditions (See Figure 1). These
cleaners were then tested at 5% and 1%. Only Q and C retained their effectiveness at 5% (See Figure 2).
None of the cleaners in this test were effective at 1%.

EFFLUENT IMPACT TESTS

In order to evaluate the impact on Refinery effluent systems and potential environmental impact we
measured the soaps foaming tendency, emulsion forming tendency, Oil and Grease contribution in the
presence of hydrocarbon, and toxicity towards Refinery activated sludge bio organisms.

FOAM TEST
For a foam test a 100 mLs graduated cylinder was filled with 90 mLs of tap water, 2 mLs of diesel fuel,
and 0.9 mL of soap. The cylinder with the solution was stoppered and shaken vigorously ten times. The
solution was allowed to settle for 10 minutes before measurements were taken. Foam ranged from 0 to
35 mL (See Figure 3).

EMULSION TEST
For an emulsion test the emulsion thickness was measured after the above-mentioned test. The chemical
cleaners exhibited emulsion ranges from 2 to 3 mL (See Figure 4). The majority of cleaners had an
emulsion band of 2 mL, which was equal to the blank, and the initial amount of diesel used.

OIL & GREASE TEST
After the above visual measurements were taken we transferred the test solutions to a 4 oz sample bottle
which was left undisturbed for one hour. A one mL sample was taken from the middle of the bottle and
tested for Oil and Grease content. The test used consisted of a Freon extraction followed by an infrared
absorbance using the Foxboro Oil and Grease analyzer. The test displayed Oil and Grease values ranging
from 1000 to 6000 PPM (See Figure 5).

TOXICITY TEST
The toxicity test used was developed at the E1 Segundo Refinery to test the toxicity of Refinery
chemicals towards their activated sludge. This test is not believed, or intended, to correlate with
traditional effluent toxicity tests which are performed on higher organisms (e.g.. Daphnia, Rainbow
Trout, etc.) Rather, this test is designed to use Refinery acclimated bio organisms in order to evaluate a
given chemical's potential to cause an Effluent Treatment Plant upset.

The toxicity test is based on respirometry wherein a bioculture is sealed in a flask along with nutrients,
test chemical, and an oxidation / reduction potential indicator. The Redox indicator changes color (blue
to pink to clear) with the microorganisms' consumption of the oxygen. The test flask oxygen uptake is
then compared to that of a blank. Toxicity or inhibition is measured by the additional time taken by the
organisms to consume oxygen compared to the blank.

We used two different concentrations 1,000 PPM and 10,000 PPM for the chemical dosage.

The toxicity test was based on a scale of 0 to 6 with zero being best (See Figure 6).

pH
The pH of 1.0-% soap solutions is shown in Figure 7.

E V A L U A T I O N SCOPE LIMITATIONS
In this study, while we performed tests on a variety of cleaners, we focused only on those cleaners,
which can truly function as "heavy duty degreasers." As a result there is environmental impact
information but no cleaning performance information on products, which may be effective as general
purpose cleaning agents. Another aspect, which was not addressed, was the ability of the cleaners to
reduce LEL and benzene. We have field experience here going back several years that the terpene based
cleaners are effective at removing benzene when added during a steam out or water wash. Likewise
other cleaners have been shown to remove benzene even though their effectiveness on heavy oils is poor
by comparison.

CONCLUSION
We were able to find quantifiable differences in the cleaners tested. These differences, which relate to
both the cleaning effectiveness and environmental impact, can be used to select the best detergent for
and oil processing facility's needs. Because of the differences in foulants, effluent treatment facilities,
disposal and reprocessing options, these tests are best viewed as a point of reference from which an
intelligent detergent selection can be made.
eL E A N I N G AB IL IT Y
        3.5                                                                      Raling
                                                                           3- Abo,,e 95% at 5
         3                                                                 2 - 60-95% effective ~ 5%
                                                                           1 - 20% or less effedrNeat 5%
        2.5
                                                                           0 - Little effed ci 10%

 C       2
i i m


        1.5

          1

        0.5

         0
               Q   C   J   K   O   R   A       P   H   D   E       F   M     B   G   L    N   I   U   V       S   T


                                                   DE T E R GE NT
                                       FIGURE 1 - Cleaning Ability


                   T op 5 Chemi cal el eaner s
        120%

        100%


        80%
  m


  O
        60%

        40%


        20%

         0%    m       O                   K                   J                     Q                    C


                                                   DE T E R GE NT
                                        FIGURE 2 - Top Cleaners
AVE RAGE FOAM
          35

          30
A
,,,,,4    25

v
 E        20

 E        15

 0        1o
I.I.


                0   ~-   ~   Z    CL   ~     ~    ~   0   --


                                                 DE T E R GE NT
                                           FIGURE 3 - Average Foam


                                 AVE R AGE E MU LS ION
         3.5<
          3

         2,5
v
           2

         1,5

    21
         0.5

           0
                                                                     Z
                                                                     Z
                                                  DET E RGE NT

                                       FIGURE 4 - Average Emulsion
AVE RAGE OIL AND GR E AS E
           7ooo T
           6OOO

ASO00
1~ 4000
v          3000
m

           2OOO

           1000


                                                                                   Z


                                                  DE T E R GE NT
                                    F I G U R E 5 - A v e r a g e Oil a n d G r e a s e


                                     T oxi ci ty T es t
                                                                                                  0 = Best
            6.00                                                                                  6 = Worst


            5.00

            4,00
    I1•
    ,.~     3.00
    | m


     O
    iniB
            2.00
     X
     0
    I~      1,00

            0.00
                    R   E   B   I    A      F     P     D      N     L     G      C       O   H   Q     M   J   K

                                                   DE T E R GE NT
                                           FIGURE 6 - Toxicity Test
pH
       11.5
        11
       10.5
        10
~j:     9.5
Q..,     9
        8.5
         8
        7.5
         7
              S   M   H   V   J   Q   T   D   C   B   O   I   N   L   A   P   R   K   F   G   E

                                          DE T E R GE NT
                                          FIGURE 7 - pH

More Related Content

Viewers also liked

Lessons Of The Streets Hit Home For Attorney Ems.Gmnews.Com Edison Metuc
Lessons Of The Streets Hit Home For Attorney   Ems.Gmnews.Com   Edison MetucLessons Of The Streets Hit Home For Attorney   Ems.Gmnews.Com   Edison Metuc
Lessons Of The Streets Hit Home For Attorney Ems.Gmnews.Com Edison Metucmialeeka
 
Mia Williams 2012 Transactions Resume
Mia Williams 2012 Transactions ResumeMia Williams 2012 Transactions Resume
Mia Williams 2012 Transactions Resumemialeeka
 
Hype vs. Reality: The AI Explainer
Hype vs. Reality: The AI ExplainerHype vs. Reality: The AI Explainer
Hype vs. Reality: The AI ExplainerLuminary Labs
 
Study: The Future of VR, AR and Self-Driving Cars
Study: The Future of VR, AR and Self-Driving CarsStudy: The Future of VR, AR and Self-Driving Cars
Study: The Future of VR, AR and Self-Driving CarsLinkedIn
 

Viewers also liked (6)

Lessons Of The Streets Hit Home For Attorney Ems.Gmnews.Com Edison Metuc
Lessons Of The Streets Hit Home For Attorney   Ems.Gmnews.Com   Edison MetucLessons Of The Streets Hit Home For Attorney   Ems.Gmnews.Com   Edison Metuc
Lessons Of The Streets Hit Home For Attorney Ems.Gmnews.Com Edison Metuc
 
Lessons Of The Streets Hit Home For Attorney Ems.Gmnews.Com Edison Metuc
Lessons Of The Streets Hit Home For Attorney   Ems.Gmnews.Com   Edison MetucLessons Of The Streets Hit Home For Attorney   Ems.Gmnews.Com   Edison Metuc
Lessons Of The Streets Hit Home For Attorney Ems.Gmnews.Com Edison Metuc
 
Mia Williams 2012 Transactions Resume
Mia Williams 2012 Transactions ResumeMia Williams 2012 Transactions Resume
Mia Williams 2012 Transactions Resume
 
Crude Oil Refining
Crude Oil RefiningCrude Oil Refining
Crude Oil Refining
 
Hype vs. Reality: The AI Explainer
Hype vs. Reality: The AI ExplainerHype vs. Reality: The AI Explainer
Hype vs. Reality: The AI Explainer
 
Study: The Future of VR, AR and Self-Driving Cars
Study: The Future of VR, AR and Self-Driving CarsStudy: The Future of VR, AR and Self-Driving Cars
Study: The Future of VR, AR and Self-Driving Cars
 

Similar to NACE Refinery Chemical Cleaning Study

COMPARATIVE STUDY OF ADSORPTION PROPERTIES OF HUMAN HAIR AND ACTIVATED CARBON...
COMPARATIVE STUDY OF ADSORPTION PROPERTIES OF HUMAN HAIR AND ACTIVATED CARBON...COMPARATIVE STUDY OF ADSORPTION PROPERTIES OF HUMAN HAIR AND ACTIVATED CARBON...
COMPARATIVE STUDY OF ADSORPTION PROPERTIES OF HUMAN HAIR AND ACTIVATED CARBON...IRJET Journal
 
Ecofriendly Stain Remover Based on Sugar Based Polymeric Surfactants
Ecofriendly Stain Remover Based on Sugar Based Polymeric SurfactantsEcofriendly Stain Remover Based on Sugar Based Polymeric Surfactants
Ecofriendly Stain Remover Based on Sugar Based Polymeric SurfactantsIRJET Journal
 
Alkyl aryl sulfonate project report
Alkyl aryl sulfonate project reportAlkyl aryl sulfonate project report
Alkyl aryl sulfonate project reportromil kikani
 
Ecofriendly Sugar Polymer based Toilet Cleaners
Ecofriendly Sugar Polymer based Toilet CleanersEcofriendly Sugar Polymer based Toilet Cleaners
Ecofriendly Sugar Polymer based Toilet CleanersIRJET Journal
 
OriginOil Technology Breakthrough Greatly Enhances Membrane Filtration, Enabl...
OriginOil Technology Breakthrough Greatly Enhances Membrane Filtration, Enabl...OriginOil Technology Breakthrough Greatly Enhances Membrane Filtration, Enabl...
OriginOil Technology Breakthrough Greatly Enhances Membrane Filtration, Enabl...tenuoushardware77
 
Oil Clear Client Presentation Maritime
Oil Clear Client Presentation MaritimeOil Clear Client Presentation Maritime
Oil Clear Client Presentation MaritimeGalebagram
 
The power of pH neutral enzyme cleaning EC 660
The power of pH neutral enzyme cleaning  EC 660The power of pH neutral enzyme cleaning  EC 660
The power of pH neutral enzyme cleaning EC 660Jeff Grames
 
The Power of pH Neutral Enzyme Cleaning - EC 660
The Power of pH Neutral Enzyme Cleaning - EC 660The Power of pH Neutral Enzyme Cleaning - EC 660
The Power of pH Neutral Enzyme Cleaning - EC 660Jeff Grames
 
zero effluent discharge system
zero effluent discharge systemzero effluent discharge system
zero effluent discharge systemJhanvi Desai
 
IRJET- A Study on the Impact of Sulfate Free on Huasb Reactor
IRJET- A Study on the Impact of Sulfate Free on Huasb ReactorIRJET- A Study on the Impact of Sulfate Free on Huasb Reactor
IRJET- A Study on the Impact of Sulfate Free on Huasb ReactorIRJET Journal
 
Proven Oilfield Cost Reduction &amp; Environmental Results
Proven Oilfield Cost Reduction &amp; Environmental ResultsProven Oilfield Cost Reduction &amp; Environmental Results
Proven Oilfield Cost Reduction &amp; Environmental ResultsBen Lucas
 
Increasing Varnish Mitigation Performance by Incorporating Customizable ESP M...
Increasing Varnish Mitigation Performance by Incorporating Customizable ESP M...Increasing Varnish Mitigation Performance by Incorporating Customizable ESP M...
Increasing Varnish Mitigation Performance by Incorporating Customizable ESP M...Jatin Mehta
 
Recycle wastewater oilfield - agriculture - 1-16-16 ar
Recycle wastewater   oilfield - agriculture -   1-16-16 arRecycle wastewater   oilfield - agriculture -   1-16-16 ar
Recycle wastewater oilfield - agriculture - 1-16-16 arEner-Corr Solutions, LLC
 
Report on Effluent Treatment Plant (ETP) Operation and Maintenance of Interst...
Report on Effluent Treatment Plant (ETP) Operation and Maintenance of Interst...Report on Effluent Treatment Plant (ETP) Operation and Maintenance of Interst...
Report on Effluent Treatment Plant (ETP) Operation and Maintenance of Interst...Kowshick Sen
 
Developed method for treatment of industrial wastewater from edible oil indus...
Developed method for treatment of industrial wastewater from edible oil indus...Developed method for treatment of industrial wastewater from edible oil indus...
Developed method for treatment of industrial wastewater from edible oil indus...Medhat Elzahar
 

Similar to NACE Refinery Chemical Cleaning Study (20)

COMPARATIVE STUDY OF ADSORPTION PROPERTIES OF HUMAN HAIR AND ACTIVATED CARBON...
COMPARATIVE STUDY OF ADSORPTION PROPERTIES OF HUMAN HAIR AND ACTIVATED CARBON...COMPARATIVE STUDY OF ADSORPTION PROPERTIES OF HUMAN HAIR AND ACTIVATED CARBON...
COMPARATIVE STUDY OF ADSORPTION PROPERTIES OF HUMAN HAIR AND ACTIVATED CARBON...
 
Ecofriendly Stain Remover Based on Sugar Based Polymeric Surfactants
Ecofriendly Stain Remover Based on Sugar Based Polymeric SurfactantsEcofriendly Stain Remover Based on Sugar Based Polymeric Surfactants
Ecofriendly Stain Remover Based on Sugar Based Polymeric Surfactants
 
Alkyl aryl sulfonate project report
Alkyl aryl sulfonate project reportAlkyl aryl sulfonate project report
Alkyl aryl sulfonate project report
 
Chemical cleaning
Chemical cleaningChemical cleaning
Chemical cleaning
 
Ecofriendly Sugar Polymer based Toilet Cleaners
Ecofriendly Sugar Polymer based Toilet CleanersEcofriendly Sugar Polymer based Toilet Cleaners
Ecofriendly Sugar Polymer based Toilet Cleaners
 
OriginOil Technology Breakthrough Greatly Enhances Membrane Filtration, Enabl...
OriginOil Technology Breakthrough Greatly Enhances Membrane Filtration, Enabl...OriginOil Technology Breakthrough Greatly Enhances Membrane Filtration, Enabl...
OriginOil Technology Breakthrough Greatly Enhances Membrane Filtration, Enabl...
 
Product Overview DHS
Product Overview DHSProduct Overview DHS
Product Overview DHS
 
Cleaning & Disinfecting
Cleaning & DisinfectingCleaning & Disinfecting
Cleaning & Disinfecting
 
Oil Clear Client Presentation Maritime
Oil Clear Client Presentation MaritimeOil Clear Client Presentation Maritime
Oil Clear Client Presentation Maritime
 
The power of pH neutral enzyme cleaning EC 660
The power of pH neutral enzyme cleaning  EC 660The power of pH neutral enzyme cleaning  EC 660
The power of pH neutral enzyme cleaning EC 660
 
The Power of pH Neutral Enzyme Cleaning - EC 660
The Power of pH Neutral Enzyme Cleaning - EC 660The Power of pH Neutral Enzyme Cleaning - EC 660
The Power of pH Neutral Enzyme Cleaning - EC 660
 
Product Brochure
Product BrochureProduct Brochure
Product Brochure
 
zero effluent discharge system
zero effluent discharge systemzero effluent discharge system
zero effluent discharge system
 
Catalyst brochure
Catalyst brochureCatalyst brochure
Catalyst brochure
 
IRJET- A Study on the Impact of Sulfate Free on Huasb Reactor
IRJET- A Study on the Impact of Sulfate Free on Huasb ReactorIRJET- A Study on the Impact of Sulfate Free on Huasb Reactor
IRJET- A Study on the Impact of Sulfate Free on Huasb Reactor
 
Proven Oilfield Cost Reduction &amp; Environmental Results
Proven Oilfield Cost Reduction &amp; Environmental ResultsProven Oilfield Cost Reduction &amp; Environmental Results
Proven Oilfield Cost Reduction &amp; Environmental Results
 
Increasing Varnish Mitigation Performance by Incorporating Customizable ESP M...
Increasing Varnish Mitigation Performance by Incorporating Customizable ESP M...Increasing Varnish Mitigation Performance by Incorporating Customizable ESP M...
Increasing Varnish Mitigation Performance by Incorporating Customizable ESP M...
 
Recycle wastewater oilfield - agriculture - 1-16-16 ar
Recycle wastewater   oilfield - agriculture -   1-16-16 arRecycle wastewater   oilfield - agriculture -   1-16-16 ar
Recycle wastewater oilfield - agriculture - 1-16-16 ar
 
Report on Effluent Treatment Plant (ETP) Operation and Maintenance of Interst...
Report on Effluent Treatment Plant (ETP) Operation and Maintenance of Interst...Report on Effluent Treatment Plant (ETP) Operation and Maintenance of Interst...
Report on Effluent Treatment Plant (ETP) Operation and Maintenance of Interst...
 
Developed method for treatment of industrial wastewater from edible oil indus...
Developed method for treatment of industrial wastewater from edible oil indus...Developed method for treatment of industrial wastewater from edible oil indus...
Developed method for treatment of industrial wastewater from edible oil indus...
 

NACE Refinery Chemical Cleaning Study

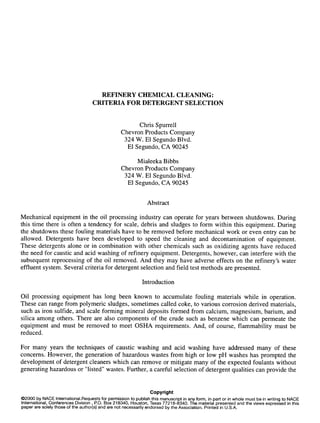
  • 1. Paper No. 00446 CORROSION 2000 R E F I N E R Y C H E M I C A L CLEANING: C R I T E R I A FOR DETERGENT S E L E C T I O N Chris Spurrell Chevron Products Company 324 W. El Segundo Blvd. El Segundo, CA 90245 Mialeeka Bibbs Chevron Products Company 324 W. El Segundo Blvd. El Segundo, CA 90245 Abstract Mechanical equipment in the oil processing industry can operate for years between shutdowns. During this time there is often a tendency for scale, debris and sludges to form within this equipment. During the shutdowns these fouling materials have to be removed before mechanical work or even entry can be allowed. Detergents have been developed to speed the cleaning and decontamination of equipment. These detergents alone or in combination with other chemicals such as oxidizing agents have reduced the need for caustic and acid washing of refinery equipment. Detergents, however, can interfere with the subsequent reprocessing of the oil removed. And they may have adverse effects on the refinery's water effluent system. Several criteria for detergent selection and field test methods are presented. Introduction Oil processing equipment has long been known to accumulate fouling materials while in operation. These can range from polymeric sludges, sometimes called coke, to various corrosion derived materials, such as iron sulfide, and scale forming mineral deposits formed from calcium, magnesium, barium, and silica among others. There are also components of the crude such as benzene which can permeate the equipment and must be removed to meet OSHA requirements. And, of course, flammability must be reduced. For many years the techniques of caustic washing and acid washing have addressed many of these concerns. However, the generation of hazardous wastes from high or low pH washes has prompted the development of detergent cleaners which can remove or mitigate many of the expected foulants without generating hazardous or "listed" wastes. Further, a careful selection of detergent qualities can provide the Copyright @2000 by NACE International.Requests for permission to publish this manuscript in any form, in part or in whole must be in writing to NACE International, Conferences Division, P.O. Box 218340, Houston, Texas 77218-8340. The material presented and the views expressed in this paper are solely those of the author(s) and are not necessarily endorsed by the Association. Printed in U.S.A.
  • 2. best cleaning during turnarounds while minimizing troublesome reprocessing of the recovered oil and water solutions. Many detergent formulations have been offered to the petroleum processing industry as "environmentally friendly heavy duty degreasers." While noble in word and goal, these terms are hardly quantifiable. Fairly objective measurements like the Hydrophilic / Lipophilic Balance fail to answer the necessary questions of cleaning ability and subsequent processing impacts. In order to arrive at a detergent selection criteria the Chevron E1 Segundo refinery embarked on a series of tests, mostly field expedients, in order to provide a rational basis for selecting a cleaner to use during shutdowns. The main concerns of widespread use of detergent / surfactant materials around the refinery were: 1) How well does it clean? 2) How much emulsion will it form in the effluent system? 3) In contact with other hydrocarbon streams, how much oil and grease will the detergent put into the effluent water? 4) How toxic is the detergent to the microbes in the effluent system's activated sludge plant? 5) How much foam will be generated in the drains and effluent system, especially in the Induced Air Flotation (IAF) systems? SOAPS TESTED JAYNE PRODUCT: JPX, Energy Plus Red, Energy W. R. GRAINGER: Ball-o-Solv, Knockdown, Red Eye, Jump Start, Gobble CHEMCO: Citrifresh, Synthene, APC DIANA INDUSTRIES: HS-1000, EP680AC, Citrus EP680AC WEST PENETONE: Citrikleen HD-CH UNITED LABORATORIES: Zyme flow RAMCO: Pac Attack PROCTOR & GAMBLE: Joy DOW: Fantastik CHEMISOLVE: US 1600 CA RECYCLING CENTER: D - 99 HARVEY UNIVERSAL INC.: Harvey's Power Grease & Tar Cutter
  • 3. We chose these detergents to represent a broad spectrum. While we never investigated the active materials in these cleaners, their advertising and characteristics indicated that we had examples of citrus or terpene based cleaners, enzyme-based cleaners as well as commercially available household cleaning formulations. CLEANING ABILITY TEST In order to rank the various soaps cleaning ability we coated thin carbon steel strips (corrosion coupons) with residuum (from SJV crude) and then exposed the treated strips to a 160 Deg. F stirred water solution which contained 10% of the various soaps. The residuum percent removal (by weight) was then recorded. Only the terpene based cleaners were effective under these conditions (See Figure 1). These cleaners were then tested at 5% and 1%. Only Q and C retained their effectiveness at 5% (See Figure 2). None of the cleaners in this test were effective at 1%. EFFLUENT IMPACT TESTS In order to evaluate the impact on Refinery effluent systems and potential environmental impact we measured the soaps foaming tendency, emulsion forming tendency, Oil and Grease contribution in the presence of hydrocarbon, and toxicity towards Refinery activated sludge bio organisms. FOAM TEST For a foam test a 100 mLs graduated cylinder was filled with 90 mLs of tap water, 2 mLs of diesel fuel, and 0.9 mL of soap. The cylinder with the solution was stoppered and shaken vigorously ten times. The solution was allowed to settle for 10 minutes before measurements were taken. Foam ranged from 0 to 35 mL (See Figure 3). EMULSION TEST For an emulsion test the emulsion thickness was measured after the above-mentioned test. The chemical cleaners exhibited emulsion ranges from 2 to 3 mL (See Figure 4). The majority of cleaners had an emulsion band of 2 mL, which was equal to the blank, and the initial amount of diesel used. OIL & GREASE TEST After the above visual measurements were taken we transferred the test solutions to a 4 oz sample bottle which was left undisturbed for one hour. A one mL sample was taken from the middle of the bottle and tested for Oil and Grease content. The test used consisted of a Freon extraction followed by an infrared absorbance using the Foxboro Oil and Grease analyzer. The test displayed Oil and Grease values ranging from 1000 to 6000 PPM (See Figure 5). TOXICITY TEST The toxicity test used was developed at the E1 Segundo Refinery to test the toxicity of Refinery chemicals towards their activated sludge. This test is not believed, or intended, to correlate with traditional effluent toxicity tests which are performed on higher organisms (e.g.. Daphnia, Rainbow Trout, etc.) Rather, this test is designed to use Refinery acclimated bio organisms in order to evaluate a given chemical's potential to cause an Effluent Treatment Plant upset. The toxicity test is based on respirometry wherein a bioculture is sealed in a flask along with nutrients, test chemical, and an oxidation / reduction potential indicator. The Redox indicator changes color (blue to pink to clear) with the microorganisms' consumption of the oxygen. The test flask oxygen uptake is
  • 4. then compared to that of a blank. Toxicity or inhibition is measured by the additional time taken by the organisms to consume oxygen compared to the blank. We used two different concentrations 1,000 PPM and 10,000 PPM for the chemical dosage. The toxicity test was based on a scale of 0 to 6 with zero being best (See Figure 6). pH The pH of 1.0-% soap solutions is shown in Figure 7. E V A L U A T I O N SCOPE LIMITATIONS In this study, while we performed tests on a variety of cleaners, we focused only on those cleaners, which can truly function as "heavy duty degreasers." As a result there is environmental impact information but no cleaning performance information on products, which may be effective as general purpose cleaning agents. Another aspect, which was not addressed, was the ability of the cleaners to reduce LEL and benzene. We have field experience here going back several years that the terpene based cleaners are effective at removing benzene when added during a steam out or water wash. Likewise other cleaners have been shown to remove benzene even though their effectiveness on heavy oils is poor by comparison. CONCLUSION We were able to find quantifiable differences in the cleaners tested. These differences, which relate to both the cleaning effectiveness and environmental impact, can be used to select the best detergent for and oil processing facility's needs. Because of the differences in foulants, effluent treatment facilities, disposal and reprocessing options, these tests are best viewed as a point of reference from which an intelligent detergent selection can be made.
  • 5. eL E A N I N G AB IL IT Y 3.5 Raling 3- Abo,,e 95% at 5 3 2 - 60-95% effective ~ 5% 1 - 20% or less effedrNeat 5% 2.5 0 - Little effed ci 10% C 2 i i m 1.5 1 0.5 0 Q C J K O R A P H D E F M B G L N I U V S T DE T E R GE NT FIGURE 1 - Cleaning Ability T op 5 Chemi cal el eaner s 120% 100% 80% m O 60% 40% 20% 0% m O K J Q C DE T E R GE NT FIGURE 2 - Top Cleaners
  • 6. AVE RAGE FOAM 35 30 A ,,,,,4 25 v E 20 E 15 0 1o I.I. 0 ~- ~ Z CL ~ ~ ~ 0 -- DE T E R GE NT FIGURE 3 - Average Foam AVE R AGE E MU LS ION 3.5< 3 2,5 v 2 1,5 21 0.5 0 Z Z DET E RGE NT FIGURE 4 - Average Emulsion
  • 7. AVE RAGE OIL AND GR E AS E 7ooo T 6OOO ASO00 1~ 4000 v 3000 m 2OOO 1000 Z DE T E R GE NT F I G U R E 5 - A v e r a g e Oil a n d G r e a s e T oxi ci ty T es t 0 = Best 6.00 6 = Worst 5.00 4,00 I1• ,.~ 3.00 | m O iniB 2.00 X 0 I~ 1,00 0.00 R E B I A F P D N L G C O H Q M J K DE T E R GE NT FIGURE 6 - Toxicity Test
  • 8. pH 11.5 11 10.5 10 ~j: 9.5 Q.., 9 8.5 8 7.5 7 S M H V J Q T D C B O I N L A P R K F G E DE T E R GE NT FIGURE 7 - pH