

Recommended
Recommended
More Related Content
What's hot
What's hot (17)
Viewers also liked
Viewers also liked (15)
Similar to A1070109
Similar to A1070109 (20)
More from IJERD Editor
More from IJERD Editor (20)
Recently uploaded
Recently uploaded (20)
A1070109
- 1. International Journal of an Engineering Research and Development e-ISSN: 2278-067X, p-ISSN: 2278-800X, www.ijerd.com Volume 10, Issue 7 (July 2014), PP.01-09 Effect of Grading Policy on Students’ CGPA−A Case Study of an Engineering College Altaf Hussain1, Prof. Dr. Salim Ur Rehman2, Prof. Dr. Iftikhar Hussain1 1Industrial Engg. Deptt., University of Engineering and Technology, Peshawar, Pakistan. 2Sarhad University of Science and Information and Technology, Peshawar, Pakistan. Abstract:- This study investigates the effect of change in grading policy on students Cumulative Grade Point Averages (CGPAs). The impact of two grading policies, a lenient grading policy versus a strict grading policy, was studied through the actual CGPAs of the students of an engineering college in Pakistan. The lenient grading policy contains 5 grades (A, B, C, D, F) whereas the strict grading policy contains 7 letter grades (A, B+, B, C+, C, D, F). A sample of 1578 students CGPAs, divided in two sections, was analyzed for this purpose in which almost half of the students obtained CGPAs on lenient grading policy and the other half on strict grading policy. Motivating students to perform better is one of the expected functions of grading policy. Results show that strict grading policy has a statistically positive impact on student CGPAs, when compared to the student CGPAs on lenient grading policy. The low-performers get more benefit than the high-performers in terms of CGPA when the stricter grading policy is employed. Keywords:- Lenient Grading, Strict Grading, Student achievement, Student motivation, CGPA. I. INTRODUCTION Every educational institute use some sort of evaluation system to gauge student performance. Usually the performance of students is recorded in form of marks on a certain scale. These marks obtained by the student are converted to some form of a letter grade or percentage. These letter grades or percentages are then communicated to students for their appraisal. Various grading systems or policies are employed by different institutes or instructors depending upon the institute’s policy. The impact of different grading system on student learning has generated a lot of debate among academics. An examiner assesses student and records his/her performance on an exact scale 100, 99, 98… 1. These figures are then transformed to categories like A, B, C and so on when results are ultimately reported. This transformation of numbers in to grades discards some information on hand (Dubey & Geanakoplos, 2010). For example 90 score may be slightly better than 89 but the transformation awards different grades like A for 90 and B for 89. On the other hand score 89 and 81 are quite far apart on the scale but gets the same grade if scale of B = 81-89. The student achievement is a function of the grading system through which he is evaluated. Therefore different grading systems render different student assessment thus affecting student final result. This difference in the final result sometimes contravenes justice when students of different institutions evaluated by different grading systems compete in a single market. Many universities have seen a change in their grading policy, recently. They have changed their grading policy from a traditional letter grades to a plus/minus grading system (Elikai & Schuhmann, 2010). The plus/minus grading system is stricter than the traditional system as the students on the lower edge of a grade category stand a reasonably good chance of losing their higher grade due to increased resolution that comes with the plus/minus grading system. A student must work harder in order to retain his position in term of grades. Usually a student obtains marks on a certain absolute index of achievement. The index, more often than not, is 0-100. This absolute scale in a form of percentage is used by the instructor for assigning grades such as A = 90-100, B = 80-89, C = 70-79, D = 60-69 and F = 59 or below (Milton, 1986). 1,600 institutions, according to a survey, from American Association of College Registrars and Admissions Officers (AACRAO), signify that about 92 percent institutions use letter grades and 95 percent use 4.00 scale for Grade Point Average (GPA) with A = 4.00 and F = 0.00 (Quann, 1984). A score of 50 or 60 is regarded as a passing score underlying the idea that the student must show some level of achievement to be judged satisfactory. The purpose of this study was to investigate whether the grading system has any impact on student performance. Education and psychology literature have shown that grading system affects motivation of the student (Adams & and Torgerson, 1964; Norman, 1981; Walvoord & Anderson, 1998). Therefore grading system has a motivational aspect that must be taken in to consideration when a grading system is employed or changed. So it was of interest to determine whether the motivational aspect of grading system applies to engineering courses. For this purpose student CGPAs are compared for a lenient grading system with a strict 1
- 2. Effect of Grading Policy on Students’ CGPA−A Case Study of an Engineering College grading system as done previously in literature. This study furthers the earlier research in terms of providing current evidence whether the grading systems has any positive impact on student performance. This study is the first of its kind that applies to engineering disciplines and measures the impact of grading system on mean CGPA of students and across students’ CGPA categories. Grades carry manifold significance for students and are an important aspect of students’ life. It differentially awards students for their level of attainment of academic performance (Sabbagh, Resh, Mor, & Vanhuysse, 2006). Consequently these grades are used by different organizations. Grades are used by most universities as an integral part of admission criterion. Employers used grades for job selection and placement thus affecting a person’s life chances and earnings. Therefore grades are a very important instrument that influence student journey through his educational and professional career (Miller, 1998; Kelly, 2008; Resh, 1998). Student shape part of their self-image on the basis of the grades they receive. It also affects student perception, motivation, and recognition among friends, colleagues and parents (Entwisle, Alexander, & and Olson, 2007). Grades also serve teacher in disposing his authority and maintaining discipline among students (Nisan, 2006). Motivational aspect of grading system can be discussed by two theoretical arguments. One argument suggests that a strict grading system motivates student to work harder to achieve higher grade or retain the previous grade (Adams & and Torgerson, 1964; Norman, 1981; Walvoord & Anderson, 1998; Johnson & Beck, 1988). This arguments builds in foundation on the basic idea that grading induces in to the students motivation for putting added effort to perform better. So stricter the grading system harder the student will have to work to achieve higher grades thus achieving higher level of learning. So the plus/minus grading system where the bare minimum to get a given grade is raised motivates the student to work harder and perform better. Another argument which runs counter to the first one advocate that stricter grading system put on students additional pressure to retain or improve his grade and can be harmful to student performance. This added pressure can result in academic and emotional fatigue (Butler & Nissan, 1986). Student views various grading system as just a mere issue of scaling that a given grade can be achieved with the same effort regardless how that grade is defined (Elikai & Schuhmann, 2010). These arguments are not necessarily mutually exclusive for a particular classroom. As some students may get motivated to put extra effort in order to retain or improve their position but there may be some students, usually weaker ones, who may deem certain grades to be out of reach and “give up” (Betts, 1997). Also there may be some who may find no impact on their motivation by the introduction of higher standards. Consistent with the utility-maximization models put by various researchers and Crooks’ (1988) summary of 14 fields of research related to learning strategies, motivation, and achievement, the grading system impact on student performance is both theoretically and empirically indefinite (Betts, 1997; Becker & Rosan, 1992; Crooks, 1988). Regardless of this ambiguity, there is almost no doubt that incentive act as a positive reinforcement and serves to motivate behavior. In economical terms, basic economical behavior shows that low marginal costs or benefits act as lower incentive to motivation. Similarly, higher marginal benefits serve to increase motivation. But this notion is not quite simple when seen in the perspective of student behavior in class. But we can presume on reasonably sound grounds that most students look for earning passing grades whereas their response to incentive may differ. GPA in engineering merits particular consideration as there is no room for failure. Unlike other education fields the prospect of giving up in engineering may be synonymous to deserting their chosen field of study. II. LITERATURE REVIEW All higher level courses such as colleges and universities assign grades to students after their evaluation through certain mechanism such as exams, class participation, home work etc. These grades are assigned under some policy usually dictated by the institution or left to the instructor choice with some limitations. Grades provide a brief and understandable way of evaluating student learning and achievement. As these grades are used by other institutions in making a decision about the students’ future therefore these grades must communicate student ability and performance in a manner that ensures meritocracy. Various approaches are employed in evaluating student work. Each approach is based on certain theory about the higher-education’s social role. Higher education institutions must aid meritocratic and democratic goals by recognizing and categorizing the brightest, and fostering the intellectual and social development of all students. Grading systems of institutions reflect this approach. There are various grading systems used by different institutions all over the world like A, B, C, D, F and A, B+, B, C+, C, D, F and countless others (Academic grading in Australia, 2011; Policy statement, 2001). Each letter in the grading system has an equivalent point value. The A or A+ has the highest value such as 4.00, followed by B or B+ with the next higher value and usually the grading system ends on F with equivalent value of 0.00 depending upon the policy of the institution (Plus/Minus Grading FAQ, 2006). The Grade Point Average (GPA) is computed as: the course 2
- 3. Effect of Grading Policy on Students’ CGPA−A Case Study of an Engineering College total credit hours times the earned letter-grades’ point value. The Cumulative Grade Point Average (CGPA) is computed as: sum of every course earned grades points divided by all the attempted courses credit hours (How to calculate HOPE GPA, 2010). There are four functions of grades that the teacher assigns to students; (1) administrative, (2) informational, (3) guidance, and (4) motivational (Adams & and Torgerson, 1964). Decision regarding selection, graduation, and employment is addressed by the administrative aspect of grades. Information regarding the student progress is covered by the grades informational aspect. The guidance facet of grades deals with identifying the strength and weakness of the students. This helps students to plan their study fields for future. The motivational aspect focuses on grade as a response to effort exerted by students. Greater the effort the better the grade the students earns. Norman (1981) emphasized on student motivation to study in order to strengthen their performance and skill. Grading system forces students to do their homework and assignment and take interest in course in order to perform better (Norman, 1981). Walvoord and Anderson (1998) understands grading as a process through which the instructor develops learning outcomes, build exams, assesses student learning against those outcomes, sets criterion and lead students’ learning (Walvoord & Anderson, 1998). According to them grading serves four roles; (1) students’ work evaluation, (2) communicating information with students and employer, (3) enhancing student motivation, and (4) course organization like closing the course and forcing teacher and student to make concentrated efforts. Clark (1969) worked on two conflicting hypothesis regarding students motivation for learning (Clark, 1969). The first hypothesis deals with the notion that student gets motivated by intangible sources like learning aspiration, self-improvement, self-confidence and self-consciousness etc. The second hypothesis, on the other hand, suggested that motivation of student comes from tangible sources like competition for grades. He concluded that students, who were graded, scored superior on tests than the non-graded students. Gold et al. (1971) drew comparison between pass/fail and letter grading system. He found that student achievement is higher for the graded class than the class which was evaluated on pass/fail grading system (Gold, Reilly, Silberman, & Lehr, 1971). Hales et al. (1973) conducted a similar study by comparing 225 students divided in three samples, each containing 75 students, at Ohio University. He concluded that the student achievement in graded class is significantly higher than the non-graded class (Bain, Hales, & Rand, 1973). Goldberg (1965) has discussed the grades in a psychological perspective from the motivational aspect (Goldberg, 1965). He asserts that the teacher considers that the student can be motivated by providing them comforting environment rather than pressurizing environment for learning. In this theory high grades are considered to act as positive reinforcements which in turns motivate students for learning. On the other hand, strict grader awards frequent Ds and Fs and rare As and Bs under the assumption that most of the students are not performing up to their full potential and they need to perform better. In this theory punishment acts as a tool for motivating student to learn. Therefore the strict grader awards low grades as a punishment to induce motivation in students and exploit their full potential. Furthermore he compared students on five different grading system and concluded that the effect of grading system on student test score is trivial still strict grading inspire higher test scores than lenient grading system. Figlio et al. (2004) studied the consequence of various grading system on third, fourth and fifth grade students (Figlio & Lucas, 2004). He examined the standardized test score and reasoned that motivation of student increases with higher grading standards. The impact is more profound on high-performers than low-performers. When clubbed together both the high- and low-performers in the same class results in higher gains 3 for both. Elikai and Schumann (2010) validated the theory of motivational function of grading. In their finding they stated that stricter grading scales result in higher motivation than lenient ones (Elikai & Schuhmann, 2010). They also found that the stricter grading scales do not make the high-performers suffer as they perform consistently regardless of the severity or leniency of the grading scales. The stricter grading scale also lowered the attrition rate of students. This theory was vindicated by the feedback collected from the students as they termed the stricter grading system to be a challenge and a motivant for high performance. John Dewey said: “the end of education is more education”. The new forms of assessments are based on the inspiration of quality of learning and not on quantity of learning (HARGREAVES, 1997). These methods of assessments are more focused on measuring what the student can do with what they know rather than what they know. The main idea behind employing these assessment methods is the theory that students adapt their learning behavior to the assessment method and if they perceive the assessment method to be shallow they use shallow approach to learning. If the perception is that the assessment method is rigorous they use intensive approach (Biggs, 1999). Johnson and Beck (1988) compared the strict and lenient grading system and performance of students on tests in Educational Psychological course on 91 undergraduate students (Johnson & Beck, 1988). His study
- 4. Effect of Grading Policy on Students’ CGPA−A Case Study of an Engineering College produced similar findings and concluded that the test score of students on strict grading system were higher than lenient grading system. Dixon (2004) investigated the impact of plus/minus grading system with straight letter grading system on 224 students divided in six sections for a single course (Dixon, 2004). The students were provided the option of choosing their preferred grading system. More than two-third of the students chose the straight letter grading system. The finding of the study suggested that the students on plus/minus grading system received more pluses than minuses. And Bs and Ds were the grades which saw significant numerical difference between the two groups. Professor Pankaj Jalote (2013) carried out a study to determine the impact of grading scheme or system on the performance of student (Jalote, 2013). He included 140 students for three courses and divided them in two equal-sized samples. Straight-letter grades A, B, C, D, F were used for sample 1 and called scheme 1, whereas minus grading A, A-, B, B-, C, C-, D and F were used for sample 2 and called scheme 2. He concluded that the average GPA remained unchanged. Pupils moved through grade categories on scheme 2 in comparison to scheme 1 but the up movement was cancelled out by the down movement thus resulting in a negligible change in average GPA. The top student average GPA decreased on scheme 2 whereas the bottom student average GPA improved with scheme 2. MeClure and Spector, on the other hand, have argued that grading system does not have any impact on student motivation for learning (McClure & Spector, 2004). In their study they gave student a choice to select their preferred grading system. After evaluating their GPA at the end of the course they did not find any significant improvement in the performance of the students. In summary, the studies performed by various researchers have added to the debate. Conflicting arguments has been established about effect of strict grading system on student motivation and performance. Some has argued that the impact on high-performers is more profound than on low-performers. But these findings cannot be generalized for all fields. Also almost all of these studies were based on experiments conducted in a controlled environment. In real cases such control is not possible. In our study we have considered a real life case study to analyse the effect of grading scheme in a natural environment. None of these studies were conducted on engineering students therefore there is also a need to carry such type of study for engineering disciplines as engineering requires high excellence in order to remain and grow in engineering profession. The current study tries to study the impact of change in grading system on the students CGPA over a period of time. III. RESEARCH QUESTIONS The two grading system which are analyzed in this study are; lenient grading system called scheme 1 (5-letter grading system) and stricter grading system called scheme 2 (7-letter grading system). In this study we try to attend to the following hypotheses regarding the impact of change in grading scheme on the CGPA of students. Hypothesis 1 was established to see the transformation in average CGPA of students that might occur due to the switchover to stricter scheme from lenient scheme. Null Hypothesis 1: The mean CGPA of students on scheme 2 is less than or equal to the mean CGPA of students on scheme 1. Hypothesis 2 deals with the distribution of change caused by the change in grading system from lenient 4 to strict grading system. Null Hypothesis 2: There are no noteworthy differences in the effect of change in grading system on student performance across students of different CGPA brackets. IV. METHOD A sample of 1578 student CGPA is selected for 32 sessions of graduated students. The students belong to engineering field. The CGPA of students belonging to two different engineering disciplines are included. 674 (332 of section 1 and 342 of section 2) were evaluated on scheme 1 and 904 (418 of section 1 and 486 of section 2) were evaluated on scheme 2. In summary 47.5% students of the total sample were evaluated using scheme 1 while the rest of 52.5% were evaluated using scheme 2. The college changed the grading scheme at around year 1999 from 5-letter to 7-letter grading scheme. The 5-letter grading scheme consisted of A, B, C, D, and F grades with corresponding point value of 4.00, 3.00, 2.00, 1.00 and 0.00 respectively. The 7-letter grading scheme consisted of A, B+, B, C+, C, D, and F grades with corresponding point value of 4.00, 3.50, 3.00, 2.50, 2.00, 1.00 and 0.00 respectively. The student did not choose the grading scheme. The students admitted before the switchover of the grading scheme were evaluated on 5-letter grading scheme (scheme2) whereas the students admitted after the
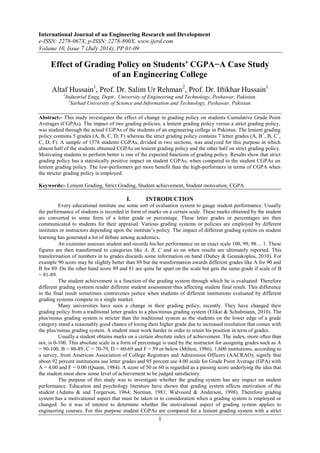
- 5. Effect of Grading Policy on Students’ CGPA−A Case Study of an Engineering College switchover were evaluated on 7-letter grading scheme (scheme 1). This characteristic of the data makes this study a longitudinal study. The CGPAs are considered to be clean in various regards; instructors, that taught and helped students in their studies, are assumed to be the same for both scheme 1 and scheme 2 as any altering in instructors are assumed to be matter of routine, the teaching quality is assumed to be alike for both scheme, the classrooms remained identical, the course material that was taught, was the same for both schemes, the quality of exams was identical. T-test was performed to test the first hypothesis and 2 proportion test was carried out to test the second hypothesis. Minitab was used for performing the above tests. V. RESULTS AND DISCUSSIONS Table 1 shows some basic statistics like the sample size, mean, standard deviation and quartiles for CGPA on both schemes. The mean CGPA is higher on scheme 2 than scheme 1 whereas the standard deviation decreases which means that the CGPAs shrinks towards mean by switching to scheme 2. The quartiles also improve with the switch over to scheme 2 from scheme 1. In the quartiles a considerable amount of increase of 0.18 and 0.16 can be seen in the median and quartile 1 compared to quartile 3 (0.08) which means that the students of lower CGPA brackets are benefitting more that the higher CGPA bracket students. The range of CGPA for scheme 1 is larger than scheme 2. Table 1 Basic Statistics of the Sample Variable Sample Size Mean StDev Min Q1 Median Q3 Max Scheme 1 674 2.6879 0.4882 2 2.3 2.55 3.03 4 Schem e 2 90 4 2.81 61 0.45 27 2.0 7 2.4 6 2.7 3 3.1 1 3.9 8 A single tail t-test was used to test the first null hypothesis that the mean CGPA on scheme 2 is less than or equal to mean CGPA on scheme 1 on a significance level of 0.05. Table 2 shows the two-sample T-test on mean CGPA for scheme 1 and scheme 2. The test statistic was 5.38 with a P-value of 0.00, indicating statistically significant difference between mean CGPA and thus rejecting the null hypothesis. The estimated difference between the mean CGPA of both scheme is 0.1218 which means that the average CGPA increases by 0.1218 when grading system is changed from scheme 1 to scheme 2. Table 2 Two Sample T-test on Sample 2, Sample 1 Figure 1 shows that CGPA on scheme 1 is concentrated on the lower side as many students have CGPAs that are less than mean CGPA of 2.687.The CGPA on scheme 2 is concentrated at lower-centre side and the students seems to have shifted upwards towards the mean CGPA. The line in Figure 1 connects the means of both the samples. The upper portion of the plot in Figure 1 records no considerable change. Therefore it we need to see whether this change in CGPA is distributed throughout the CGPA range or is it concentrated in a smaller CGPA range (CGPA brackets). Our second hypothesis addresses this problem. Figure 1 CGPA Individual Plot 5 Variable Sample Size Mean StDe v SE Mean Estimate for difference T-value p-value DF Scheme 1 674 2.687 0.488 0.015 0.1281 5.38 0.00 1576 Scheme 2 904 2.816 0.452 0.019
- 6. Effect of Grading Policy on Students’ CGPA−A Case Study of an Engineering College We have bracketed the CGPA in 8 intervals. Each interval has a range of 0.25. The student CGPA frequency distribution is shown in Table 3. Column (1) and (2) shows the sub-classes and CGPA interval. Column (3) and (4) each shows the number of students as well as the corresponding percentage on both scheme 1 and scheme 2 respectively. The fifth column shows the absolute difference {(4) − (3)} in frequency and corresponding percentage of students. Sub-class 2, in column (3) shows that maximum number of students on scheme 1 belongs to this CGPA bracket i.e. 27% students have CGPA of the order of 2.26 to 2.50 on scheme 1. This percentage amount, in fourth column, comes down to 22.01 when scheme 2 is adopted. For scheme 2, the maximum number of students are listed in sub-class 3 i.e. 22.12% which is slightly higher than sub-class 2. The corresponding number of students in the same sub-class on scheme 1 is 15.88% which seems to be considerable lower. But sub-class 1 show a stark difference as 20.03% students belong to this class on scheme 1 and only 7.96% on scheme 2. Sub-class 1, 2, and 8 shows reduction in percentages whereas the rest show increase. Most likely the students have moved from sub-class 1 and 2 to higher sub-classes. Table 3 Frequency Distribution and Percentages (1) (2) (3) (4) (5) Sub-class CGPA Interval Scheme 1 Scheme 2 │(4) - (3)│ 6 Difference No. of Students No. of Students No. of Students (Percent) (Percent) (Percent difference) 1 2.00-2.25 135 72 63 (20.03%) (7.96%) (12.07%) 2 2.26-2.50 182 199 17 (27.00%) (22.01%) (5.01%) 3 2.51-2.75 107 200 93 (15.88%) (22.12%) (6.24%) 4 2.76-3.00 72 142 70 (10.68%) (15.71%) (5.03%) 5 3.01-3.25 71 125 54 (10.53%) (13.83%) (3.3%) 6 3.26-3.50 45 75 30 (6.68%) (8.30%) (1.62%) 7 3.51-3.75 38 63 25 (5.64%) (6.97%) (1.33%) 8 3.76-4.00 24 28 4 (3.56%) (3.10%) (0.46%) Total 674 (100%) 904 (100%) A two proportion Z-test was performed (two- tail) to test the second hypothesis that the proportion of students in the corresponding CGPA brackets for both the scheme is the same for all the CGPA brackets at a significance level of 0.05. From Table 4 we can conclude that the differences in CGPA for some intervals are statistically significant. These intervals are 2.00-2.25, 2.26-2.50, 2.51-2.75, and 2.76-3.00 and the corresponding difference (scheme 1 − scheme 2) 0.120651, 0.0498969, -0.0624852, and -0.0502547 respectively. The switch over of the grading scheme is resulted in a statistically significant decrease in the amount of students in the first two CGPA intervals. The amount of students in the next two intervals has statistically significant increased with the switch over of the grading system.
- 7. Effect of Grading Policy on Students’ CGPA−A Case Study of an Engineering College Table 4 Two-proportion Z-test and Corresponding p-values 7 S. No. CGPA Proportions (No. Of Students) Estimate for difference (Scheme 1- Scheme 2) Z-test p-value Status Scheme 1 Scheme 2 1 2.00-2.25 0.2003 0.0796 0.120651 0.000 Significant (135) (72) 2 2.26-2.50 0.27003 0.22013 0.0498969 0.022 Significant (182) (199) 3 2.51-2.75 0.15875 0.22124 -0.0624852 0.002 Significant (107) (200) 4 2.76-3.00 0.10682 0.15708 -0.0502547 0.004 Significant (72) (142) 5 3.01-3.25 0.10534 0.13827 -0.0329331 0.050 Non-significant (71) (125) 6 3.26-3.50 0.06677 0.08296 -0.0161990 0.230 Non-significant (45) (75) 7 3.51-3.75 0.05638 0.06969 -0.0133104 0.285 Non-significant (38) (63) 8 3.76-4.00 0.03561 0.03097 0.00463486 0.610 Non-significant (24) (28) Total 1.00000 1.00000 (674) (904) Table 4 also suggests that the change in CGPA is distributed fairly among the lower four CGPA intervals i.e. CGPA range of 2.00-3.00. The change in upper four CGPA intervals i.e. 5, 6, 7 and 8, has remained statistically insignificant. From this we can reason that significant number students are moving to the upper brackets of CGPA from lower brackets without affecting the students belonging to the higher brackets. This means that the performance of the high-performers is independent from the behaviour of the low-performers and the notion that the high-performers gets benefit at the cost of low-performers does not find evidence in our study. VI. CONCLUSIONS Our findings indicate that the change in grading scheme does affect the CGPA of students significantly. Most of the studies carried out on this subject were experimental in nature whereas our study is based on a real life case study. The stricter grading scheme benefits the students of lower brackets of CGPA whereas the students of upper brackets of CGPA remain unchanged. This means that stricter grading scheme motivates students to work even harder. The overall shift in mean CGPA of students is positive and estimated to be 0.1281 on a scale of 4.00. The students belonging to the CGPA bracket of 2.00-2.25 has seen the maximum difference in the proportion of students getting benefit i.e. 0.120651 where as the CGPA bracket of 3.75-4.00 has marginally declined. The lower brackets of CGPA have shown a statistically significant upward mobility. The upper CGPA brackets have shown a very slight change which is insignificant. The performance of the student at both extremes of the CGPA ranges is independent from each other. The high-performers perform better regardless of the grading system but the low-performers perform better in stricter grading system. ACKNOWLEDGEMENT I would like to thank the college (name cannot be disclosed upon the request of the college administration) which provided us with the opportunity to conduct this study and shared their examination results without any hesitation.
- 8. Effect of Grading Policy on Students’ CGPA−A Case Study of an Engineering College REFERENCES [1]. Academic grading in Australia. (2011, March 13). (Wikipedia) Retrieved June 28, 2012, from http://en.wikipedia.org/wiki/Academic_grading_in_Australia [2]. Adams, G. S., & and Torgerson, T. L. (1964). Measurement and Evaluation in Education, Psychology, 8 and Guidance. Holt, Reinhart and Winston. [3]. Bain, P. T., Hales, L. W., & Rand, L. P. (1973). An Investigation of Some Assumptions and Characteristics of the Pass-Fail Grading System. The Journal of Educational Research , 67 (3), 134-136. [4]. Becker, W., & Rosan, S. (1992). The learning effect of assessment and evaluation in high school. Economics of Education Review , 11 (2), 107-118. [5]. Betts, J. R. (1997). Do grading standards affect the incentive to learn? San Diego: University of California. [6]. Biggs, J. B. (1999). Teaching For Quality Learning At University. SRHE and Open University Press. [7]. Butler, R., & Nissan, M. (1986). Effects of no feedback, task-related comments, and grades on intrinsic motivation and performance. Journal of Educational Psychology , 78, 210-216. [8]. Cherry, T. L., & Ellis, L. V. (2005). Does Rank-Order Grading Improve Student Performance? Evidence from a Classroom Experiment. International Review of Economics Education , 4 (1), 9-19. [9]. Clark, D. C. (1969). Competition for grades and graduate student performance. The Journal of Educational , 62 (8), 351-354. [10]. Crooks, T. J. (1988). The impact of classroom evaluation practices on students. Review of Educational Research , 58 (4), 438-481. [11]. Dixon, C. (2004). Plus/minus grading: If given a choice. College Student Journal , 38 (i2), 280-284. [12]. Dubey, P., & Geanakoplos, J. (2010). Grading exams: 100,99,98,...or A,B,C? Games and Economic Behavior , 69 (1), 72-94. [13]. Elikai, F., & Schuhmann, W. P. (2010). An examination of the impact of grading policies on students' achievement. Issues in Accounting Education , 25 (4), 677-693. [14]. Entwisle, D. R., Alexander, K. L., & and Olson, L. S. (2007). Early schooling: the handicap of being poor and male. Sociology of Education , 80 (2). [15]. Figlio, D. N., & Lucas, M. E. (2004). Do high grading standards affect student performance? Journal of Public Economics , 88 (9-10), 1815–1834. [16]. Gold, R. M., Reilly, A., Silberman, R., & Lehr, R. (1971). Academic achievement declines under pass-fail. Journal of Experimental Education , 39 (3), 17-21. [17]. Goldberg, L. R. (1965). Grades as motivants. Psychology in the Schools , 2 (1), 17–24. [18]. HARGREAVES, D. J. (1997). Student Learning and Assessment Are Inextricably Linked. European Journal of Engineering Education , 22 (4), 401-409. [19]. How to calculate HOPE GPA. (2010, December 2). Retrieved June 28, 2012, from http://www.reg.uga.edu/grades/howToCalculateGPA [20]. Jalote, P. (2013, June). Impact of Grading Schemes on Students’ Grades. Retrieved September 30, 2013, from Higher Education in India: http://jalote.wordpress.com/2013/06/19/impact-of-grading-schemes- on-students-grades/ [21]. Johnson, B. G., & Beck, H. P. (1988). Strict and lenient grading scales: How do they affect the performance of college students with high and low SAT Scores. Teaching of Psychology , 15 (3), 127- 131. [22]. Kelly, S. (2008). What Types of Students' Effort Are Rewarded with High Marks? Sociology of Education , 81 (1). [23]. Kokkelenberg, E. C., Dillon, M., & Christy, S. M. (2008). The effect of class size on student grades at a public university. Economies of Education Review , 27 (2), 221-233. [24]. Miller, S. R. (1998). Shortcut: high school grades as a signal of human capital. Educational Evaluation and Policy Analysis , 20 (4). [25]. Milton, O. (1986). Making Sense of College Grades: Why the Grading System Does Not Work and What Can Be Done about It. San Francisco: Jossey-Bass. [26]. Nisan, M. (2006). Justice in the classroom: teachers' and students' perceptions of principles that guide grading distribution. Social Psychology of Education , 9. [27]. Norman, D. A. (1981). Perspectives on cognitive science. Norwood, N.J. : Ablex Pub. Corp. ; Hillsdale, N.J. : L. Erlbaum Associates. [28]. Plus/Minus Grading FAQ. (2006, March 28). (UGA Bulletin) Retrieved June 28, 2012, from http://www.bulletin.uga.edu/PlusMinusGradingFAQ.html#Q1 [29]. Plus/MinusGrading and Motivation: An Empirical Study of Student Choice and Performance (2004). [30]. Policy statement. (2001, November 19). (Carnegie Mellon Unversity ) Retrieved June 28, 2012, from http://www.cmu.edu/policies/documents/Grades.html
- 9. Effect of Grading Policy on Students’ CGPA−A Case Study of an Engineering College [31]. Quann, C. J. (1984). Grade and Grading: Historical Perspectives and the 1982 AACRAO Study. Washington D.C.: American Association of Collegiate Registrars and Admission Officers. [32]. Resh, N. (1998). Track placement: How the“sorting machine” works in Israel. American Journal of 9 Education , 106 (3). [33]. Sabbagh, C., Resh, N., Mor, M., & Vanhuysse, P. (2006). Spheres of justice within schools: Reflections and evidence on the distribution of educational goods. Social Psychology of Education (9). [34]. Smallwood, M. L. (1935). An Historical Study of Examinations and Grading Systems in Early American Universities: A Critical Study of the Original Records of Harvard, William and Mary, Yale, Mount Holyoke, and Michigan from Their Founding to 1900. Cambridge: Harvard University Press. [35]. Starch, D., & Elliot, E. C. (1912). Reliability of the Grading of High-School Work in English. The School Review , 20 (7), 442-457. [36]. Walvoord, B. E., & Anderson, V. J. (1998). Effective Grading: A Tool for Learning and Assessment in College. San Francisco: Jossey-Bass.