Measure the Value of Your LinkedIn Activities
•
0 likes•563 views

This document discusses how to measure the value of brands' LinkedIn activities using earned media value (EMV). It explains that EMV calculates the financial value of social media interactions to allow comparison of organic and paid content performance. The document provides examples of LinkedIn, Facebook, Twitter and YouTube analytics dashboards that display metrics like new followers, engagements, impressions and top performing content broken down by organic and paid values in EMV. It also outlines Performly's social media monitoring service that calculates these EMV metrics.

Recommended
Recommended
More Related Content
What's hot
What's hot (20)
Viewers also liked
Similar to Measure the Value of Your LinkedIn Activities
Similar to Measure the Value of Your LinkedIn Activities (20)
Recently uploaded
Recently uploaded (20)
Measure the Value of Your LinkedIn Activities
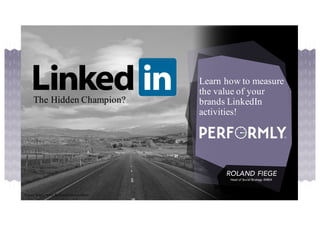
- 1. Learn how to measure the value of your brands LinkedIn activities! FINN MCALEER Social Media Performance The Hidden Champion? Source: https://www.flickr.com/photos/tahini
- 3. Current State of The Big Four Feature Network LinkedInFacebook Twitter YouTube Discovery Thought Leadership Influencers Online Video leader Global Users >1600 mm >414 mm >305 mm >1000 mm Recommended for • Performance marketing • Storytelling with photo and video • Content marketing with thought leadership • Employer Branding • King of B2B • Live event communication • Influencer marketing • Visual branding with video
- 4. A close-up on LinkedIn LinkedIn FY13 FY14 FY15 Members (million) 277 347 414 Monthly active members (million) 73 87 98 Talent Solutions (% revenue) 60% 60% 63% Marketing Solutions (% revenue) 20% 20% 19% Premium Subscriptions (% revenue) 20% 20% 18%
- 5. Content Marketing on LinkedIn Slideshare Company Pages Pulse • Long term content • Content Distribution • Thought Leadership • Professional identities • Insight & knowledge • Support content marketing • Brand Vision • Engage with users • Show case pages
- 6. #2: Carefully consider your Audience
- 7. LinkedIn Facebook Vs LinkedIn Demographics Gender Network LinkedIn Facebook 49% Male 51% Female 79% Male 21% Female Age 26% of users 25-34 21% of users < 35 Active Users (Monthly UK) Twitter 49% Male 51% Female 65% of users < 34 60 million views every month 31 million 15 million
- 8. LinkedIn Facebook vs LinkedIn User Behaviour
- 10. What LinkedIn Measures Followers Page Page Views Engagement Reach Posts Careers Jobs Employees
- 11. Content visibility for our LinkedIn clients Source: LI: our clients • Apr 2016 FB: Our clients – Feb 2014 LinkedIn Average reach per post Engagement Visibility AVERAGE 25,992 0.87% 6.30% 94%of your connections don’t organically see your content Investment on LinkedIn Facebook Average reach per post Engagement Visibility AVERAGE 23,599 3-06% 1.98% 98%of your fans don’t organically see your content Investment on Facebook I.E. You need paid activity!
- 12. Ad Formats on LinkedIn Sponsored updates Text ads
- 13. #4: Likes, clicks, shares; Who cares? “I’ve got Likes, clicks and Shares but no idea what they’re worth.”
- 14. “We don’t internally have the confident data we need to convince leaders or peers that they should invest in some of this new technology or positions or skills that will be crucial to a growth plan” Adrian Parker, Patron Spirits Company “I also have no clue about what’s working and what’s not.” US fast food client
- 15. “What would I have had to pay to achieve the same result?” EMV works across channels, and is easily calculated and automated to allow daily measurement. We need one performance metric to rule them all Earned Media Value (in cash) €
- 17. How Does It Work? OUTPUTSPERFORMLY PROCESS 17 RTs COMMENTSCOMMENTS LIKES @REPLIES CLIENT’S PAID MEDIA RATES AGENCY PAID MEDIA INSIGHTS ASSIGN EARNED VALUE AGGREGATE BRAND EMV SOCIAL PERFORMANCE DASHBOARD, MONTHLY REPORTS SHARES BENCH- MARK DATA SOCIAL MEDIA MONITORING KPIs WEBSITES FORUMS SUBSCRIBERS MENTIONS BLOGS YOUR SOCIAL KPIs PROMOTED TRENDS, ETC. VIDEO POSTS PHOTO POSTS PROMOTED POSTS COMMENTS FAVES PHOTO TWEETS VIDEO TWEETS VIDEO PLAYS LIKES CHANNEL SUB- SCRIBERS FAVES SHARES PROMOTED POSTS VIDEO POSTS PHOTO POSTS COMMENTS SHARES
- 18. Example Performly content performance chart FAN ACQUISITION FANENGAGEMENT 0 2 4 6 8 10 20 40 60 This post has low engagement, low acquisition. Performly might calculate EMV at €16.50. Total. Job postings find the right talent but LinkedIn has a lot more potential for your brand
- 19. Content performance FAN ACQUISITION FANAENGAGEMENT 0 2 4 6 8 10 20 40 60 This post has high acquisition and a little engagement. Performly might calculate it’s worth €2295.
- 20. Content performance FAN ACQUISITION FANENGAGEMENT 0 2 4 6 8 10 20 40 60 This post is doing everything right. High acquisition & high engagement. Performly says it created €5.580 of marketing impact and grew their fanbase.
- 21. Now you can justify social budgets for paid ads AND content by showing financial impact THESE NEW FANS, AND OUR EXISTING FANS, CREATED OF NEW MEDIA AND TOUCHPOINTS “HEY, THANKS FOR THE OUR SOCIAL PROWESS PRODUCED OF MARKETING IMPACT!” PERFORMLY SAYS WE GAINED NEW FANS 12,500 47.725€ “MS. CFO, I’D LIKE TO PROMOTE THIS POST:” €10.000 10.000€ 47.725€
- 22. And optimised social performance means your Social Team finally has a seat at the Budgeting Table
- 23. LINKEDIN / PERFORMANCE OVERVIEW 497,944 € 90,124 Total New Followers Paid New Followers Organic New Followers 32,335 32,269 66 €48,404 €48,404 - Total Engagements 37,636 €17,027 Paid Engagements 1,332 - Organic Engagements 36,304 €17,027 Total Impressions 5,060,287 €24,694 Paid Impressions 121,859 - Organic Impressions 4,938,728 €24,694 Example LinkedIn performance charts
- 24. Example LinkedIn performance charts Top Organic Content by EMV Your top 10 organic, non-sponsored posts, over your selected time-period sorted by EMV
- 25. Example Facebook performance charts
- 26. Example Facebook: Organic Vs Paid Reach
- 27. Example Twitter performance chart
- 28. Example YouTube performance chart
- 29. YouTube Top Ten Videos EMV
- 30. Who uses Performly? Three global automotive clients A global pharmaceutical manufacturer A national railway system A leading e-commerce site A global insurance provider The world’s largest bakery
- 31. Getting started 1. We assess how many social channels you want to measure (on Facebook, Twitter & YouTube). 2. We price a 3-month trial so you can see how your social team, ads, and content perform. 3. Our media analysts meet/phone weekly to walk through performance and insights, and to make recommendations on your social approach. 4. At the end of the trial, you decide if you want to extend the contract to one year.
- 32. FOR MORE INFORMATION, CONTACT FINN, MCALEER, SOCIAL MEDIA PERFORMANCE, @ PERFORMLY: FINN.MCALEER@PERFORMLY.SOCIAL Thank You!