Grazing Management Effect on Micro- and Macro-Scale Fate of Carbon and Nitrogen in Rangelands
•
0 likes•841 views

Martha Mamo
Recommended

Recommended
More Related Content
What's hot
What's hot (20)
Viewers also liked
Viewers also liked (20)
Similar to Grazing Management Effect on Micro- and Macro-Scale Fate of Carbon and Nitrogen in Rangelands
Similar to Grazing Management Effect on Micro- and Macro-Scale Fate of Carbon and Nitrogen in Rangelands (20)
More from National Institute of Food and Agriculture
More from National Institute of Food and Agriculture (20)
Recently uploaded
Recently uploaded (20)
Grazing Management Effect on Micro- and Macro-Scale Fate of Carbon and Nitrogen in Rangelands
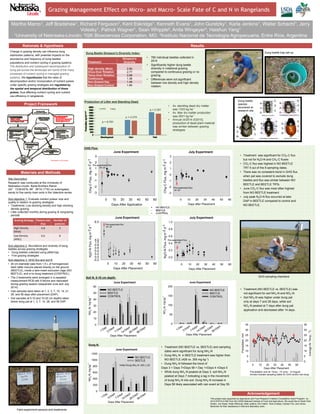
- 1. Martha Mamo1, Jeff Bradshaw1, Richard Ferguson1, Kent Eskridge1, Kenneth Evans1, John Guretzky1, Karla Jenkins1, Walter Schacht1, Jerry Volesky1, Patrick Wagner1, Sean Whipple2, Anita Wingeyer3, Haishun Yang1 1University of Nebraska-Lincoln; 2ISK Biosciences Corporation, MO, 3Instituto Nacional de Tecnología Agropecuaria, Entre Ríos, Argentina Change in grazing density can influence dung distribution patterns, with potential impacts on the abundance and frequency of dung beetles populations and nutrient cycling in grazing systems. The distribution and subsequent decomposition of dung pat across the landscape are some of the many processes of nutrient cycling in managed grazing systems. We hypothesize that the rates of decomposition and/or incorporation of nutrient pulses under specific grazing strategies are regulated by the spatial and temporal distribution of these pulses, thus affecting nutrient cycling and nutrient use efficiency in rangelands. Grazing Management Effect on Micro- and Macro- Scale Fate of C and N in Rangelands Rationale & Hypothesis Materials and Methods Site Description Research was conducted at the University of Nebraska-Lincoln, Barta Brothers Ranch (42°13'28.65"N, 99°38'19.17"W) on subirrigated, sandy to fine sandy loam soils in the Valentine series. Sub-objective 1: Evaluate nutrient pulses’ size and quality in relation to grazing strategies • Treatments: Low stocking density and high stocking density grazing • Litter collected monthly during grazing & nongrazing periods Sub-objective 2: Abundance and diversity of dung beetles across grazing strategies • Dung beetles collected using pitfall trap • Five grazing strategies Sub-objective 3: GHG flux and soil N • 20 cm diameter pats from 1.5 L of homogenized beef cattle manure placed directly on the ground (BEETLE), inside a wire-mesh exclusion cage (NO BEETLE), and a no dung treatment (CONTROL). • The 3 treatments were arranged in a repeated measurement RCB with 8 blocks and replicated during grazing season (sequential June and July 2014). • Gas samples were taken at 1, 2, 3, 7, 10, 14, 21, 28, and 56 days after placement (DAP). • Soil samples at 0-10 and 10-20 cm depths taken below dung pat at 1, 3, 7, 14, 28, and 56 DAP. Results This project was supported by Agriculture and Food Research Initiative Competitive Grant Program no. 2013-67019-21394 from the USDA National Institute of Food and Agriculture. We would like to thank Pam Sutton, Jon Soper, Heidi Hillhouse, Matt Judkins, Erin Hatch, Torie Lindsey, Carolyn Fox, and Jenna Beckman for their assistance in field and laboratory work.. • Treatment was significant for CO2-C flux but not for N2O-N and CH4-C fluxes • CO2-C flux was highest in NO BEETLE TRT 5 out of the 9 sampling dates. • There was no consistent trend in GHG flux when pat was covered to exclude dung beetles and flux was similar between NO BEETLE and BEETLE TRTs. • June CO2-C flux was most often highest from NO BEETLE treatment • July peak N2O-N flux occurred at later DAP in BEETLE compared to control and NO BEETLE. Dung Beetle Simpson's Diversity Index: Acknowledgement Project Framework CHG Flux: Field experiment sensors and treatments *addressed on this poster Treatment Simpson's Diversity High density (Mob) 2.84 Once-Over Rotation 2.77 Twice-Over Rotation 2.69 Continuous 1.36 Non-Grazed Hay 1.46 Non-Grazed Control 1.60 • 760 individual beetles collected in 2014 • Significantly higher dung beetle diversity in rotational grazing compared to continuous grazing or no grazing. • Differences were not significant between low density and high density rotation. Production of Litter and Standing Dead: • Av. standing dead dry matter was 1333 kg ha-1 • Av. litter dry matter production was 2631 kg ha-1 • Annual (4/2014-3/2015), production of dead plant material was similar between grazing strategies June Experiment Days After Application 0 10 20 30 40 50 60 CH4-CFlux,mgm-2d-1 -3 -2 -1 0 1 2 3 Pre-experiment flux N= 24 July Experiment Days after Placement 0 10 20 30 40 50 60 CH4-CFlux,mgm-2d-1 -3 -2 -1 0 1 2 3 Pre-experiment flux N= 24 July Experiment Days After Placement 0 10 20 30 40 50 60 N2O-NFlux,mgm-2d-1 0.0 0.2 0.4 0.6 0.8 1.0 Pre-experiment Flux N= 24 June Experiment Days After Placement 0 10 20 30 40 50 60 N2O-NFlux,mgm-2d-1 -0.2 0.0 0.2 0.4 0.6 0.8 1.0 4.0 6.0 Pre-experiment flux N= 24 Soil N, 0-10 cm depth: Dung beetle trap set-up June Experiment Days After Placement 1-Day 3-Days 7-Days 14-Days 28-Days 56-Days NH4-N,mgkg -1 0 10 20 30 40 50 60 NO BEETLE BEETLE CONTROL June Experiment Days After Placement 1-Day 3-Days 7-Days 14-Days 28-Days 56-Days NO3-N,mgkg -1 0 50 100 150 200 NO BEETLE BEETLE CONTROL June Experiment Days After Placement 1-Day 3-Days 7-Days 14-Days 28-Days 56-Days NH4-N,mgkg -1 0 200 400 600 800 1000 1200 NO BEETLE BEETLE Dung N: Grazing Strategy Pasture size (ha) Number of pastures High Density (Mob) 6.8 2 Low Density (4PR1) 0.6 8 Dung beetle species recovered at research site • Treatment (NO BEETLE vs. BEETLE) was not significant for soil NH4-N and NO3-N • Soil NH4-N was higher under dung pat only at days 7 and 28 days, while soil NO3-N peaked at 7 days after dung pat application and decreased after 14 days. Initial Dung NH4-N: 424 + 22 • Treatment (NO BEETLE vs. BEETLE) and sampling dates were significant for dung NH4-N • Dung NH4-N in BEETLE treatment was higher than NO BEETLE (429 vs. 355 mg kg-1) • Dung NH4-N followed the trend of Days 3 > Days 7=Days 56 > Day 1=Days 4 =Days 5 • While dung NH4-N peaked at Days 3, soil NH4-N peaked at Days 7 indicating a lag in the movement of dung NH4-N into soil. Dung NH4-N increase in Days 56 likely associated with rain event at Day 55. Precipitation and Air Temp., 10 June - 13 August Arrows indicate sampling dates for GHG and/or soil-dung Days After Placement 0 10 20 30 40 50 60 Precipitaion,mm 0 5 10 15 20 25 30 35 AverageAirTemp., o C 0 5 10 15 20 25 30 35 GHG sampling chambers