Enhancing Productivity and Livelihoods among Smallholders Irrigations through...
NSERL Poster Board_edi1
1. Cesar Bustos, Diane Stott, Ph.D*
USDA-ARS National Soil Erosion Laboratory, West Lafayette, IN 47907
Abstract
Although soil conservation practices have long been used, only recently has there
been an effort to quantify the impacts of these practices on soil quality. This Study
uses the Soil Management Assessment Framework (SMAF) to assess soil quality in
a field in the Topashaw Canal Watershed in North Central Mississippi. Soil was
sampled in a field along 13 transects perpendicular to gullies at two depths by
USDA scientists (0-5 and 5-15 cm). The soil was Falaya silt loam (poorly drained,
moderately permeable soil formed on loess). Ten of 25 soil quality indicators
encompassing physical, chemical, biological/biochemical and nutrient
characteristics were used in the soil quality assessment using the (SMAF). The
overall soil quality index (SQI) was 0.648 (with 1.00 representing optimal
conditions) which indicates poor soil quality. When the SQI was separated into
sectors, the physical sector SQI was 0.642, biological SQI was 0.358, chemical SQI
was 0.938, and nutrient SQI was 0.941. Chemical and nutrient values are relatively
high in comparison to physical and the biological/biochemical sectors due to soil
amendment practices by farmers and land managers designed to correct nutrient
and chemical issues. These same practices are unable to easily correct for deficits
in the physical and biological sectors. According to these results, the average soil
quality is poor. Soil conservation methods are important for future generations in the
long term and as well as in current day issues which include runoff into nearby
water sources. Introduction
• Location where data was analyzed:
• USDA-ARS National Soil Erosion Laboratory, West Lafayette, IN
47907
• Study Site: Topashaw Watershed, Chickasaw, Mississippi
• 270 soil samples were taken from the watershed by USDA scientists
• Each sample point was taken from two different depths
• Gullies were along the watershed due to erosion. Determining the correlation
between
gullies and soil quality are important to soil conservation methods.
• This would aid future generations and as well as current day
issues with runoff.
• Biochemical, Chemical, Nutrients and Physical parameters were analyzed to
determine Soil Quality
• Based on these test, the overall soil quality was poor.
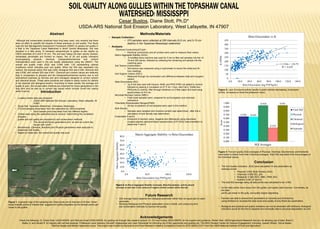
Figure 4: The soil quality (SQI) averages of Physical, Chemical, Biochemical, and Nutrients
were taken to obtain have their individual averages. Total SQI was taken from the averages of
the individual values.
Conclusion
• The Soil Quality Indicators (SQI) were calculated 10 soil parameters as
average scores:
• Physical: 0.642 (Bulk Density, AGG)
• Chemical: 0.938 (EC, pH)
• Biological: 0.358 (SOC, MBC, PMN, BG)
• Nutrient: 0.941 (P and K)
• The total SQI average along all data points was calculated to be: 0.642.
• As the data points move away from the gullies, soil quality does improve. Conversely, as
the data
points get closer to the gully, soil quality begins degrading.
• Farmers are able to amend their parameters of nutrients and chemical by
using fertilizers to increase the total score and quality of only these two parameters.
• Biological and physical soil quality indicators can not be amended with fertilizers. Biological
indicators would be the first to degrade and eventually lead to physical degradation as well.
0.648 0.642
0.938
0.358
0.941
0.000
0.100
0.200
0.300
0.400
0.500
0.600
0.700
0.800
0.900
1.000
1
Score
SQI Averages
Total SQI
Physical
Chemical
Biological
Nutrients
0.0
10.0
20.0
30.0
40.0
50.0
60.0
70.0
80.0
0.0 50.0 100.0 150.0
MacroAggregateStability
Beta-Glucosidase (mg PNP/kg/hr)
Macro Aggregate Stability vs Beta-Glucosidase
Acknowledgements
I thank the following: Dr. Diane Stott, USDA-NSERL and Rhonda Graef USDA-NSERL for guiding me through this research project. Dr. Chi-hua Huang USDA-NSERL for his support and guidance. Robert Well, USDA Agricultural Research Service, for allowing use of data. Brant C.
, Bailey U. and Gerald R. for helping with soil test analysis. Professors Laura Sanders, Kenneth Voglesonger and Jean Hemzacek for informing me of this opportunity and guiding me. The NEIU Student Center for Science Engagement, Including, Joseph Hibdon, Sylvia Atsalis,
Paloma Vargas and Marilyn Saavedra-Leyva. This project was funded by Agriculture and Food Research initiative Competitive Grant no.2010-38422-21271 from the USDA National Institute of Food and Agriculture.
Figure 2: As Macro Aggregate Stability increases, Beta-Glucosidase activity should
increase as well due to the amount of organic matter content within the soil.
Figure 1: A general map of the sampling site. Data points are at intervals of 25 feet. Green
areas indicate points of interest that suggest soil quality degrades as the sample points get
closer to the gullies.
y = 2.1328x + 128.79
R² = 0.629
0
50
100
150
200
250
300
350
400
450
0.0 20.0 40.0 60.0 80.0 100.0 120.0 140.0
K(PPM)
Beta-Glucosidase (mg PNP/kg/hr)
Beta-Glucosidase vs K
Methods/Materials
• Sample Collection :
• 270 samples were collected at 25ft intervals (0-5 cm, and 5-15 cm
depths) in the Topashaw Mississippi watershed
• Analysis:
Electrical Conductivity(EC)/pH:
• Electrical conductivity and pH probes were used to measure thee values.
Macro Aggregate Stability (AGG) :
• A modified sieve machine was used for 5 min to filter soil samples into the 10
18 and 200 sieves, followed by collecting the remaining soil sample into the
matching pans.
Soil Texture (Hydrometer):
• Soil texture was measured using a hydrometer to record the initial and 24
hour readings.
Soil Organic Carbon (SOC):
• Measured through dry combustion and difference between total and inorganic
carbon.
Beta-Glucosidase (BG):
• 1g of soil was used with toluene, MUB, and PNG (PNG not added to control)
followed by placing in incubation at 37°C for 1 hour. Add CaCl2 THAM and
PNG(only to control), filter through whatman no.2 filter paper and read using
spectrometer at 410 nm.
Microbial Biomass Carbon (MBC):
• Field-moist samples were prepared for soil fumigation and chemical
extractions
Potentially Mineralizable Nitrogen(PMN):
• 28 day incubations of soil samples were used in this method.
Bulk Density:
• Samples were weighed and moisture content was determined,, after this a
calculation of bulk density was determined.
Extractable P and K:
• Extraction of solution using reagents and afterwards using inductively
coupled plasma optical emission spectrometry (ICP-OES) instrumentation to
determine P and K
Figure 3: Lack of enzyme activity results in plant nutrition decreasing. As enzyme
activity increases so does the potassium value.
Future Research
• SQI average highly depends the biological parameter rather than an equal part on each
parameter.
• Studying Biological and Physical parameters more in depth, and using long term
soil conservation methods to improve the quality.