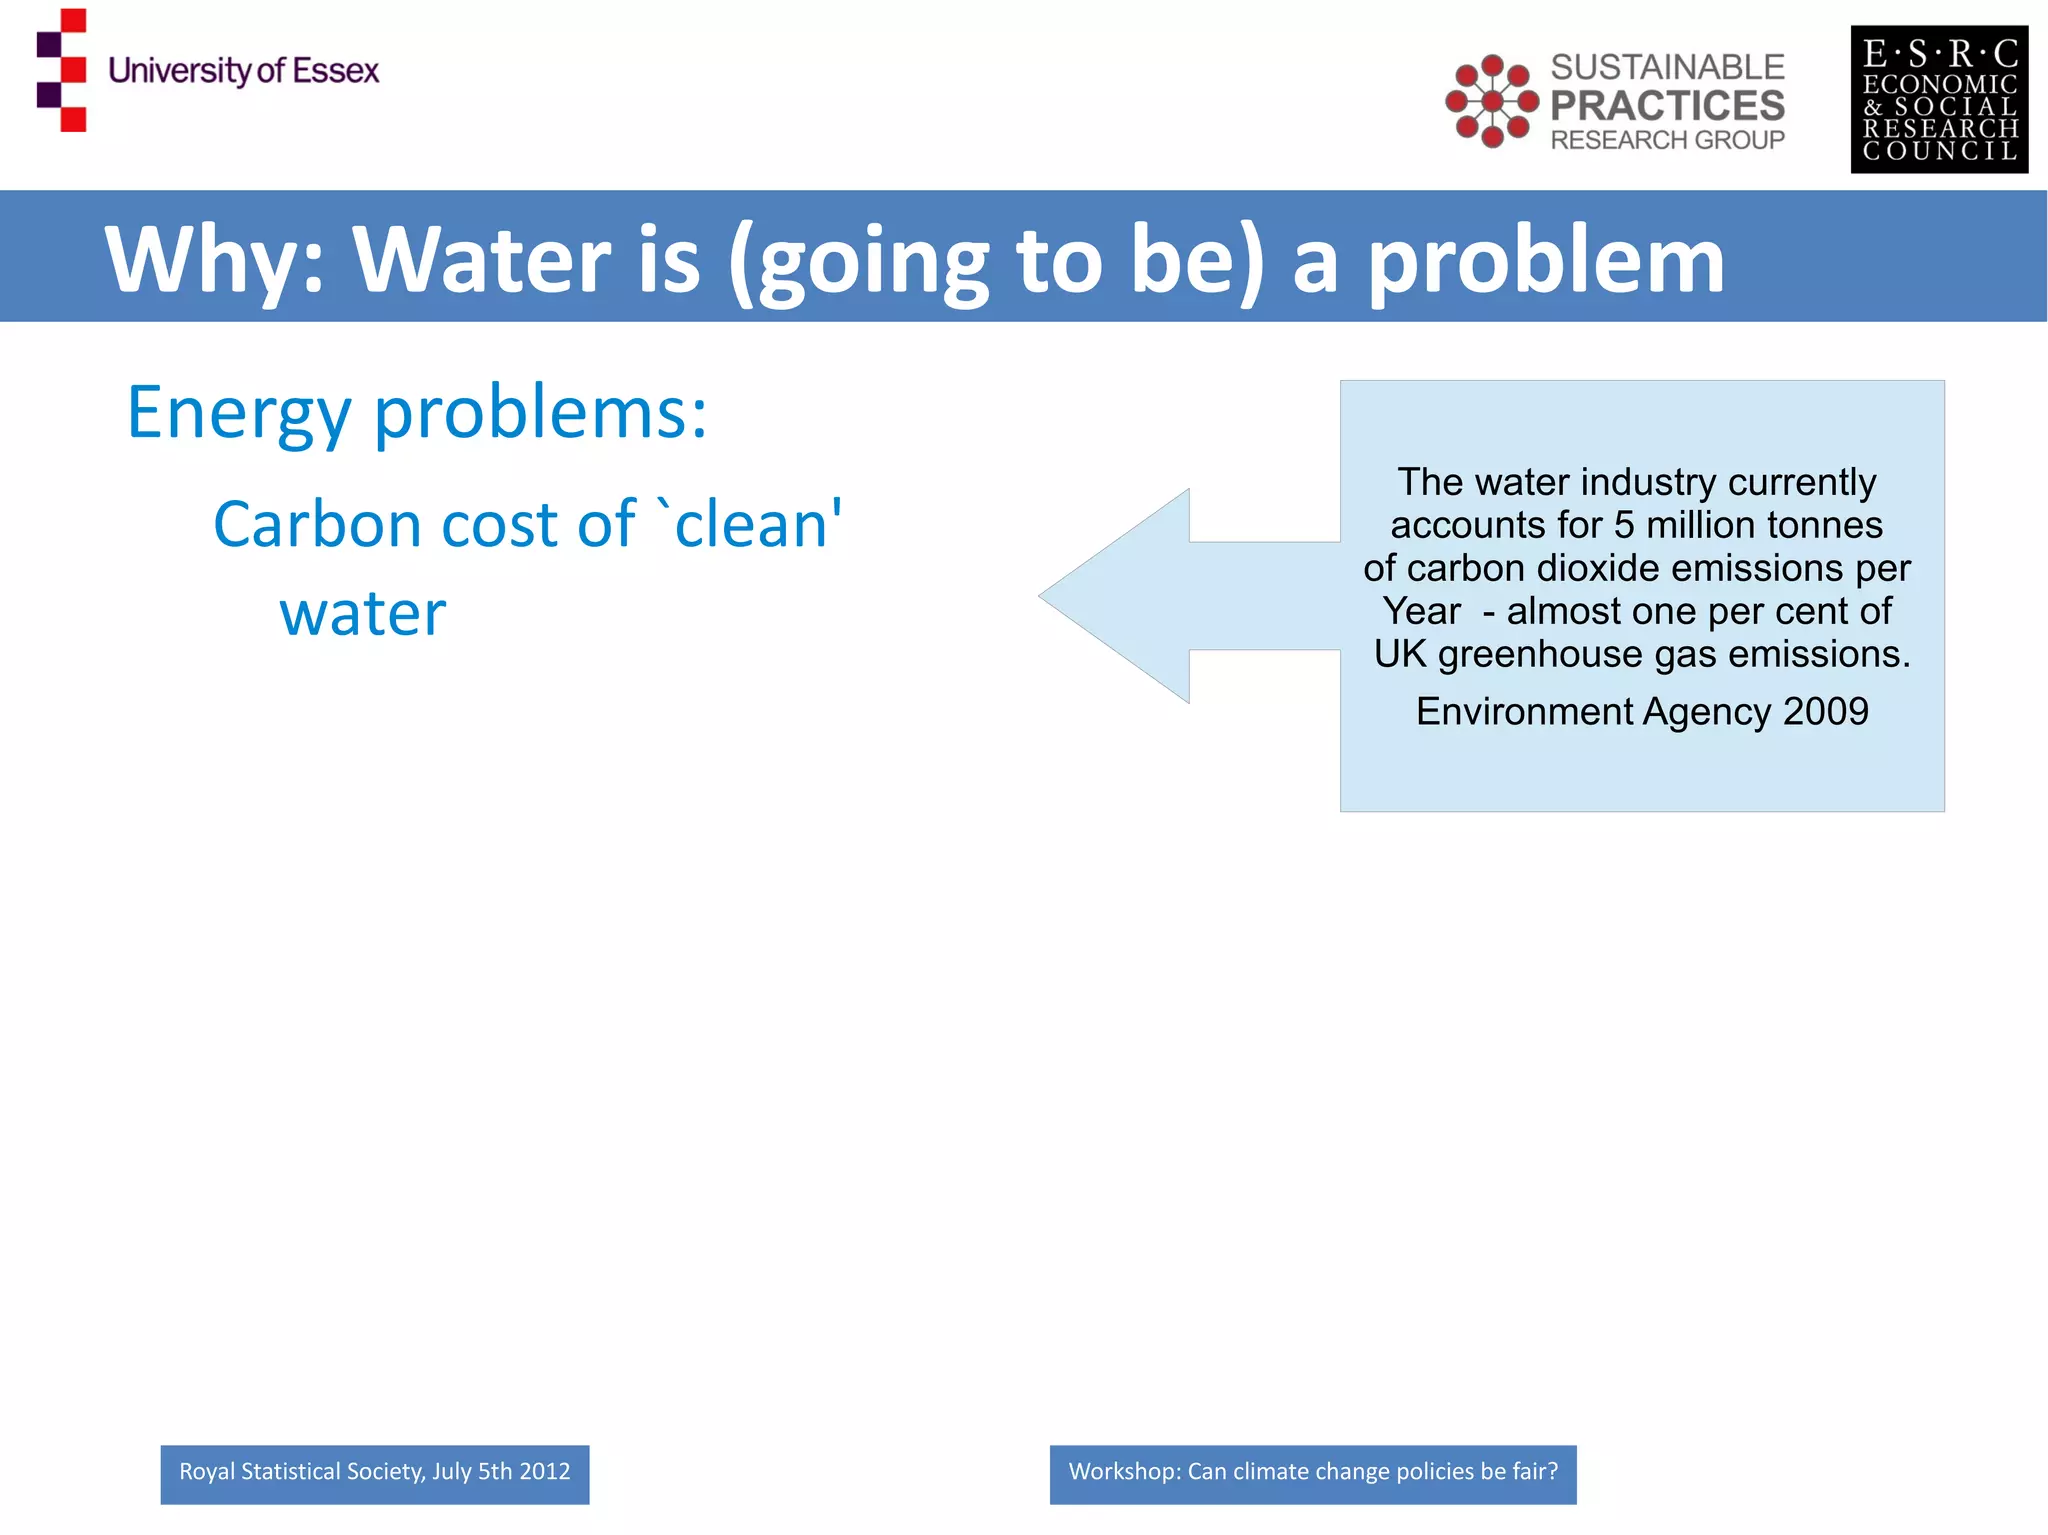
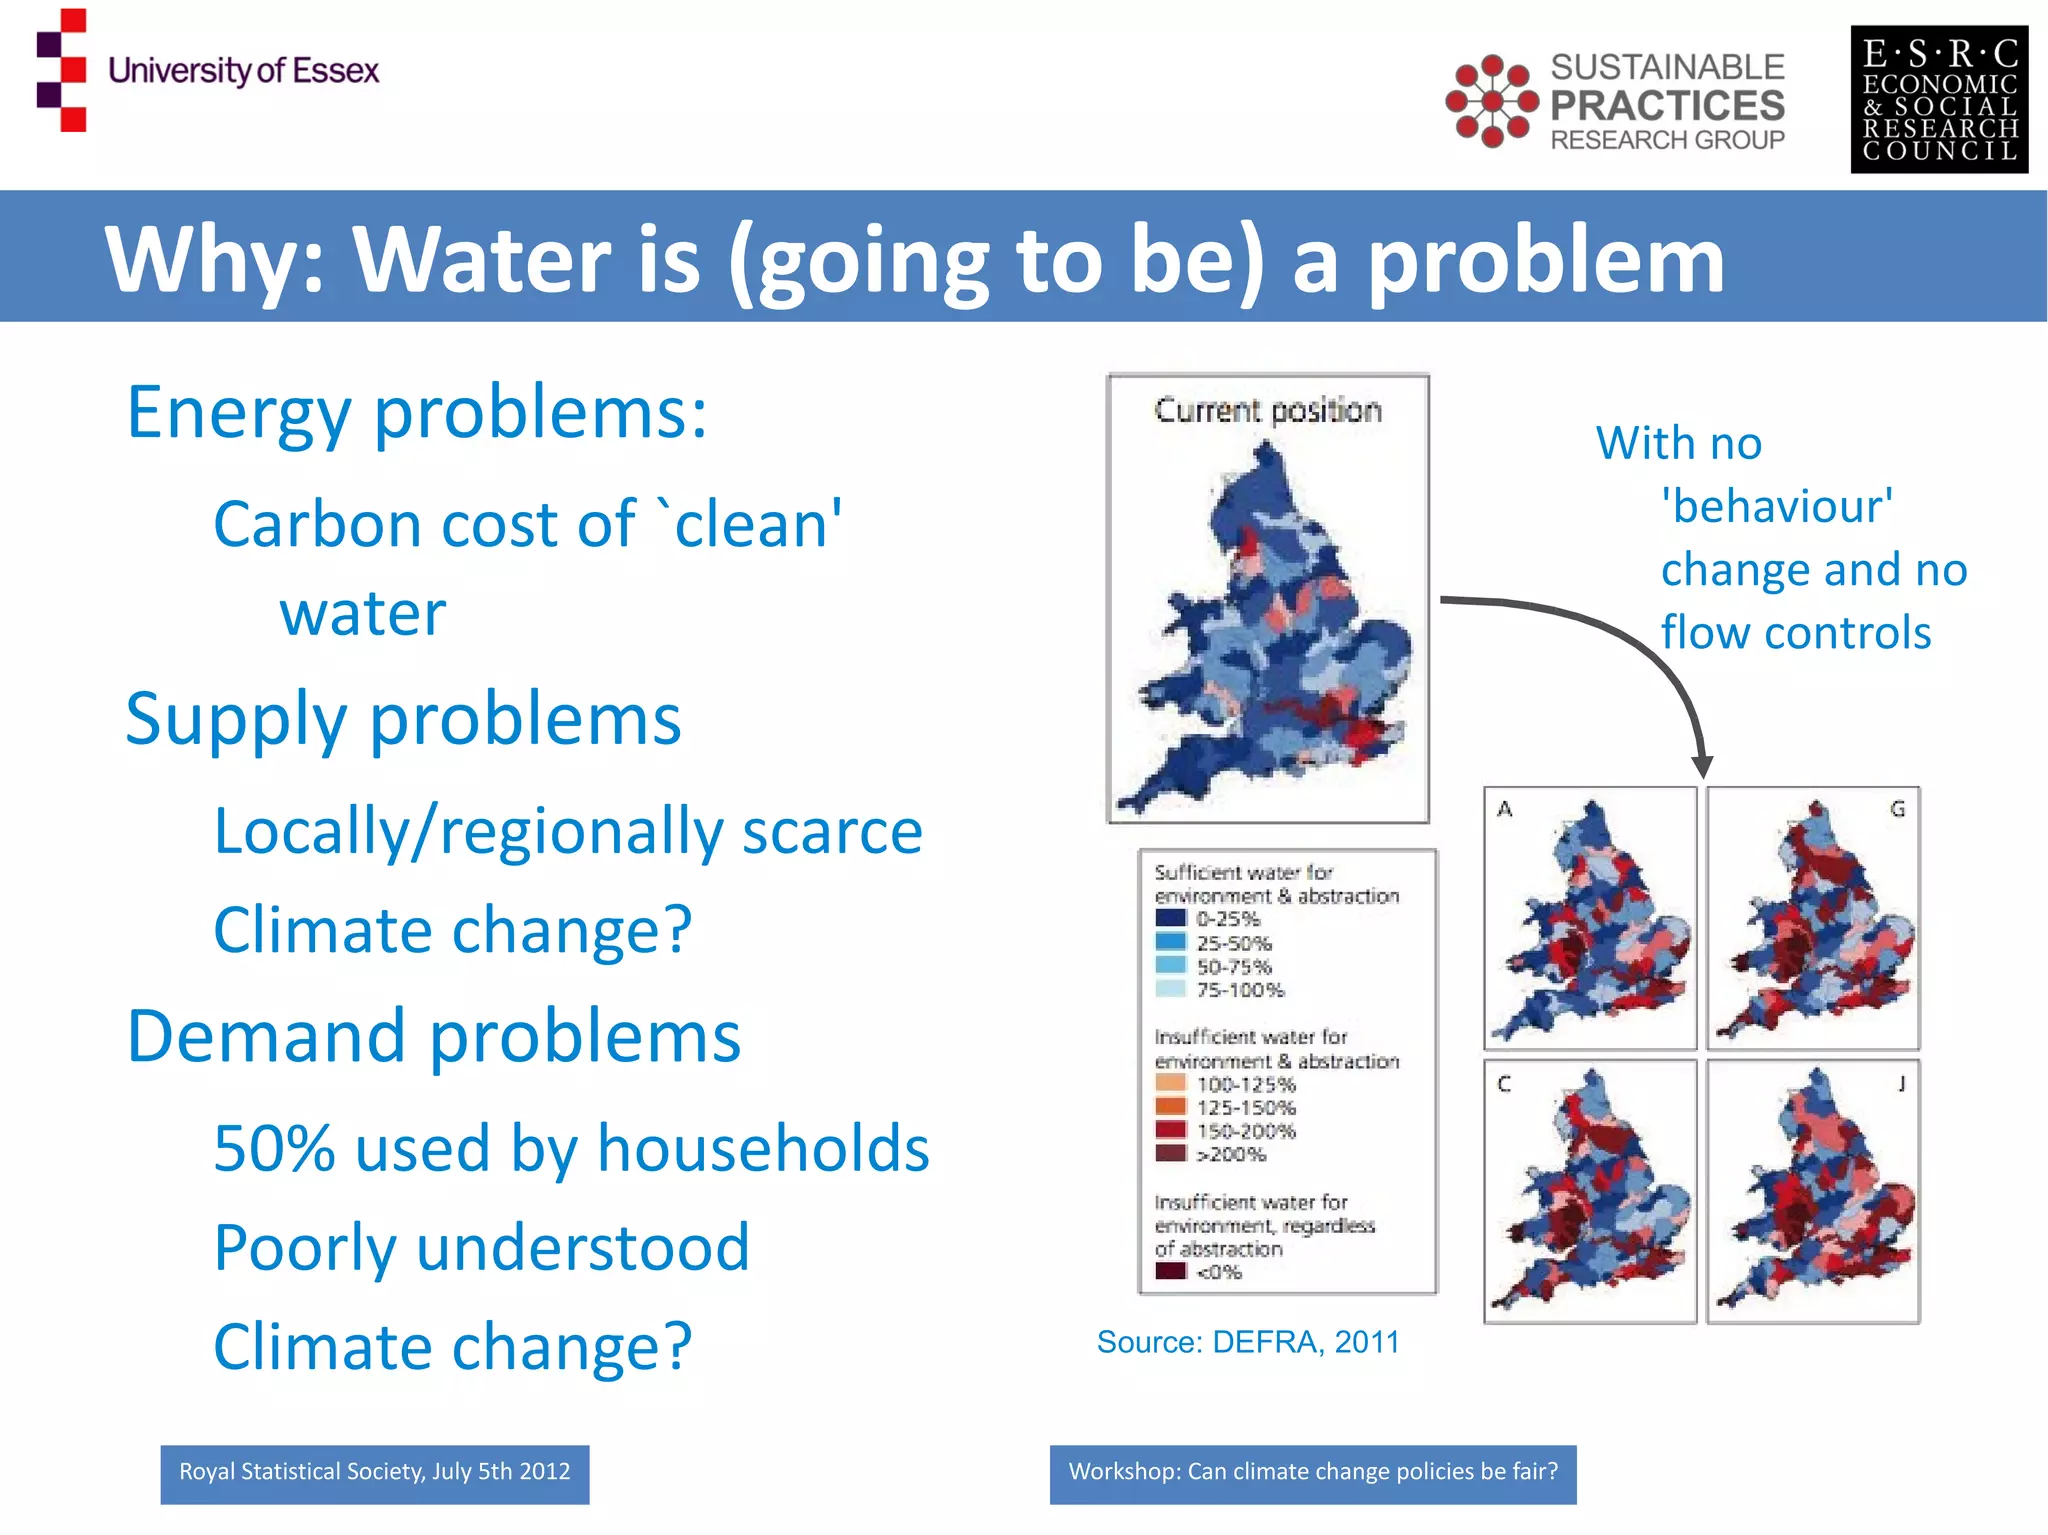
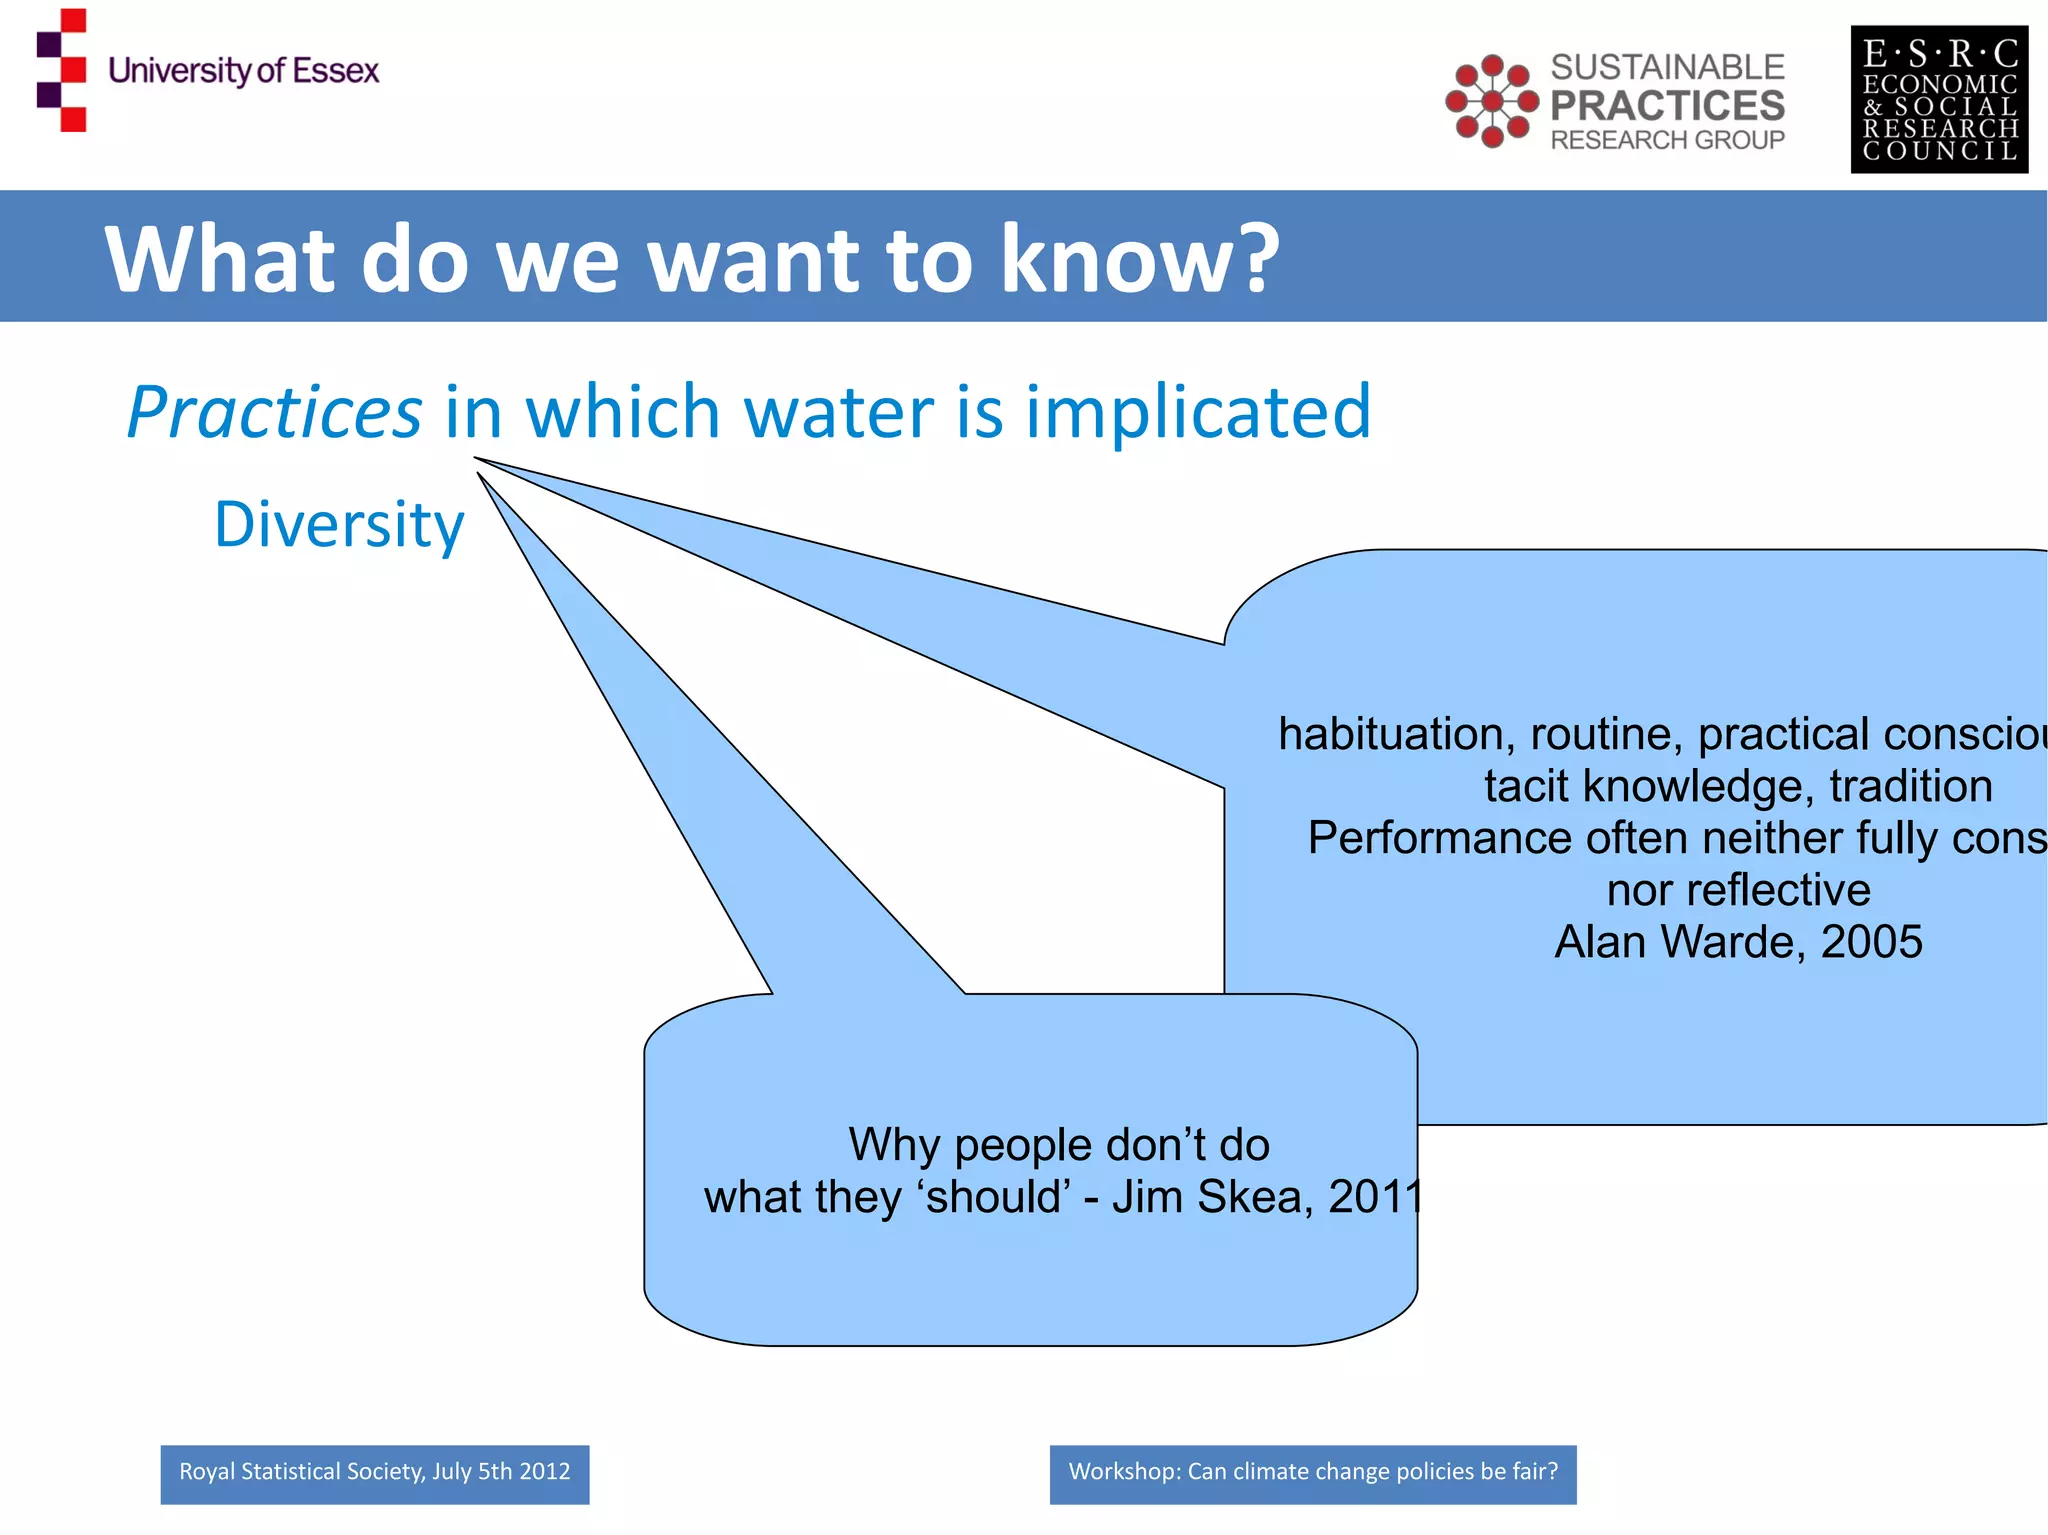
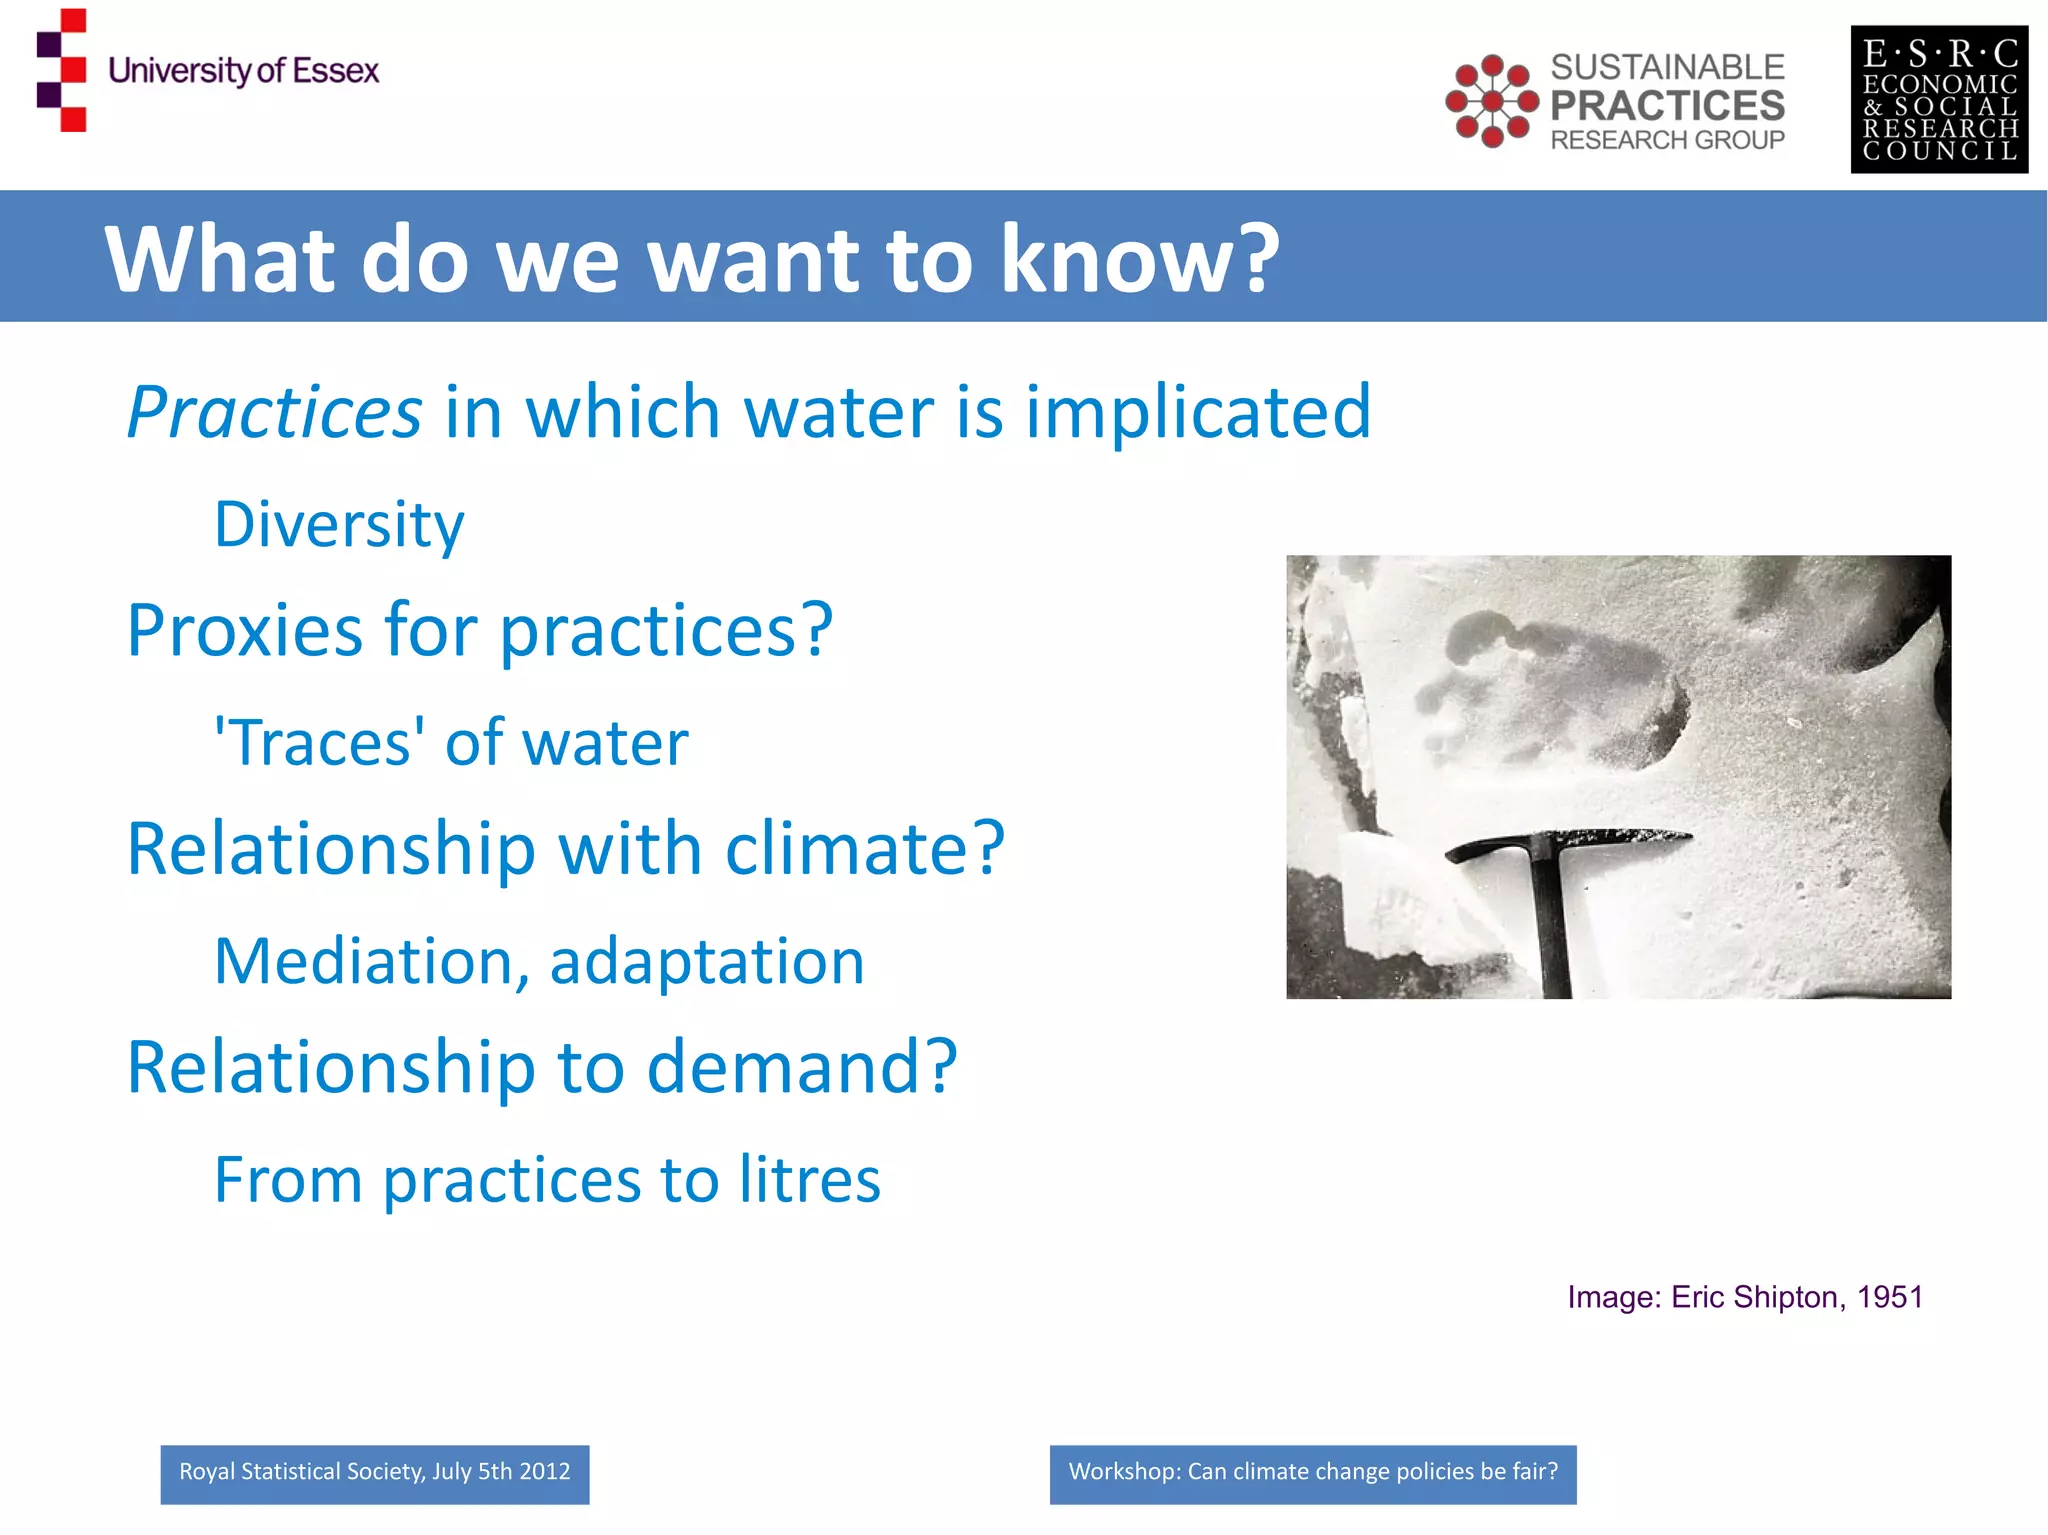
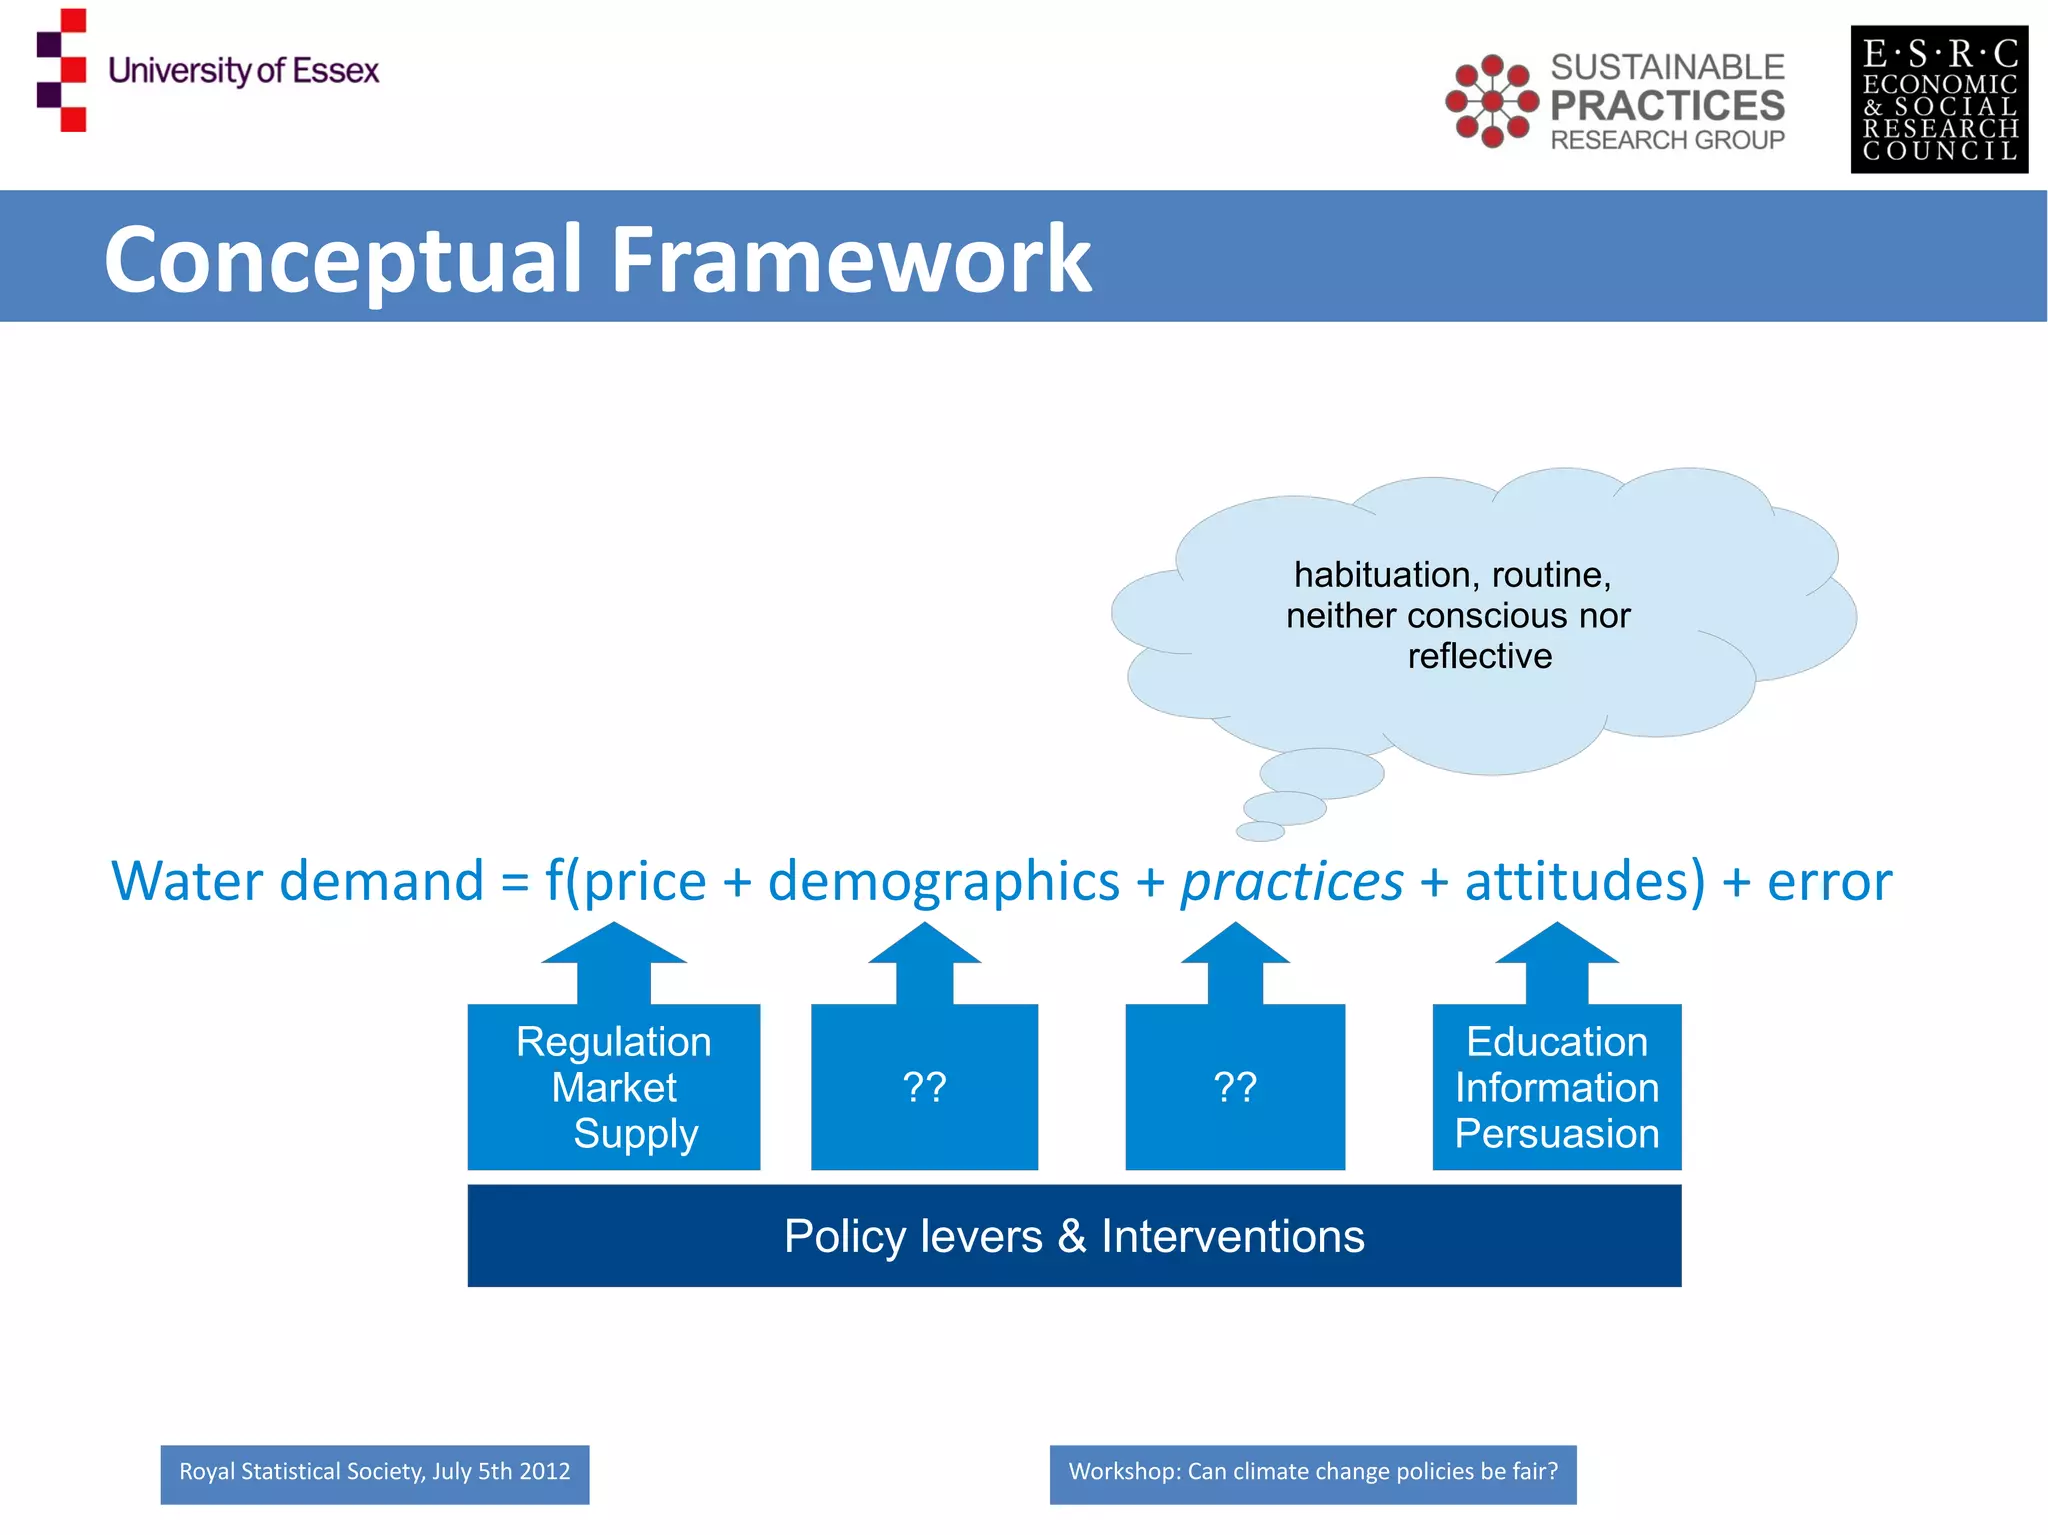
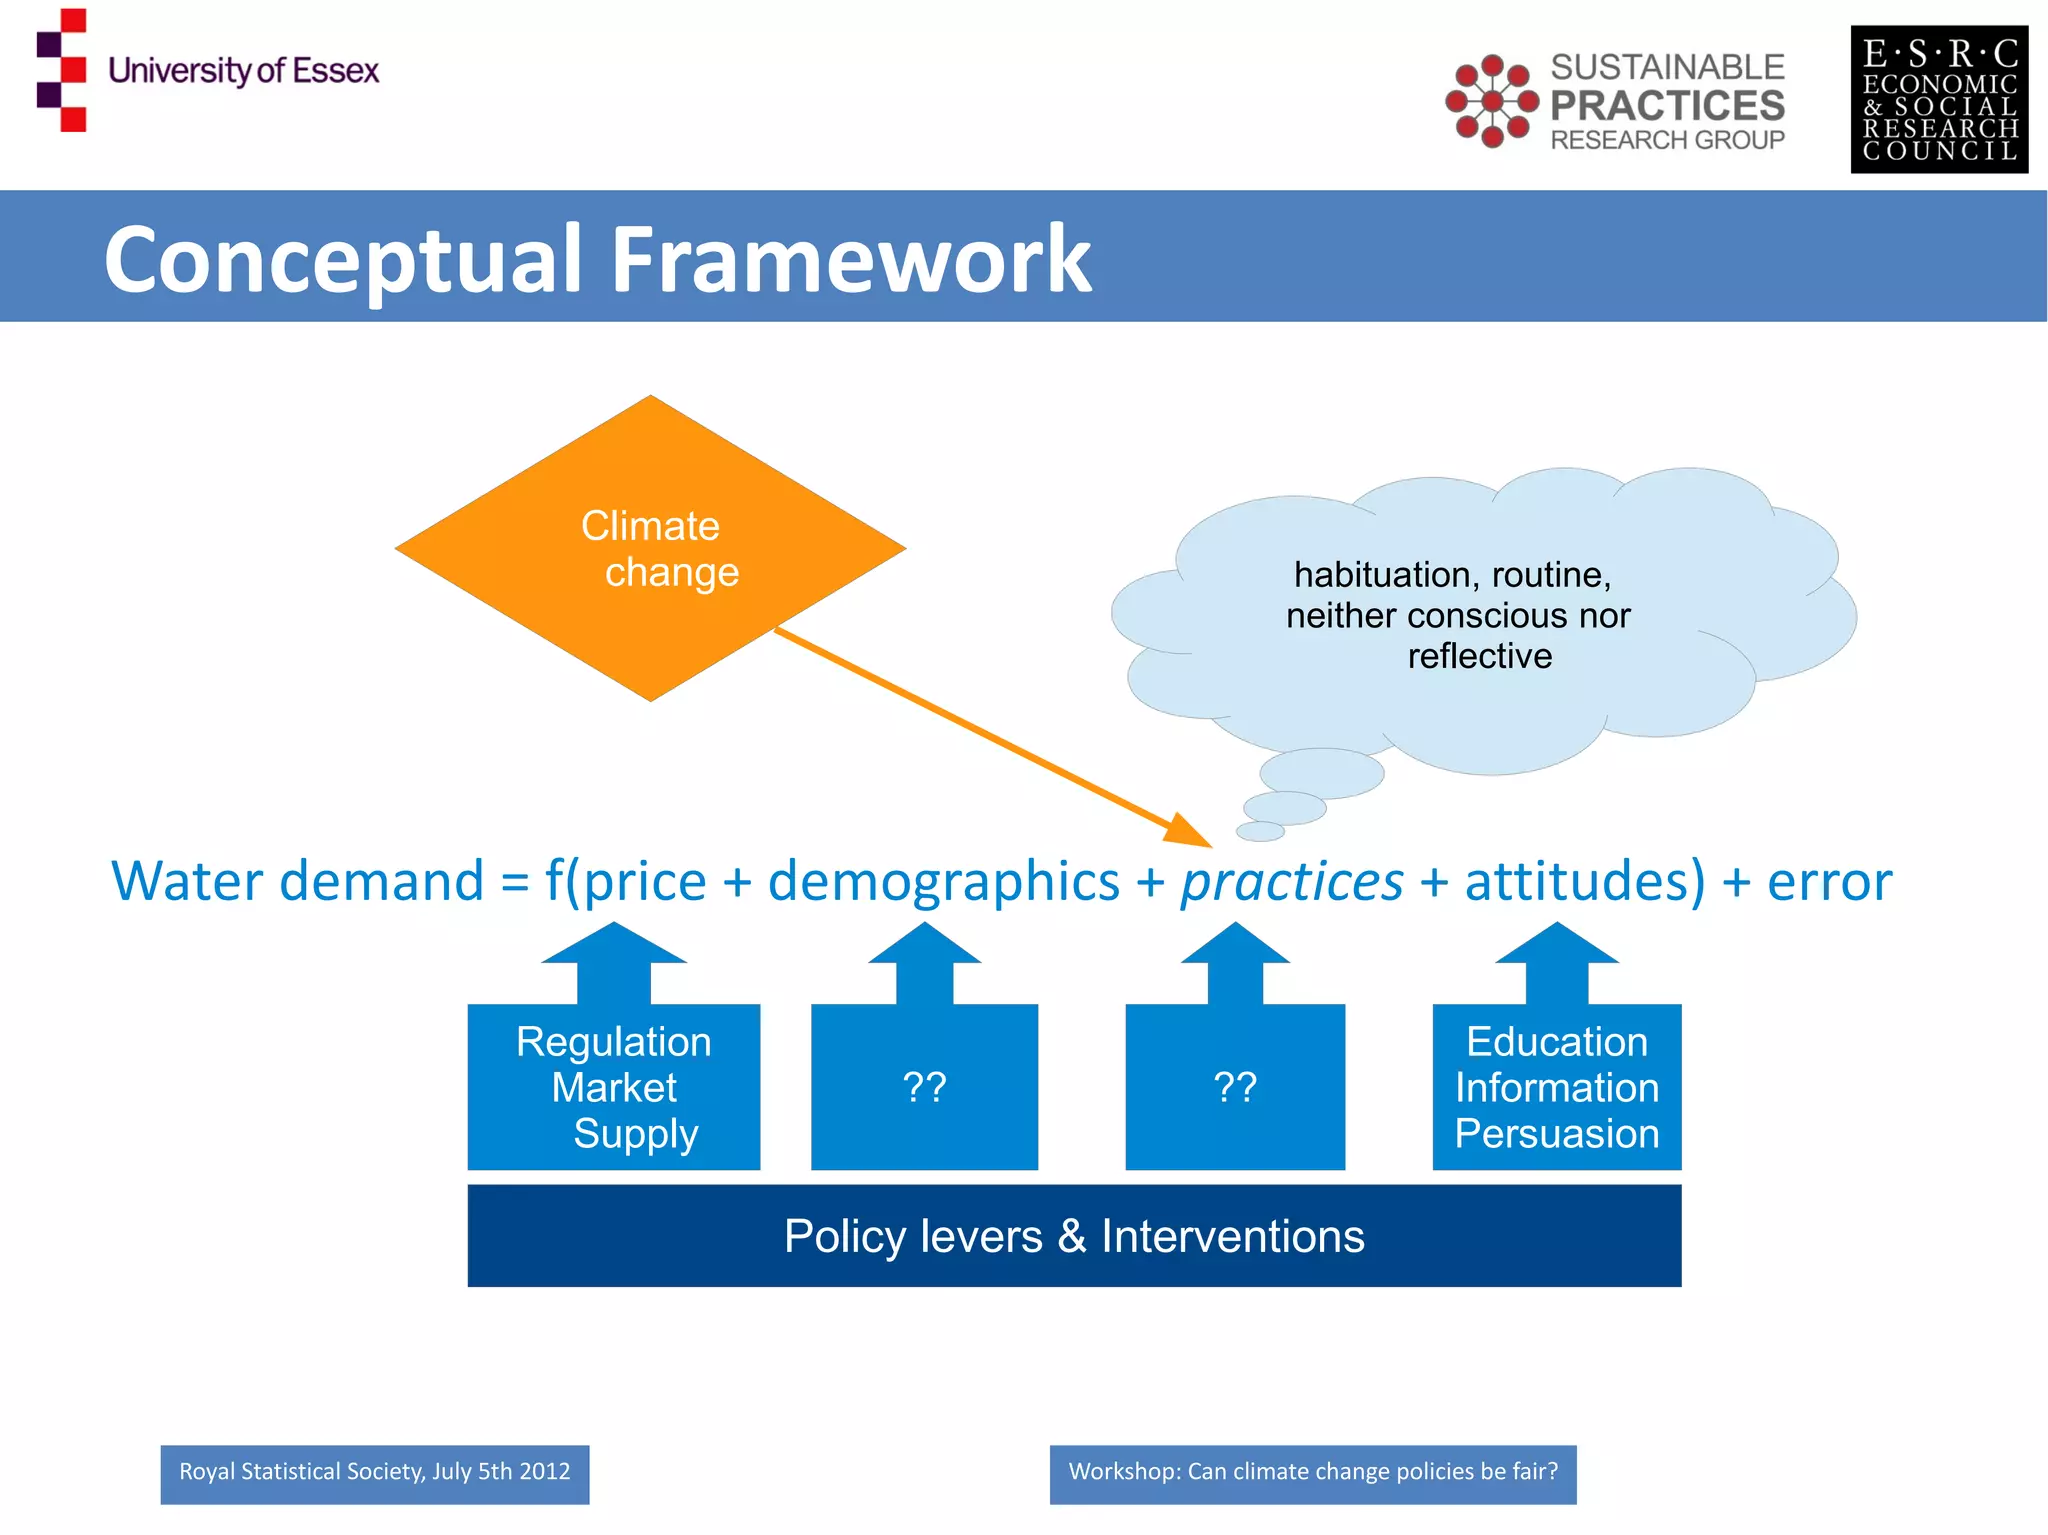
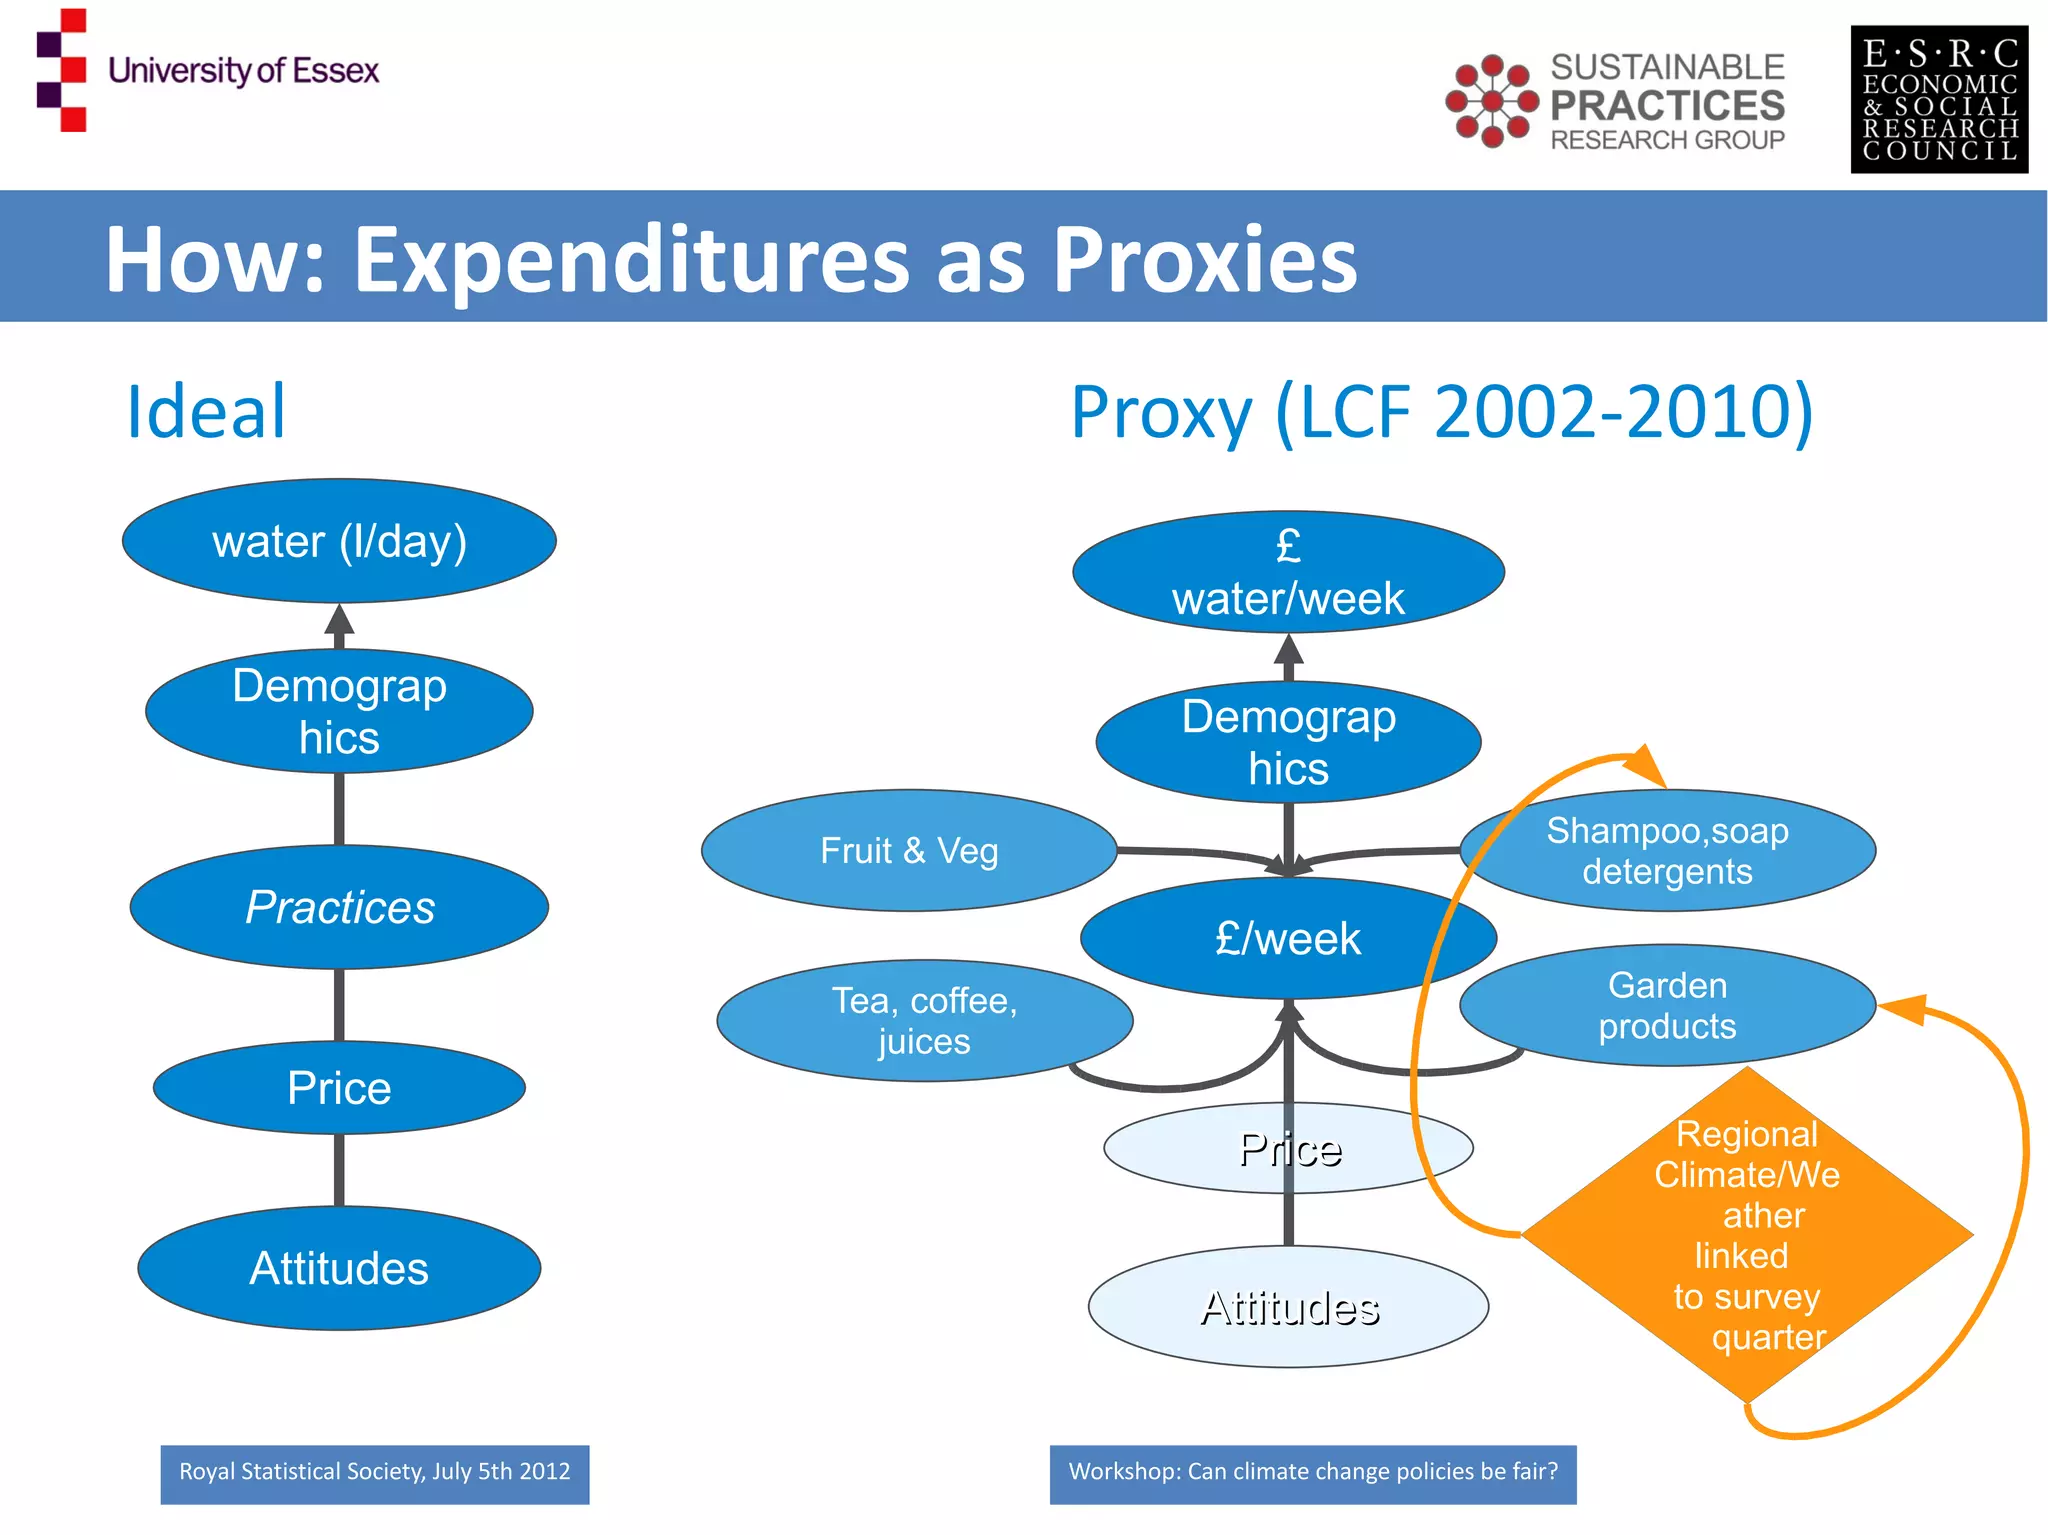
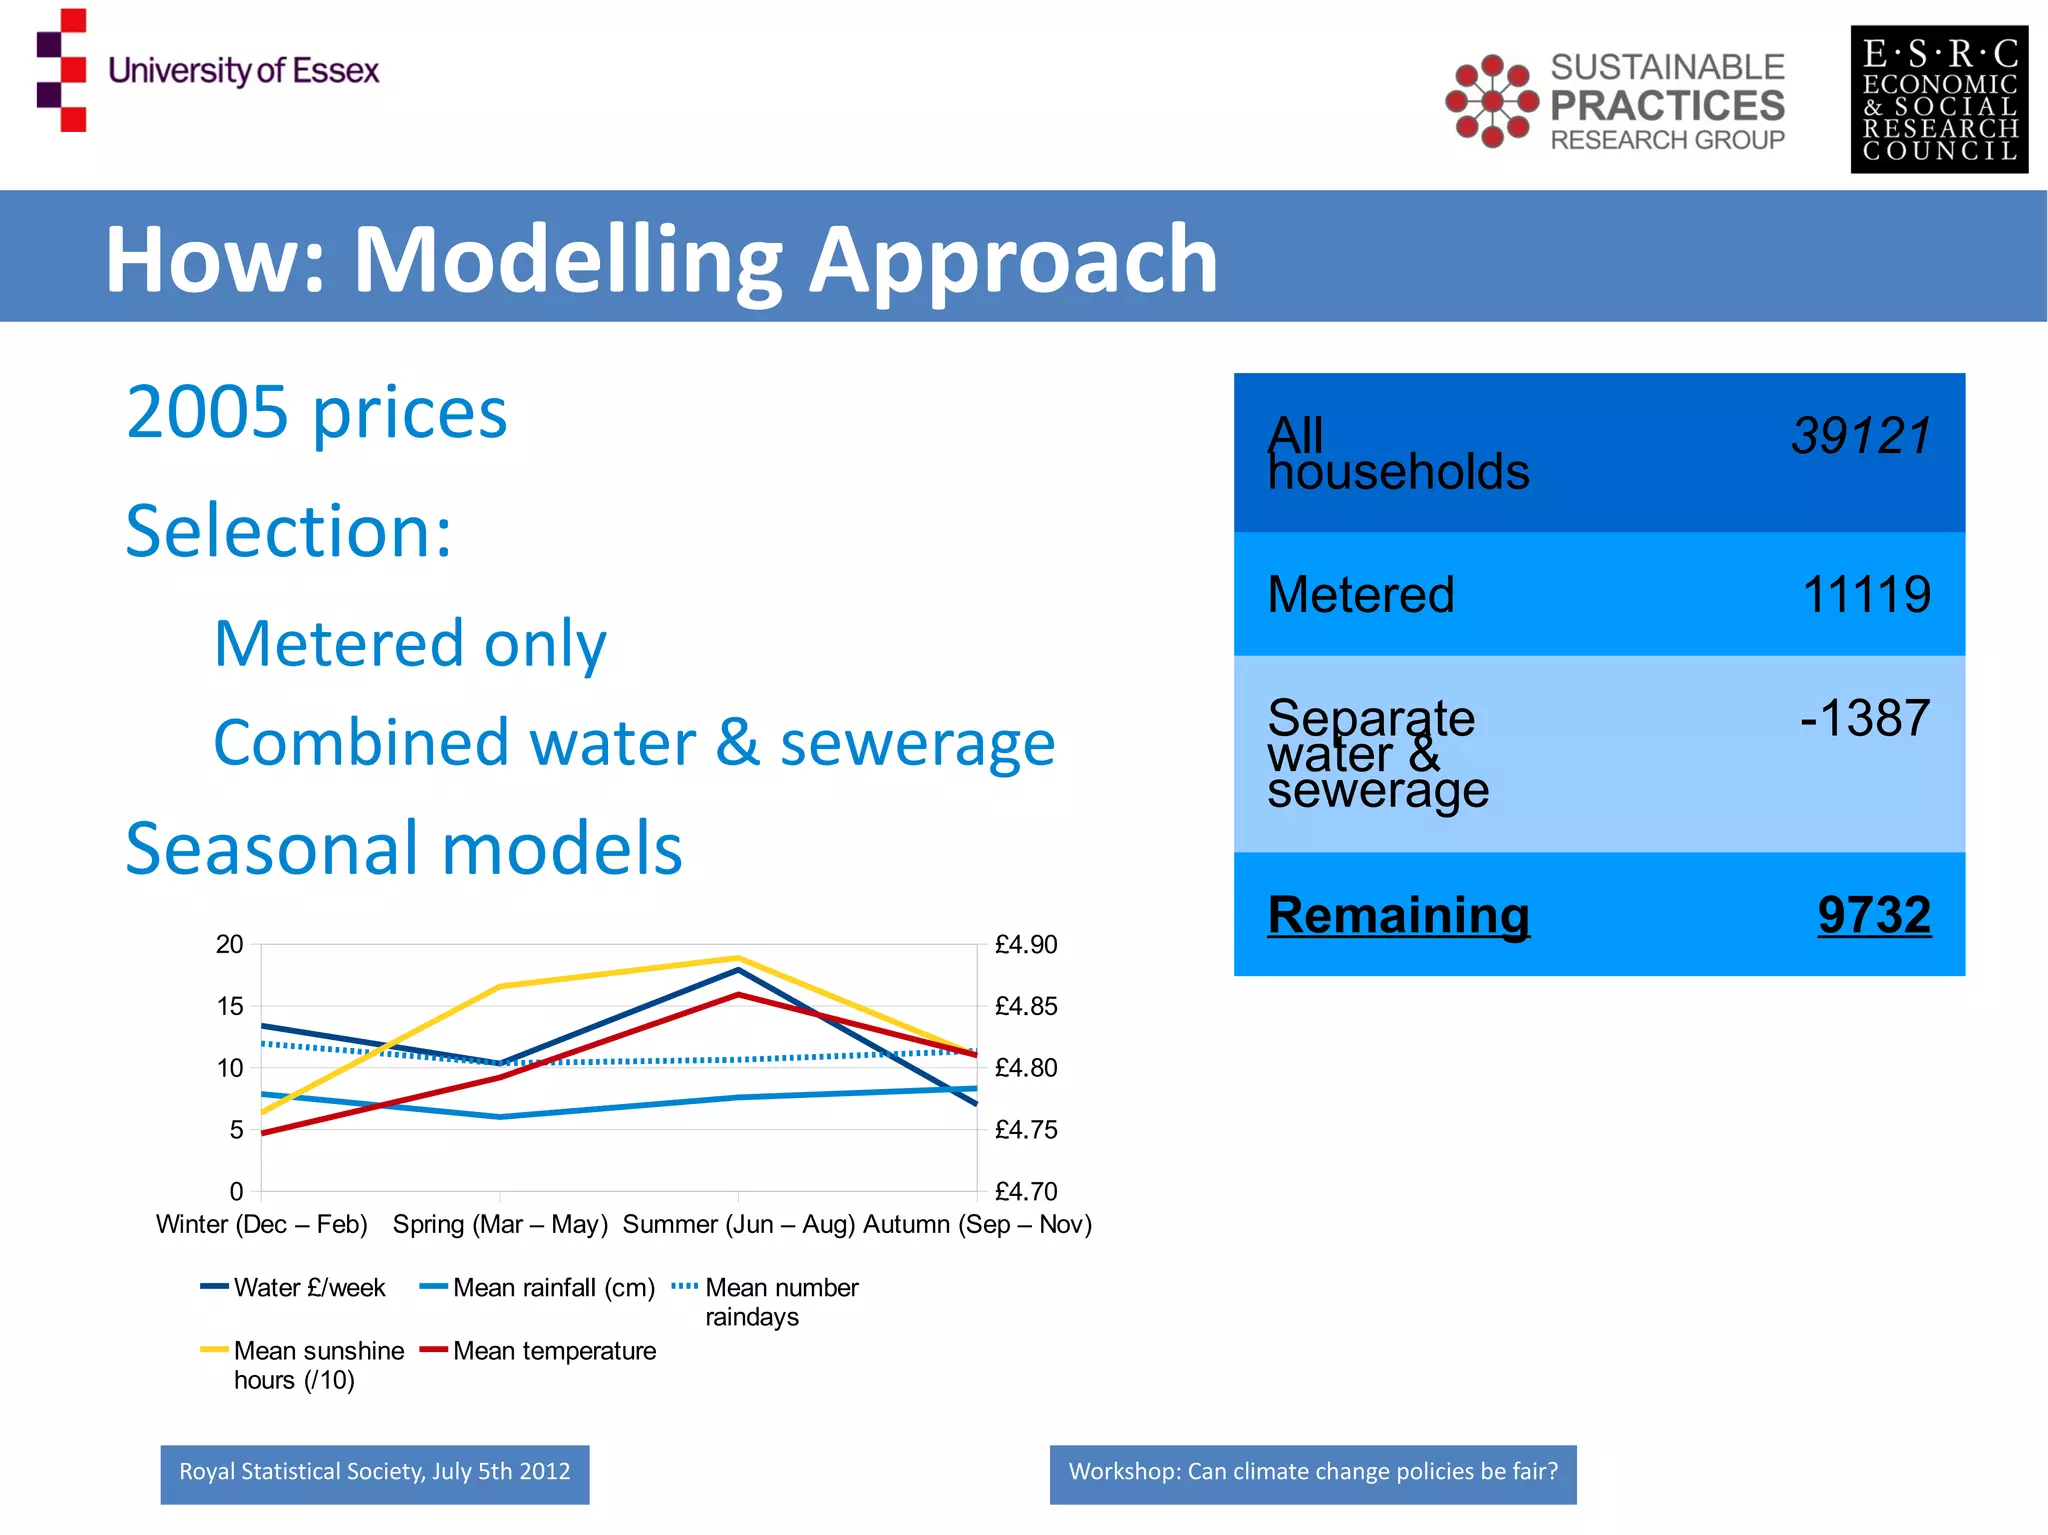
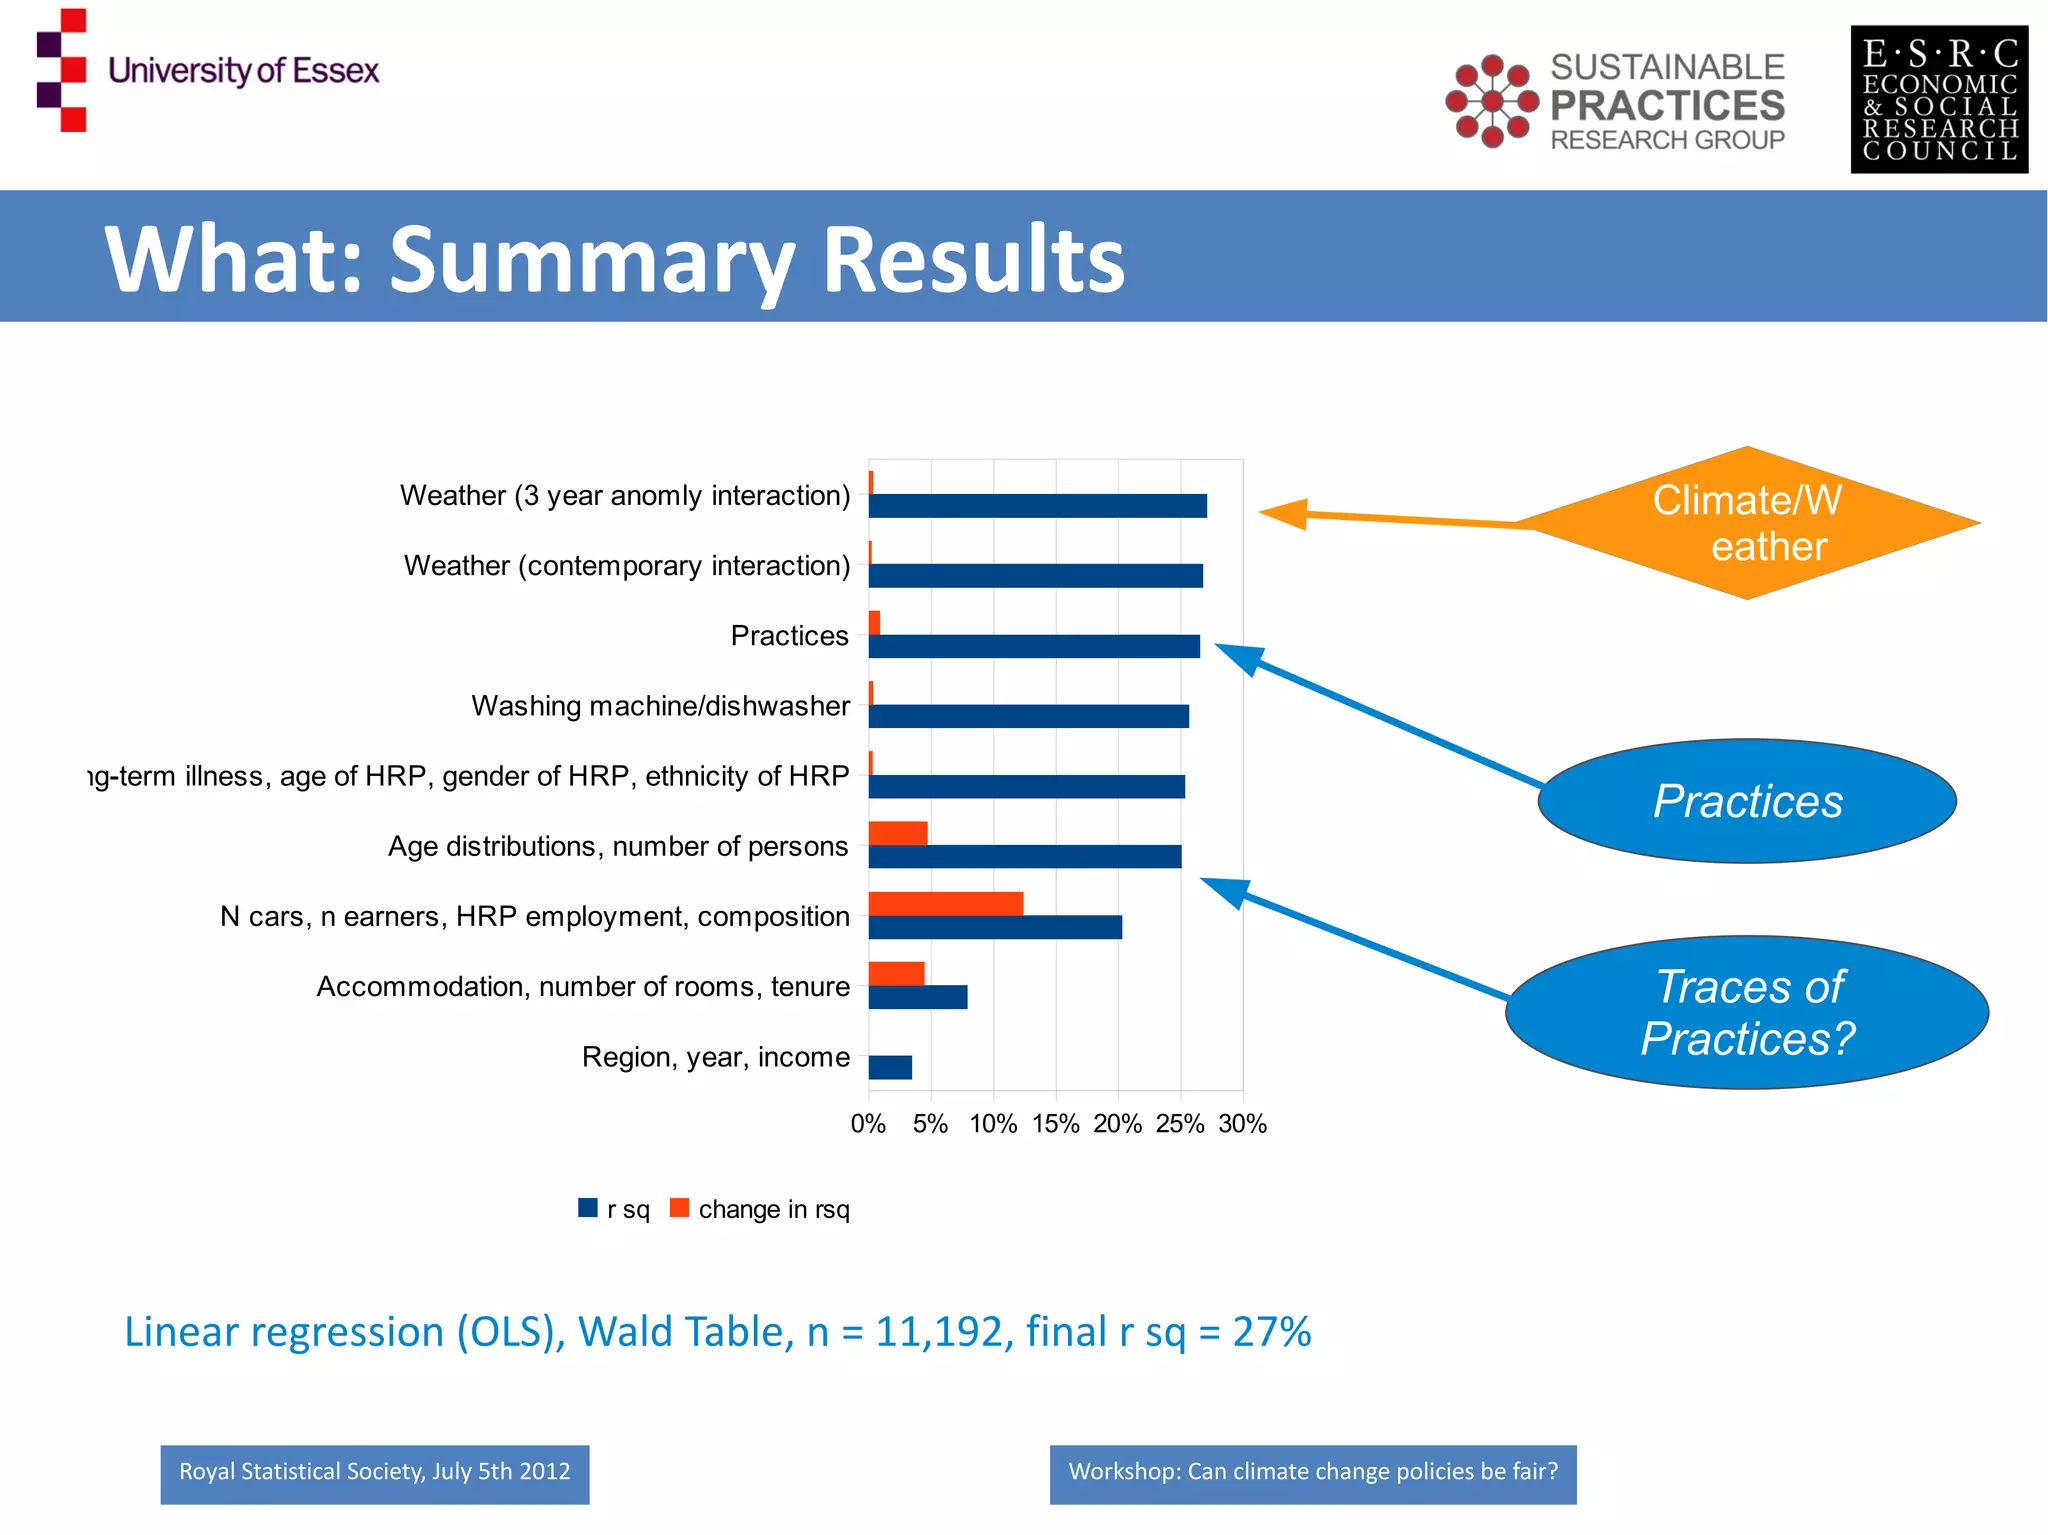
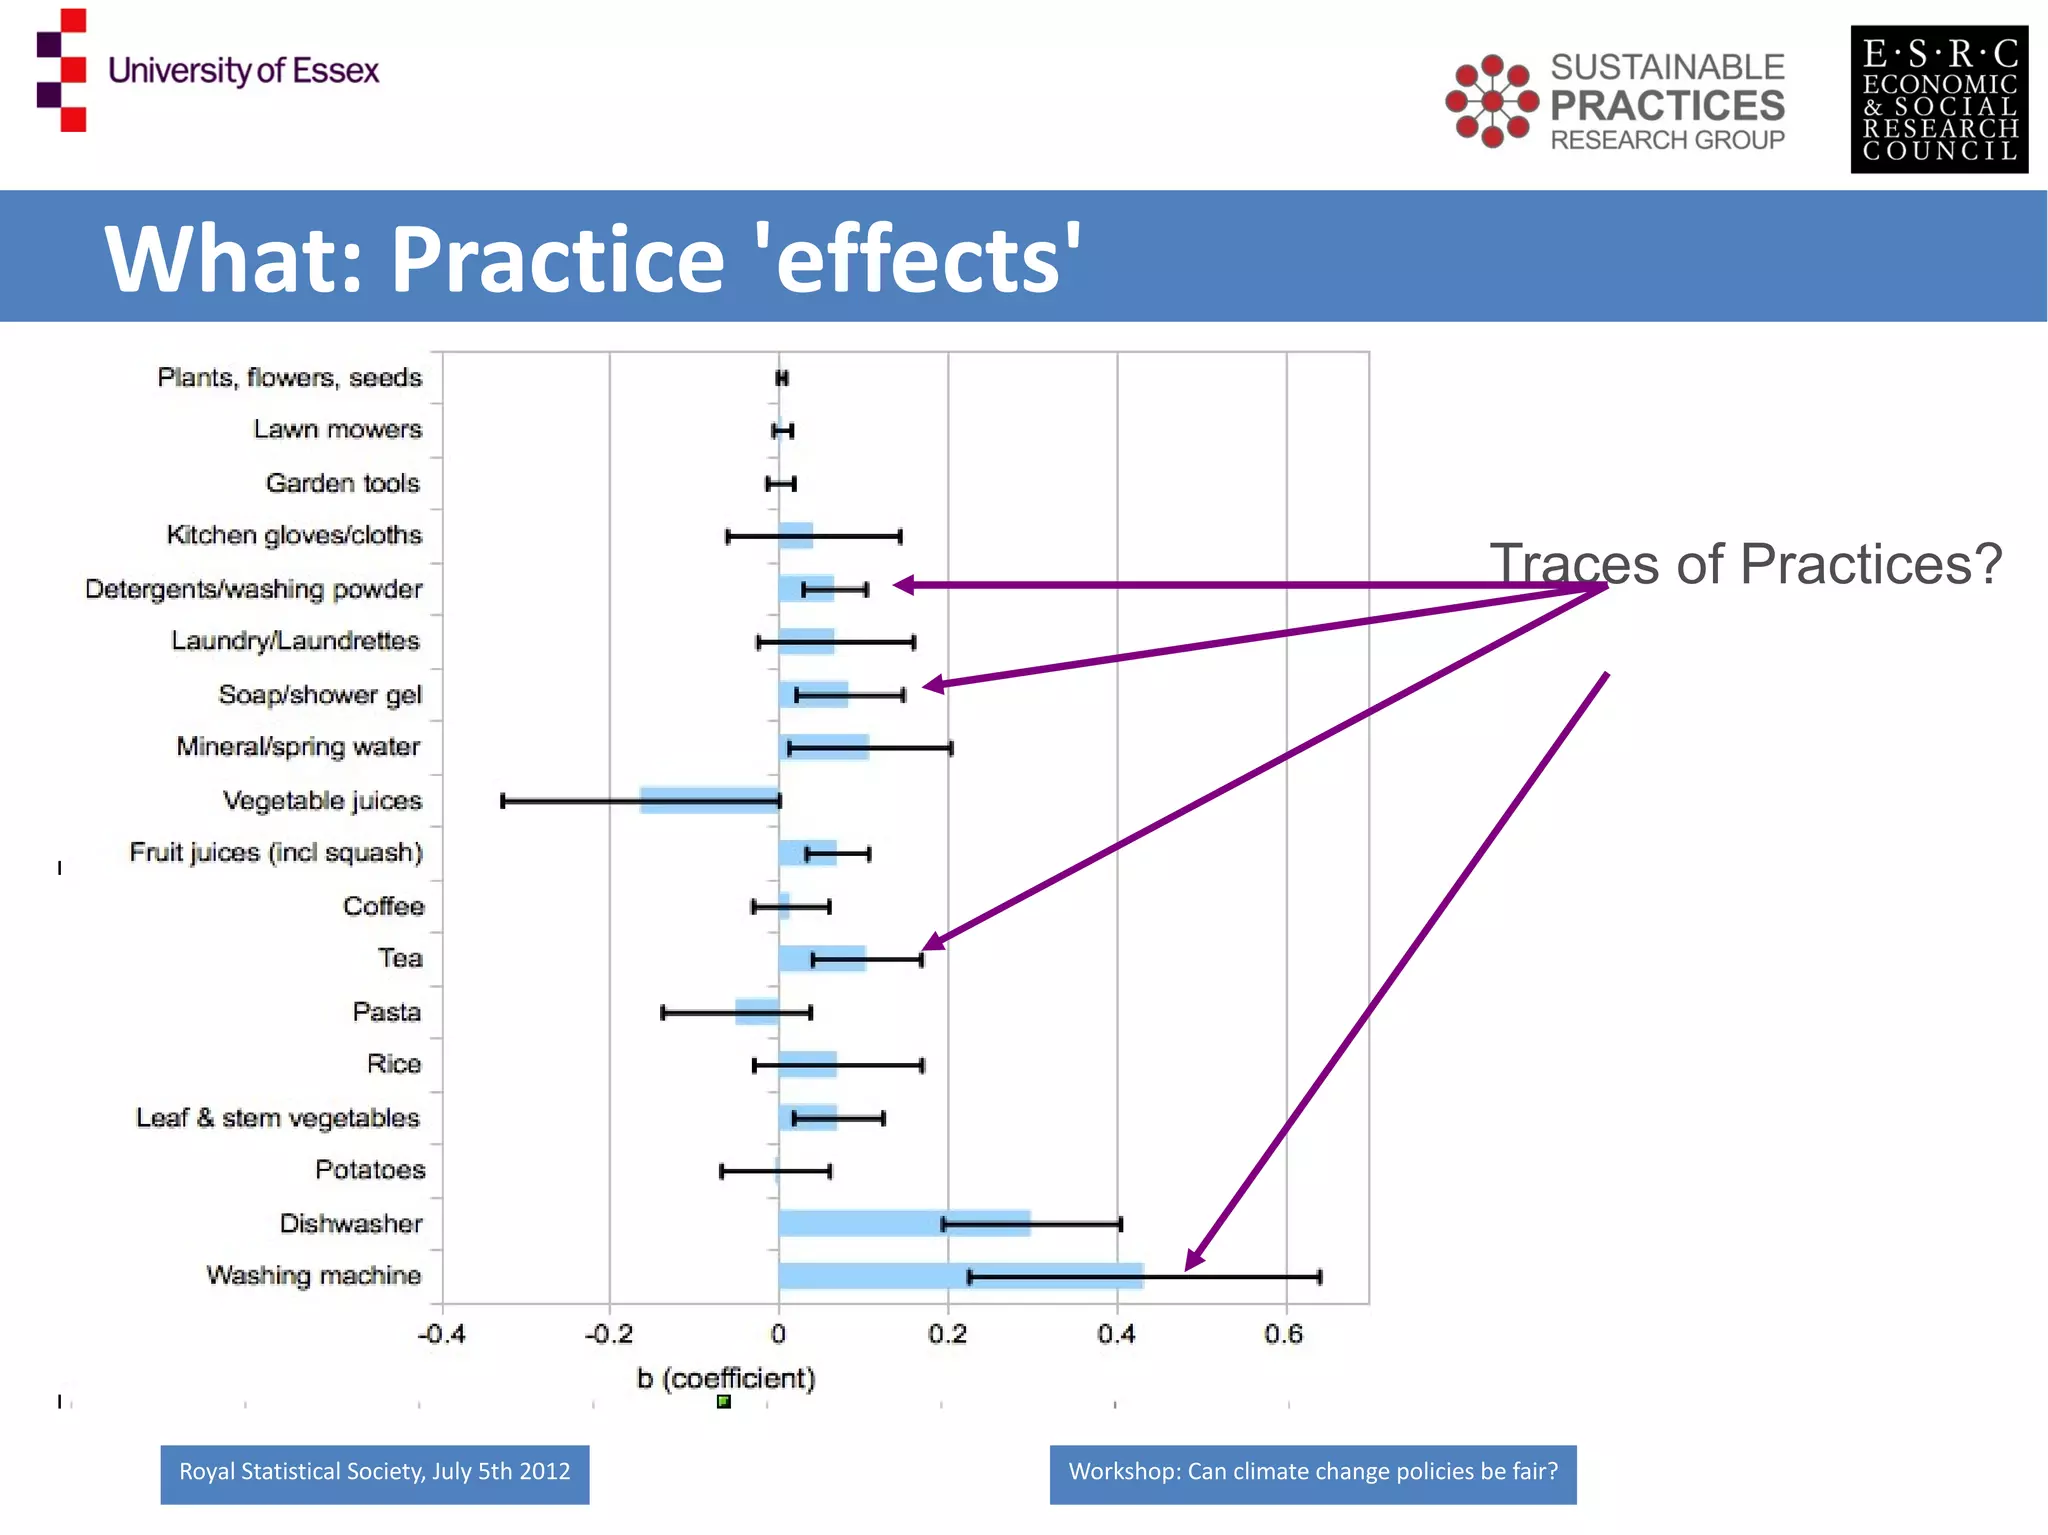
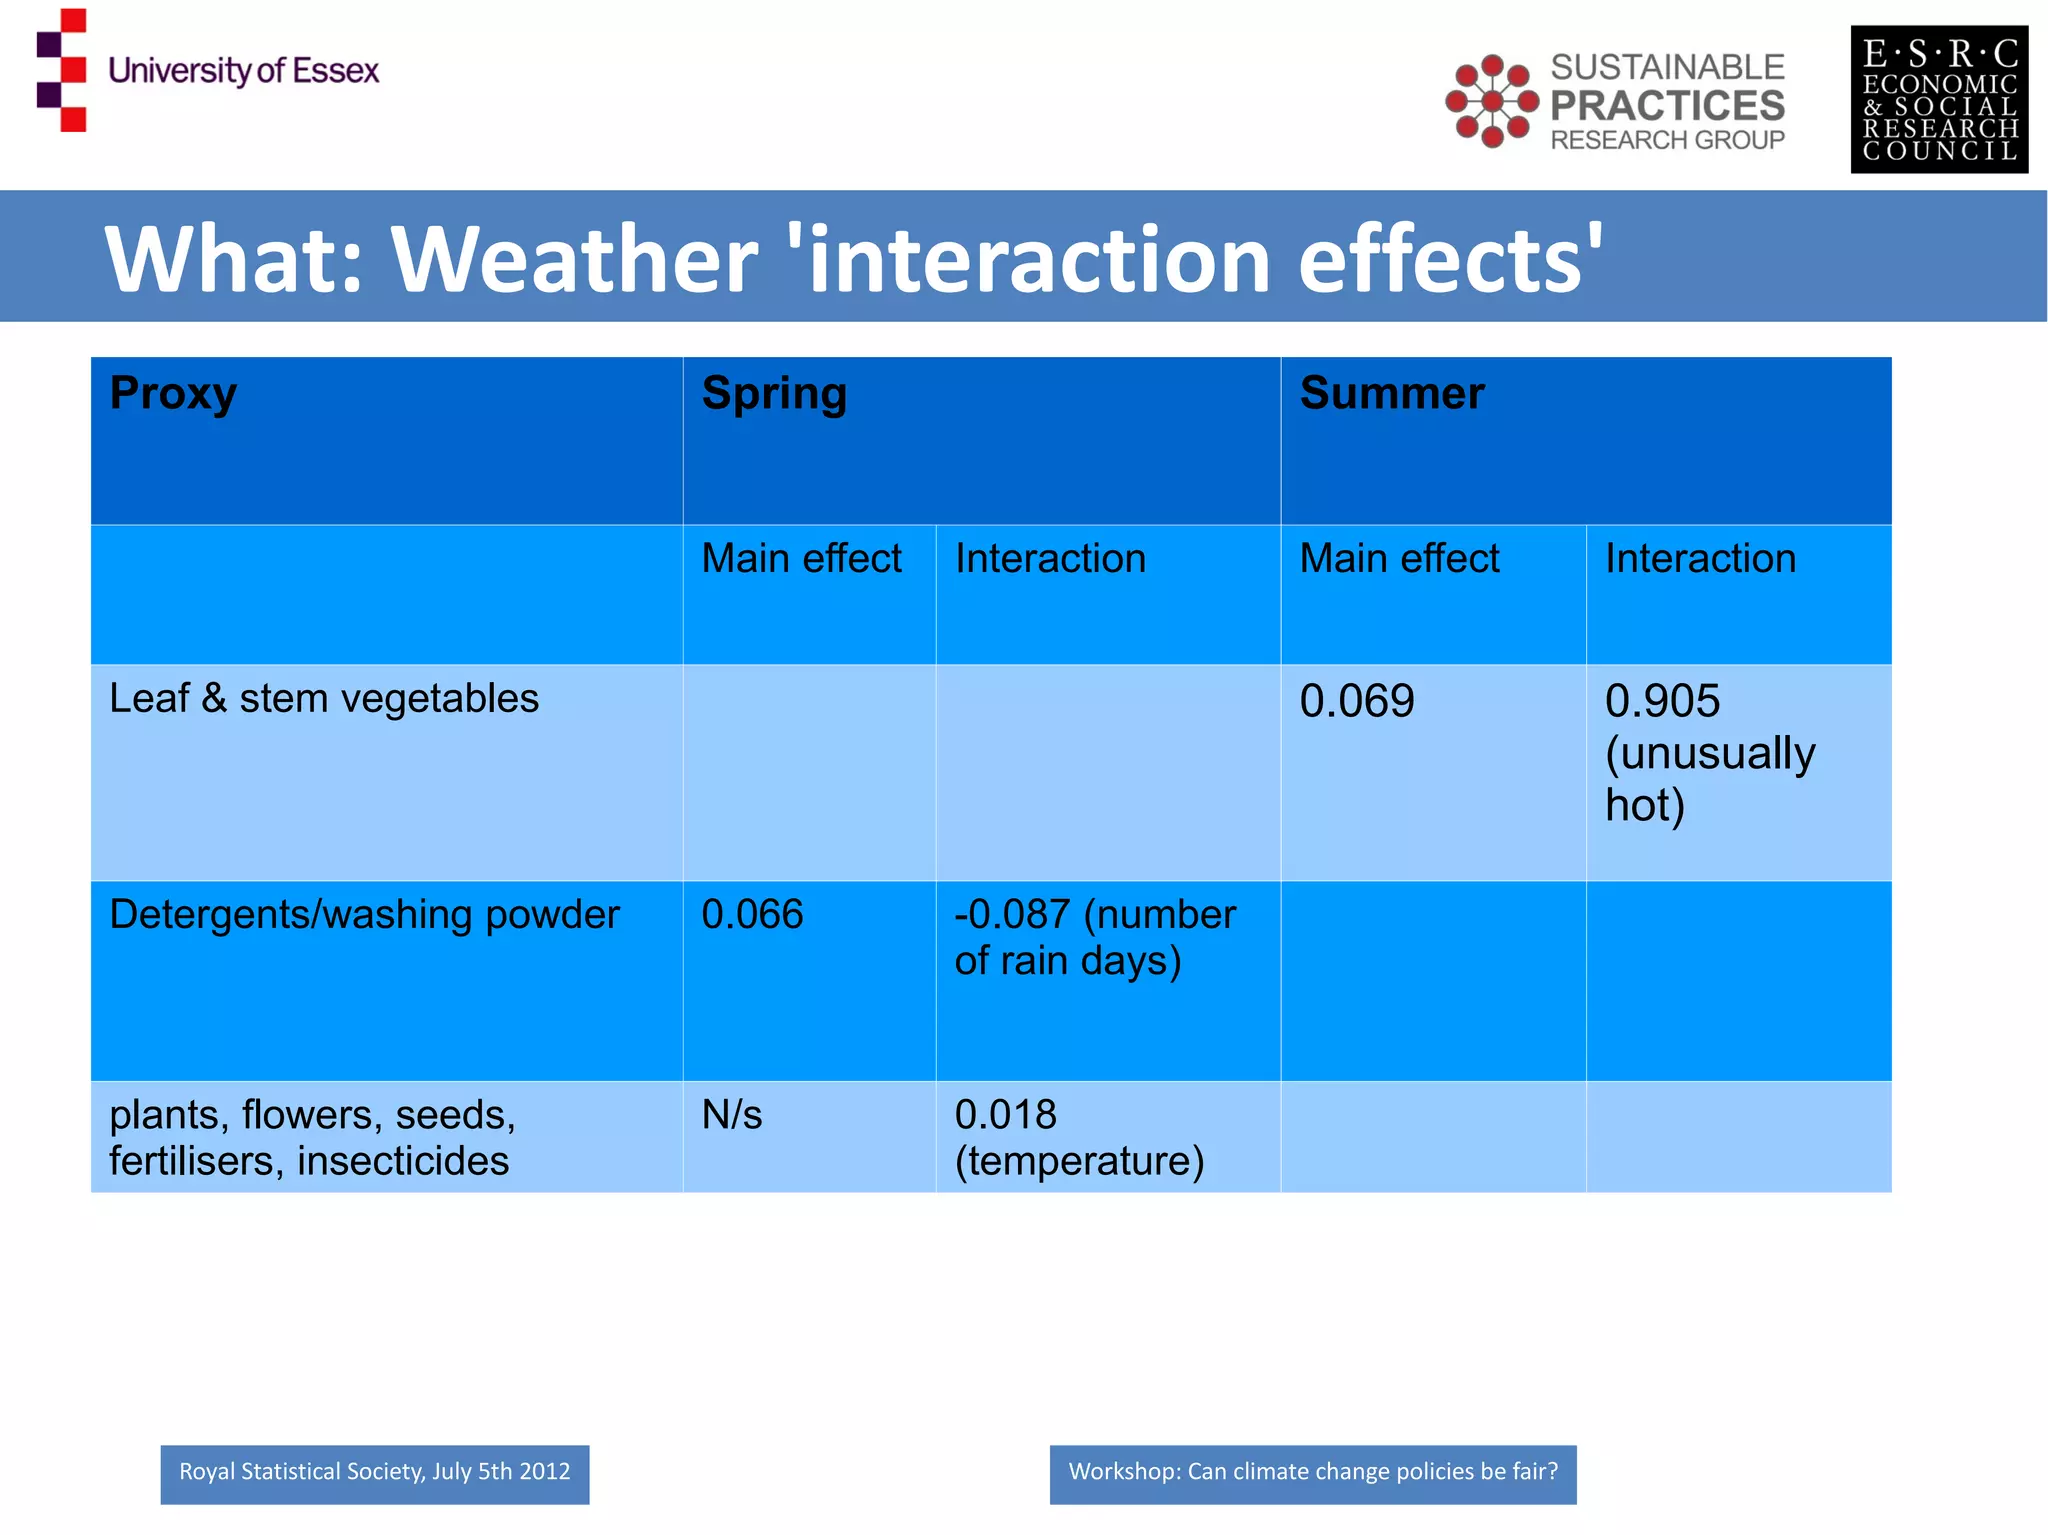
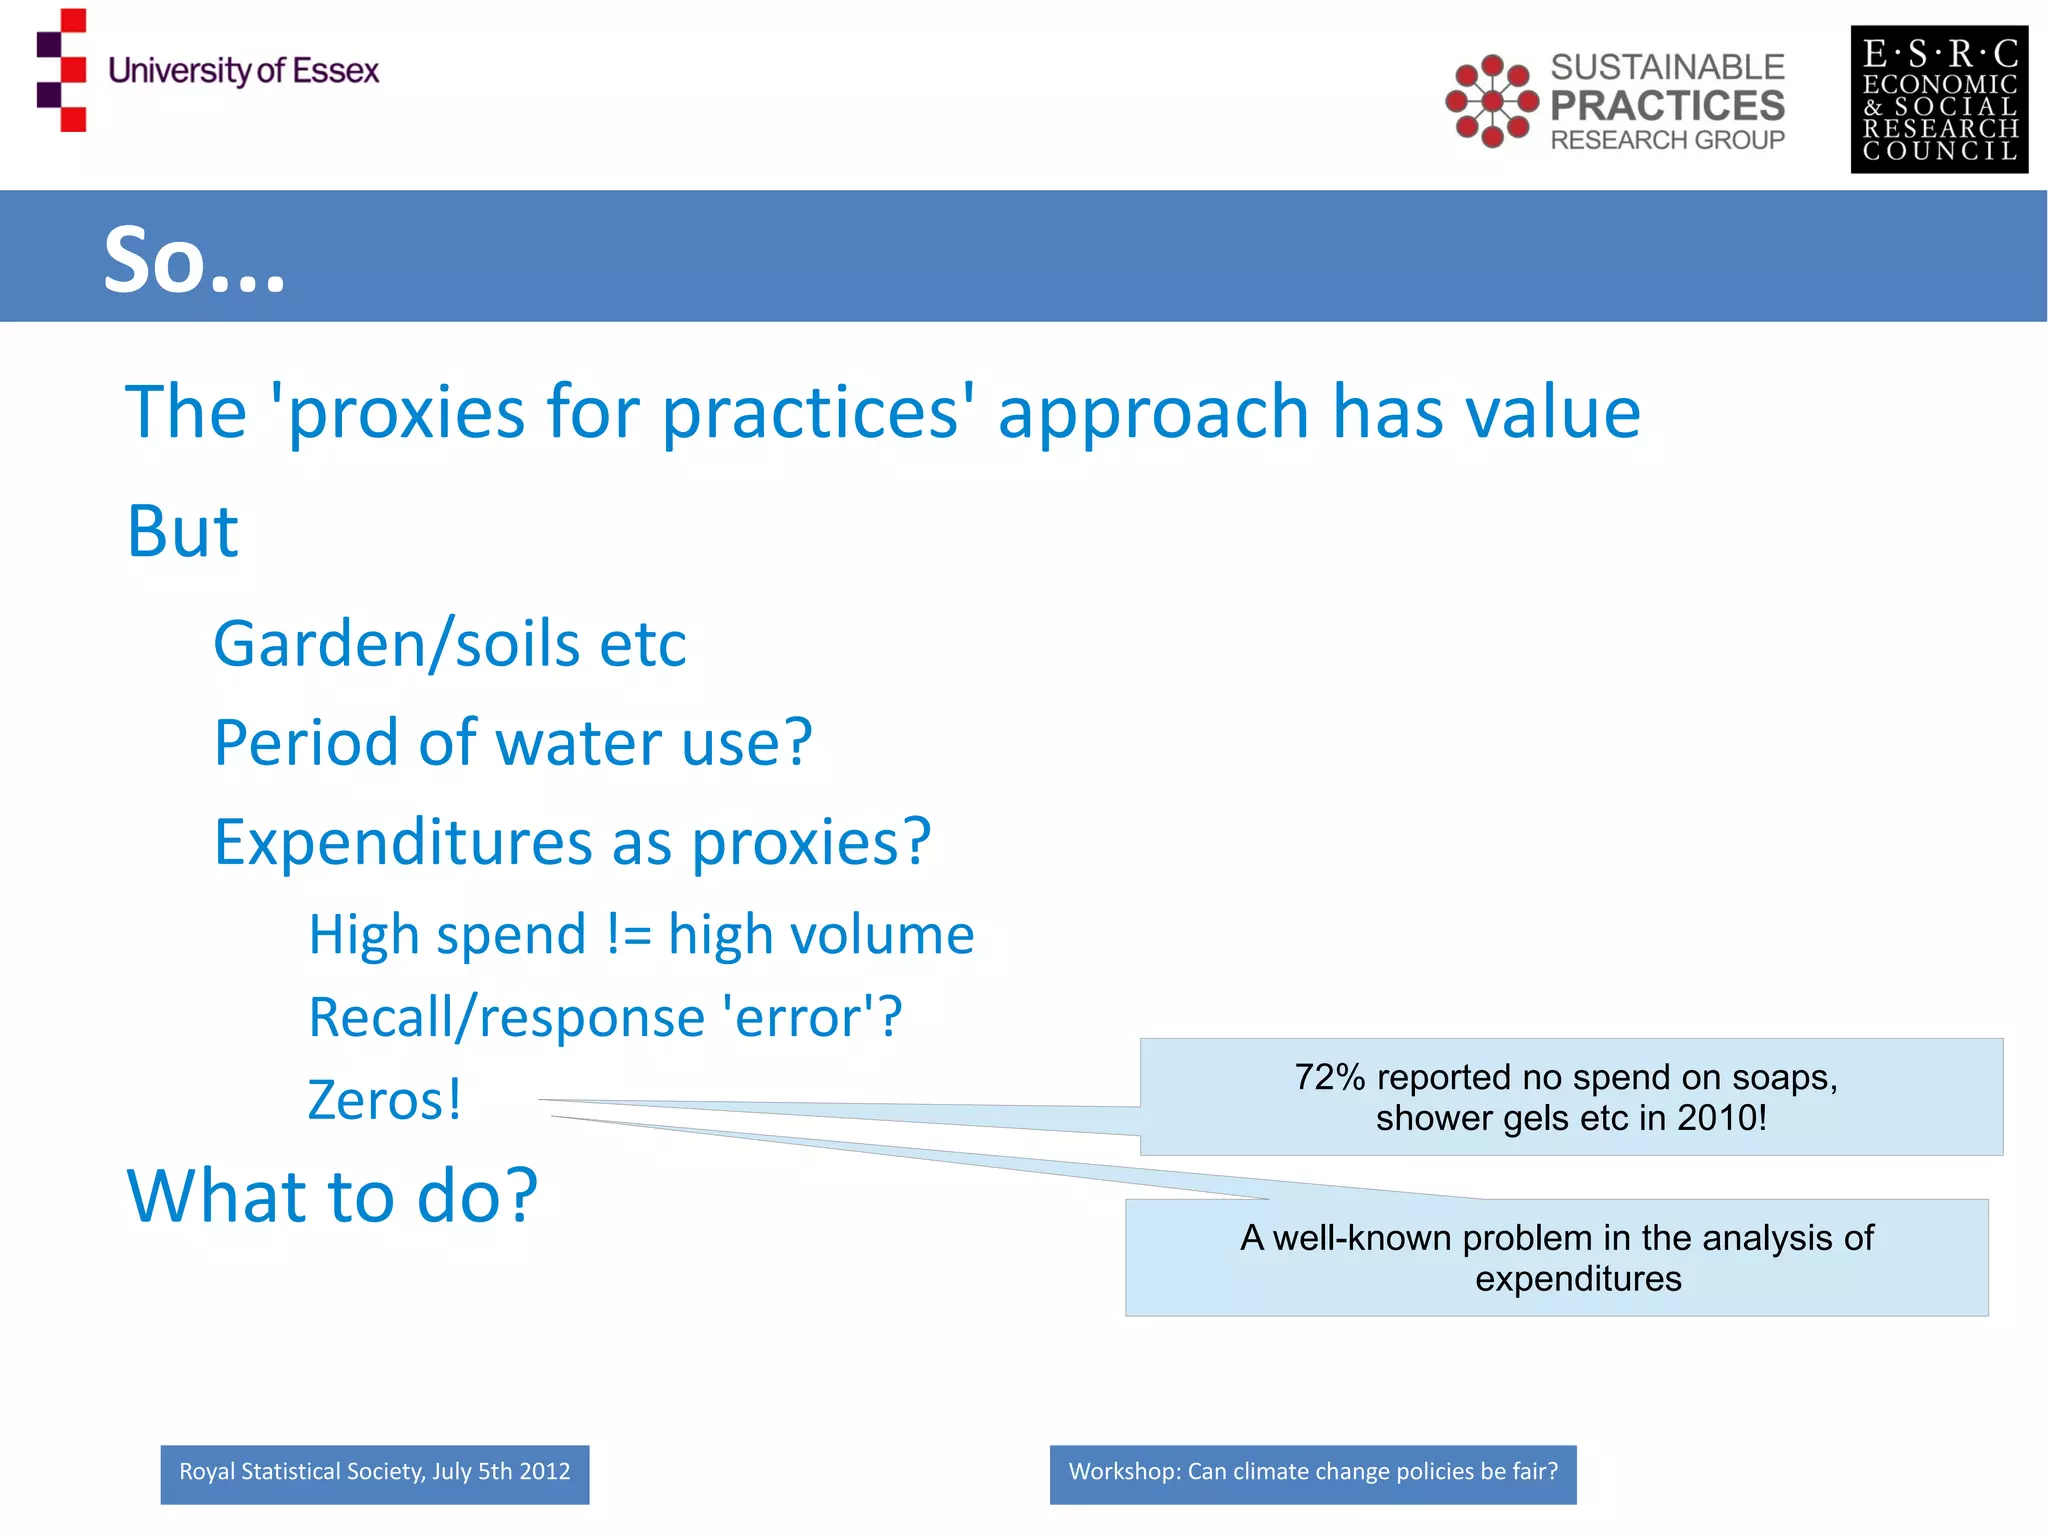
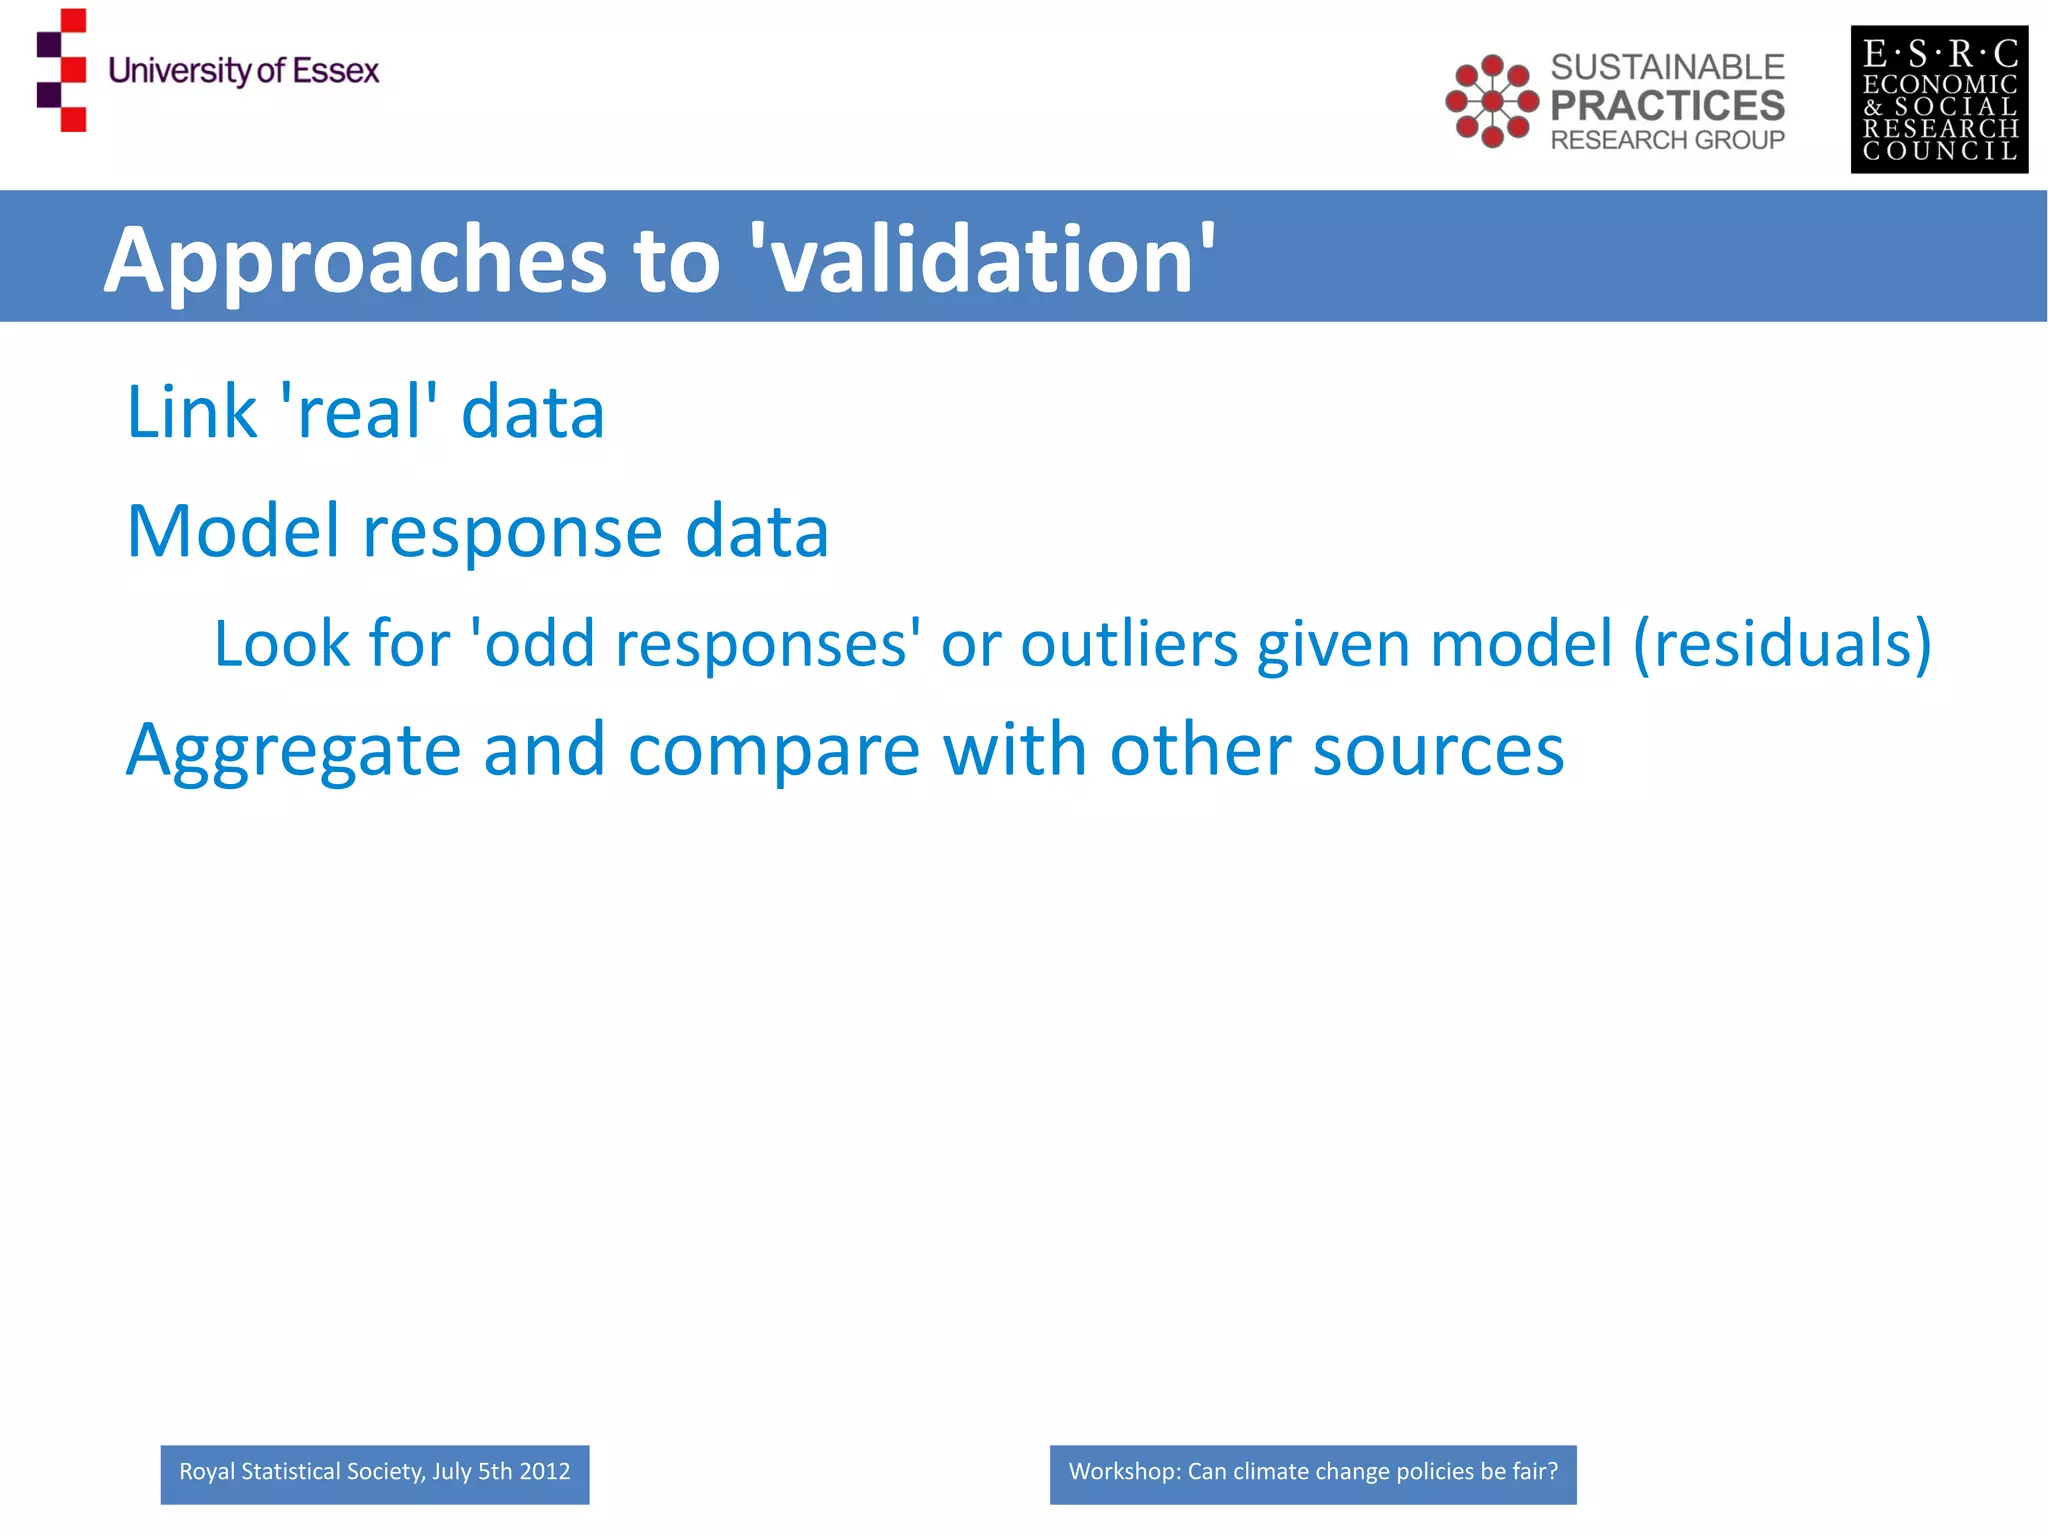
Practices by Proxy

               Climate, Consumption and Water
                                             (and troubles with data...)

                                                  Dr Ben Anderson
                                                 University of Essex

                                             Please cite as:
Anderson, B (2012) Practices By Proxy: Climate, Consumption and Water, Paper presented at “Can Climate
                Change Policies Be Fair?”, Royal Statistical Society, July 5th 2012, London


  Royal Statistical Society, July 5th 2012                 Workshop: Can climate change policies be fair?
Contents
Why?
    Water 'practices'
How?
    Proxies
What?
    Models
Problems?
    Data
Where next?

 Royal Statistical Society, July 5th 2012   Workshop: Can climate change policies be fair?
Why: Water is (going to be) a problem
Energy problems:
                                                                         The water industry currently
    Carbon cost of `clean'                                               accounts for 5 million tonnes
                                                                       of carbon dioxide emissions per
      water                                                             Year - almost one per cent of
                                                                       UK greenhouse gas emissions.
                                                                          Environment Agency 2009


 Royal Statistical Society, July 5th 2012   Workshop: Can climate change policies be fair?
Why: Water is (going to be) a problem
Energy problems:                                                                             With no
    Carbon cost of `clean'                                                                     'behaviour'
                                                                                               change and no
      water                                                                                    flow controls
Supply problems
    Locally/regionally scarce
    Climate change?
Demand problems
    50% used by households
    Poorly understood
    Climate change?                           Source: DEFRA, 2011


 Royal Statistical Society, July 5th 2012   Workshop: Can climate change policies be fair?
What do we want to know?
Practices in which water is implicated
    Diversity

                                                                                habituation, routine, practical consciou
                                                                                          tacit knowledge, tradition
                                                                                 Performance often neither fully cons
                                                                                                 nor reflective
                                                                                              Alan Warde, 2005


                                                   Why people don’t do
                                            what they ‘should’ - Jim Skea, 2011


 Royal Statistical Society, July 5th 2012                    Workshop: Can climate change policies be fair?
What do we want to know?
Practices in which water is implicated
    Diversity
Proxies for practices?
    'Traces' of water
Relationship with climate?
    Mediation, adaptation
Relationship to demand?
    From practices to litres
                                                                                             Image: Eric Shipton, 1951


 Royal Statistical Society, July 5th 2012   Workshop: Can climate change policies be fair?
Conceptual Framework

                                                                                   habituation, routine,
                                                                                   neither conscious nor
                                                                                           reflective


Water demand = f(price + demographics + practices + attitudes) + error

                                    Regulation                                                      Education
                                     Market           ??                    ??                     Information
                                      Supply                                                       Persuasion

                                                 Policy levers & Interventions


  Royal Statistical Society, July 5th 2012                     Workshop: Can climate change policies be fair?
Conceptual Framework

                                             Climate
                                              change                                     habituation, routine,
                                                                                         neither conscious nor
                                                                                                 reflective


Water demand = f(price + demographics + practices + attitudes) + error

                                    Regulation                                                            Education
                                     Market                 ??                    ??                     Information
                                      Supply                                                             Persuasion

                                                       Policy levers & Interventions


  Royal Statistical Society, July 5th 2012                           Workshop: Can climate change policies be fair?
How: Expenditures as Proxies
Ideal                                                      Proxy (LCF 2002-2010)
    water (l/day)                                                       £
                                                                    water/week
      Demograp
        hics                                                         Demograp
                                                                       hics
                                                                                                       Shampoo,soap
                                            Fruit & Veg
                                                                                                         detergents
       Practices
                                                                        £/week
                                            Tea, coffee,                                                    Garden
                                              juices                                                        products
           Price
                                                                          Price                                 Regional
                                                                                                               Climate/We
                                                                                                                     ather
        Attitudes                                                                                                 linked
                                                                       Attitudes                                to survey
                                                                                                                    quarter


 Royal Statistical Society, July 5th 2012                  Workshop: Can climate change policies be fair?
How: Modelling Approach
2005 prices                                                                                   All                            39121
                                                                                              households
Selection:
                                                                                              Metered                        11119
     Metered only
                                                                                              Separate                       -1387
     Combined water & sewerage                                                                water &
                                                                                              sewerage
Seasonal models
     20                                                             £4.90
                                                                                              Remaining                      9732
     15                                                             £4.85

     10                                                             £4.80

       5                                                            £4.75

       0                                                            £4.70
 Winter (Dec – Feb) Spring (Mar – May) Summer (Jun – Aug) Autumn (Sep – Nov)

       Water £/week          Mean rainfall (cm)   Mean number
                                                  raindays
       Mean sunshine         Mean temperature
       hours (/10)


  Royal Statistical Society, July 5th 2012                                  Workshop: Can climate change policies be fair?
What: Summary Results

                                Weather (3 year anomly interaction)                                                                         Climate/W
                                Weather (contemporary interaction)
                                                                                                                                               eather

                                                                Practices

                                       Washing machine/dishwasher

Long-term illness, age of HRP, gender of HRP, ethnicity of HRP
                                                                                                                                            Practices
                               Age distributions, number of persons

              N cars, n earners, HRP employment, composition

                        Accommodation, number of rooms, tenure                                                                              Traces of
                                                     Region, year, income                                                                   Practices?
                                                                             0%   5% 10% 15% 20% 25% 30%


                                                      r sq   change in rsq


     Linear regression (OLS), Wald Table, n = 11,192, final r sq = 27%

          Royal Statistical Society, July 5th 2012                                         Workshop: Can climate change policies be fair?
What: Practice 'effects'

                                                                                   Traces of Practices?


 Royal Statistical Society, July 5th 2012   Workshop: Can climate change policies be fair?
What: Weather 'interaction effects'
Proxy                                          Spring                                   Summer


                                               Main effect   Interaction                Main effect                 Interaction


Leaf & stem vegetables                                                                  0.069                       0.905
                                                                                                                    (unusually
                                                                                                                    hot)

Detergents/washing powder                      0.066         -0.087 (number
                                                             of rain days)


plants, flowers, seeds,                        N/s           0.018
fertilisers, insecticides                                    (temperature)


    Royal Statistical Society, July 5th 2012                       Workshop: Can climate change policies be fair?
So...
The 'proxies for practices' approach has value
But
     Garden/soils etc
     Period of water use?
     Expenditures as proxies?
               High spend != high volume
               Recall/response 'error'?
                                                                  72% reported no spend on soaps,
               Zeros!                                                 shower gels etc in 2010!

What to do?                                                  A well-known problem in the analysis of
                                                                           expenditures


  Royal Statistical Society, July 5th 2012   Workshop: Can climate change policies be fair?
Approaches to 'validation'
Link 'real' data
Model response data
    Look for 'odd responses' or outliers given model (residuals)
Aggregate and compare with other sources


 Royal Statistical Society, July 5th 2012   Workshop: Can climate change policies be fair?
Linking 'water'
  Practice based survey of water 'habits'
        1800 respondents across South & East England
        Linked metering data for survey respondents
                  For those who agreed to linkage
                                                                                     Of whom 4 are metered
                  And whose water company also agreed (!)                            who said they weren't!

Metered:                          769           42%                  10% didn't know


Agreed to linkage:                282           15%
                                                                    To date we only have 64 records


Agreed to linkage and             132           7%
metered                                                             To date we only have 32 records

     Royal Statistical Society, July 5th 2012         Workshop: Can climate change policies be fair?
Linking 'water': What we hope for...


 Royal Statistical Society, July 5th 2012   Workshop: Can climate change policies be fair?
Linking 'water': What we get...
Preliminary
  results with
  incomplete
  data, please
  do not cite!
    To be
   refreshed
     when
  more data
    arrives


21 metered respondents who agreed to data linkage AND estimated monthly water bill
  Royal Statistical Society, July 5th 2012   Workshop: Can climate change policies be fair?
Aggregating 'electricity' Ia
                                                                                                       Survey:
                         Total
                                                                                                               LCF 2010
Yorkshire and the Humber
                                                                                                       DECC
           West Midlands
                       Wales                                                                                   Sub-regional
                South West                                                                                       electricity
                South East                                                                                       statistics
                 North East
                                                                                                                 (aggregated
          Greater London
                                                                                                                 LSOAs)
                     Eastern
            East Midlands

                                 0         2     4   6   8   10   12     14        16       18


                     Mean £ per week (LCF, 2010)
                     Mean £ per week (DECC 2010, assume 12p per kwh)


      Royal Statistical Society, July 5th 2012                     Workshop: Can climate change policies be fair?
Aggregating 'electricity' Ib
                    Total


 Yorkshire and the Humber
           West Midlands
                   Wales
              South West                                                                                                                 18
              South East
               North East
          Greater London

                 Eastern


                                                                                     Mean £ per week (DECC, 2010, assumes 12p per kwh)
           East Midlands

                            0   2    4      6     8     10     12     14   16   18
                                                                                                                                         16
                    Mean £ per week (EFS, 2010)
                    Mean £ per week (DECC 2010, assume 12p per kwh)
                                                                                                                                                    R² = 0.3642018973
                                                                                                                                         14


Survey:                                                                                                                                  12


                 LCF 2010                                                                                                                10


DECC                                                                                                                                      8


                 Sub-regional                                                                                                             6


                   electricity                                                                                                            4

                   statistics                                                                                                             2

                   (aggregated
                                                                                                                                          0
                   LSOAs)                                                                                                                     7.5                8                 8.5                   9               9.5   10

                                                                                                                                                                            Mean £ per week (LCF, 2010)


        Royal Statistical Society, July 5th 2012                                                                                                                        Workshop: Can climate change policies be fair?
Aggregating 'electricity' IIa
Ideally
    Geo-referenced clusters of LCF households
    Compare to DECC LSOA data


 Royal Statistical Society, July 5th 2012   Workshop: Can climate change policies be fair?
Aggregating 'electricity' IIa
Ideally
    Geo-referenced clusters of LCF households
    Compare to DECC LSOA data
              Not yet in Secure Data Service...
                                                                                'Spatial Microsimulation'
So:
    Small Area Estimation
              East of England
              LSOA level electricity demand estimates
                                                                                              New data please!
              Census 2001 & LCF 2010
    Compare to DECC LSOA data

 Royal Statistical Society, July 5th 2012    Workshop: Can climate change policies be fair?
Aggregating 'electricity' IIb

                                                                                         LSOAs
                                                                                         East of England


                                                                                   Forest Heath 002A/B
                                                                                   c. 73% = Born in the
                                                                                           USA!


 Royal Statistical Society, July 5th 2012   Workshop: Can climate change policies be fair?
Aggregating 'electricity' IIc


 Royal Statistical Society, July 5th 2012   Workshop: Can climate change policies be fair?
Aggregating 'electricity' IId


                                            Spearman rho:
                                               Town: 0.6403
                                               Urban: 0.5915
                                               Village: 0.7948


 Royal Statistical Society, July 5th 2012       Workshop: Can climate change policies be fair?
So what?
We can map:
    Energy 'poverty'
    Energy 'inequality'
And we can model
    Potential policy effects


 Royal Statistical Society, July 5th 2012   Workshop: Can climate change policies be fair?
So what?
We can map:
    Energy 'poverty'
    Energy 'inequality'
And we can model
    Potential policy effects
But also
    The electricity
      expenditures may
      be robust


 Royal Statistical Society, July 5th 2012   Workshop: Can climate change policies be fair?
Conclusions
Thinking about expenditures as proxies for practices
    Has some value
BUT there are problems
    Zeros?
    Mis-reporting?
Where next?


 Royal Statistical Society, July 5th 2012   Workshop: Can climate change policies be fair?
Conclusions
Thinking about expenditures as proxies for practices
    Has some value
BUT there are problems
    Zeros?
    Mis-reporting?
Where next?
    Data linkage?
    Micro and area level calibration?


 Royal Statistical Society, July 5th 2012   Workshop: Can climate change policies be fair?
Thank you
Dr Ben Anderson
              benander@essex.ac.uk


Sustainable Practices Research Group
              www.sprg.ac.uk
Spatial microsimulation:
              http://www.scribd.com/collections/3209973/Spatial-microsimulation


 Royal Statistical Society, July 5th 2012          Workshop: Can climate change policies be fair?

Practices by Proxy: Climate, Consumption and Water (and troubles with data)

  • 1.
    Practices by Proxy Climate, Consumption and Water (and troubles with data...) Dr Ben Anderson University of Essex Please cite as: Anderson, B (2012) Practices By Proxy: Climate, Consumption and Water, Paper presented at “Can Climate Change Policies Be Fair?”, Royal Statistical Society, July 5th 2012, London Royal Statistical Society, July 5th 2012 Workshop: Can climate change policies be fair?
  • 2.
    Contents Why? Water 'practices' How? Proxies What? Models Problems? Data Where next? Royal Statistical Society, July 5th 2012 Workshop: Can climate change policies be fair?
  • 3.
    Why: Water is(going to be) a problem Energy problems: The water industry currently Carbon cost of `clean' accounts for 5 million tonnes of carbon dioxide emissions per water Year - almost one per cent of UK greenhouse gas emissions. Environment Agency 2009 Royal Statistical Society, July 5th 2012 Workshop: Can climate change policies be fair?
  • 4.
    Why: Water is(going to be) a problem Energy problems: With no Carbon cost of `clean' 'behaviour' change and no water flow controls Supply problems Locally/regionally scarce Climate change? Demand problems 50% used by households Poorly understood Climate change? Source: DEFRA, 2011 Royal Statistical Society, July 5th 2012 Workshop: Can climate change policies be fair?
  • 5.
    What do wewant to know? Practices in which water is implicated Diversity habituation, routine, practical consciou tacit knowledge, tradition Performance often neither fully cons nor reflective Alan Warde, 2005 Why people don’t do what they ‘should’ - Jim Skea, 2011 Royal Statistical Society, July 5th 2012 Workshop: Can climate change policies be fair?
  • 6.
    What do wewant to know? Practices in which water is implicated Diversity Proxies for practices? 'Traces' of water Relationship with climate? Mediation, adaptation Relationship to demand? From practices to litres Image: Eric Shipton, 1951 Royal Statistical Society, July 5th 2012 Workshop: Can climate change policies be fair?
  • 7.
    Conceptual Framework habituation, routine, neither conscious nor reflective Water demand = f(price + demographics + practices + attitudes) + error Regulation Education Market ?? ?? Information Supply Persuasion Policy levers & Interventions Royal Statistical Society, July 5th 2012 Workshop: Can climate change policies be fair?
  • 8.
    Conceptual Framework Climate change habituation, routine, neither conscious nor reflective Water demand = f(price + demographics + practices + attitudes) + error Regulation Education Market ?? ?? Information Supply Persuasion Policy levers & Interventions Royal Statistical Society, July 5th 2012 Workshop: Can climate change policies be fair?
  • 9.
    How: Expenditures asProxies Ideal Proxy (LCF 2002-2010) water (l/day) £ water/week Demograp hics Demograp hics Shampoo,soap Fruit & Veg detergents Practices £/week Tea, coffee, Garden juices products Price Price Regional Climate/We ather Attitudes linked Attitudes to survey quarter Royal Statistical Society, July 5th 2012 Workshop: Can climate change policies be fair?
  • 10.
    How: Modelling Approach 2005prices All 39121 households Selection: Metered 11119 Metered only Separate -1387 Combined water & sewerage water & sewerage Seasonal models 20 £4.90 Remaining 9732 15 £4.85 10 £4.80 5 £4.75 0 £4.70 Winter (Dec – Feb) Spring (Mar – May) Summer (Jun – Aug) Autumn (Sep – Nov) Water £/week Mean rainfall (cm) Mean number raindays Mean sunshine Mean temperature hours (/10) Royal Statistical Society, July 5th 2012 Workshop: Can climate change policies be fair?
  • 11.
    What: Summary Results Weather (3 year anomly interaction) Climate/W Weather (contemporary interaction) eather Practices Washing machine/dishwasher Long-term illness, age of HRP, gender of HRP, ethnicity of HRP Practices Age distributions, number of persons N cars, n earners, HRP employment, composition Accommodation, number of rooms, tenure Traces of Region, year, income Practices? 0% 5% 10% 15% 20% 25% 30% r sq change in rsq Linear regression (OLS), Wald Table, n = 11,192, final r sq = 27% Royal Statistical Society, July 5th 2012 Workshop: Can climate change policies be fair?
  • 12.
    What: Practice 'effects' Traces of Practices? Royal Statistical Society, July 5th 2012 Workshop: Can climate change policies be fair?
  • 13.
    What: Weather 'interactioneffects' Proxy Spring Summer Main effect Interaction Main effect Interaction Leaf & stem vegetables 0.069 0.905 (unusually hot) Detergents/washing powder 0.066 -0.087 (number of rain days) plants, flowers, seeds, N/s 0.018 fertilisers, insecticides (temperature) Royal Statistical Society, July 5th 2012 Workshop: Can climate change policies be fair?
  • 14.
    So... The 'proxies forpractices' approach has value But Garden/soils etc Period of water use? Expenditures as proxies? High spend != high volume Recall/response 'error'? 72% reported no spend on soaps, Zeros! shower gels etc in 2010! What to do? A well-known problem in the analysis of expenditures Royal Statistical Society, July 5th 2012 Workshop: Can climate change policies be fair?
  • 15.
    Approaches to 'validation' Link'real' data Model response data Look for 'odd responses' or outliers given model (residuals) Aggregate and compare with other sources Royal Statistical Society, July 5th 2012 Workshop: Can climate change policies be fair?
  • 16.
    Linking 'water' Practice based survey of water 'habits' 1800 respondents across South & East England Linked metering data for survey respondents For those who agreed to linkage Of whom 4 are metered And whose water company also agreed (!) who said they weren't! Metered: 769 42% 10% didn't know Agreed to linkage: 282 15% To date we only have 64 records Agreed to linkage and 132 7% metered To date we only have 32 records Royal Statistical Society, July 5th 2012 Workshop: Can climate change policies be fair?
  • 17.
    Linking 'water': Whatwe hope for... Royal Statistical Society, July 5th 2012 Workshop: Can climate change policies be fair?
  • 18.
    Linking 'water': Whatwe get... Preliminary results with incomplete data, please do not cite! To be refreshed when more data arrives 21 metered respondents who agreed to data linkage AND estimated monthly water bill Royal Statistical Society, July 5th 2012 Workshop: Can climate change policies be fair?
  • 19.
    Aggregating 'electricity' Ia Survey: Total LCF 2010 Yorkshire and the Humber DECC West Midlands Wales Sub-regional South West electricity South East statistics North East (aggregated Greater London LSOAs) Eastern East Midlands 0 2 4 6 8 10 12 14 16 18 Mean £ per week (LCF, 2010) Mean £ per week (DECC 2010, assume 12p per kwh) Royal Statistical Society, July 5th 2012 Workshop: Can climate change policies be fair?
  • 20.
    Aggregating 'electricity' Ib Total Yorkshire and the Humber West Midlands Wales South West 18 South East North East Greater London Eastern Mean £ per week (DECC, 2010, assumes 12p per kwh) East Midlands 0 2 4 6 8 10 12 14 16 18 16 Mean £ per week (EFS, 2010) Mean £ per week (DECC 2010, assume 12p per kwh) R² = 0.3642018973 14 Survey: 12 LCF 2010 10 DECC 8 Sub-regional 6 electricity 4 statistics 2 (aggregated 0 LSOAs) 7.5 8 8.5 9 9.5 10 Mean £ per week (LCF, 2010) Royal Statistical Society, July 5th 2012 Workshop: Can climate change policies be fair?
  • 21.
    Aggregating 'electricity' IIa Ideally Geo-referenced clusters of LCF households Compare to DECC LSOA data Royal Statistical Society, July 5th 2012 Workshop: Can climate change policies be fair?
  • 22.
    Aggregating 'electricity' IIa Ideally Geo-referenced clusters of LCF households Compare to DECC LSOA data Not yet in Secure Data Service... 'Spatial Microsimulation' So: Small Area Estimation East of England LSOA level electricity demand estimates New data please! Census 2001 & LCF 2010 Compare to DECC LSOA data Royal Statistical Society, July 5th 2012 Workshop: Can climate change policies be fair?
  • 23.
    Aggregating 'electricity' IIb LSOAs East of England Forest Heath 002A/B c. 73% = Born in the USA! Royal Statistical Society, July 5th 2012 Workshop: Can climate change policies be fair?
  • 24.
    Aggregating 'electricity' IIc Royal Statistical Society, July 5th 2012 Workshop: Can climate change policies be fair?
  • 25.
    Aggregating 'electricity' IId Spearman rho: Town: 0.6403 Urban: 0.5915 Village: 0.7948 Royal Statistical Society, July 5th 2012 Workshop: Can climate change policies be fair?
  • 26.
    So what? We canmap: Energy 'poverty' Energy 'inequality' And we can model Potential policy effects Royal Statistical Society, July 5th 2012 Workshop: Can climate change policies be fair?
  • 27.
    So what? We canmap: Energy 'poverty' Energy 'inequality' And we can model Potential policy effects But also The electricity expenditures may be robust Royal Statistical Society, July 5th 2012 Workshop: Can climate change policies be fair?
  • 28.
    Conclusions Thinking about expendituresas proxies for practices Has some value BUT there are problems Zeros? Mis-reporting? Where next? Royal Statistical Society, July 5th 2012 Workshop: Can climate change policies be fair?
  • 29.
    Conclusions Thinking about expendituresas proxies for practices Has some value BUT there are problems Zeros? Mis-reporting? Where next? Data linkage? Micro and area level calibration? Royal Statistical Society, July 5th 2012 Workshop: Can climate change policies be fair?
  • 30.
    Thank you Dr BenAnderson benander@essex.ac.uk Sustainable Practices Research Group www.sprg.ac.uk Spatial microsimulation: http://www.scribd.com/collections/3209973/Spatial-microsimulation Royal Statistical Society, July 5th 2012 Workshop: Can climate change policies be fair?