High Performance Buildings: What are They?
•
3 likes•667 views

Technical Session 1 from the 2009 ASHRAE Region VI CRC in Des Moines, Iowa. Presented by Paul Torcellini of NREL May 8, 2009

Recommended
More Related Content
Similar to High Performance Buildings: What are They?
Similar to High Performance Buildings: What are They? (20)
More from ASHRAE Region VI
More from ASHRAE Region VI (12)
Recently uploaded
Recently uploaded (20)
High Performance Buildings: What are They?
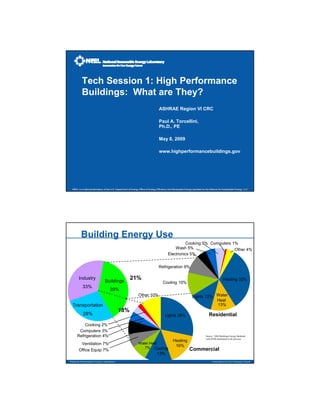
- 1. Tech Session 1: High Performance Buildings: What are They? ASHRAE Region VI CRC Paul A. Torcellini, Ph.D., PE May 8, 2009 www.highperformancebuildings.gov NREL is a national laboratory of the U.S. Department of Energy Office of Energy Efficiency and Renewable Energy operated by the Alliance for Sustainable Energy, LLC Building Energy Use Buildings use Cooking 5% Computers 1% 70% Wash 5% Other 4% of electricity Electronics 5% Refrigeration 9% Industry Buildings 21% Heating 32% Cooling 10% 33% 39% Other 10% Lights 12% Water Heat Transportation 13% 18% 28% Lights 28% Residential Cooking 2% Computers 3% Refrigeration 4% Source: 2004 Buildings Energy Databook with SEDS distributed to all end-uses Heating Ventilation 7% Water Heat 7% Cooling 16% Office Equip 7% Commercial 13% National Renewable Energy Laboratory Innovation for Our Energy Future
- 2. Trend of Commercial Sector 30 20 S e c to r e n e rg y (q u a d s ) Delivered 25 G D P (trillio n $ ) 15 (site) energy 20 10 Total (source) 15 energy 10 5 Gross 5 0 Domestic Product 1985 1990 1995 2000 2005 2010 2015 2020 2025 Commercial Sector Energy Use is Growing at 1.6% per year Growth is faster than energy efficiency measures National Renewable Energy Laboratory Innovation for Our Energy Future Zero Energy Buildings Goal The U.S. Department of Energy’s (DOE) Building Technologies (BT) Program set a goal of creating the conditions for low- and zero-energy commercial buildings (LZEBs) to be market viable by 2025. National Renewable Energy Laboratory Innovation for Our Energy Future
- 3. What is NREL? A National Laboratory for the United States Department of Energy dedicated to working on Renewable Energy and Energy Efficient Technologies www.nrel.gov Preface Remember the overall vision—reduce the impact of buildings. Today’s building’s designs mortgage the energy future of this country. Every design decision has an energy or environmental impact. National Renewable Energy Laboratory Innovation for Our Energy Future
- 4. Definitions What is a “sustainable” building? What is a “green” building? What is an “energy efficient building?” Do we build energy efficient buildings today? What is the potential? Vision
- 5. Many Pieces—Stressing the 3 year old ! Many Pieces So many ways to assemble the pieces Design is about making decisions – need motivation to make the right decisions National Renewable Energy Laboratory Innovation for Our Energy Future
- 6. Setting Goals Measurable goals are better From bad to good… – I want a green building – Design a LEED <rating> building – Design a building to use 30% less energy than ASHRAE 90.1-2004 – Design a building to use less than 30,000 BTU/sqft – Design a [NET] ZERO ENERGY BUILDING Influencing purchasing decision—the owner National Renewable Energy Laboratory Innovation for Our Energy Future Goal
- 7. Setting Goals • Need to establish goals that can be measured • People will strive to meet goals • Vague—I want a green building • Better—I want a building that uses less than X amount of energy (such as 30,000 BTU/sqft) • Metrics is about measuring and comparison • We will never have a perfect system for measuring-- National Renewable Energy Laboratory Innovation for Our Energy Future Design is about making decisions How do people make decisions? –What is cost-effective? –Economic –Operational reliability and power stability –Environmental Impact –Integrated the energy efficiency and architecture Every Decision has implications It is all about the process…
- 8. Influencing Design Decisions Integrated Design 100% Better application of existing technologies Design Decisions nt ipme ram Increased efficiency of ric Form Prog Equ Fab products Energy usage is very diffuse 0% Pre-Design Conceptual Design Design Development Phases in the Design Process Easier, Cheaper to Make Design Decisions Early… Energy Use Time (Design Decisions) National Renewable Energy Laboratory Innovation for Our Energy Future
- 9. Stages of Design Process Pre-design Goal Setting Conceptual Design Building Form/Fabric Architectural Design HVAC/L Design HVAC Trade-offs/Sizing Code Compliance Construction Operation Retrofit Post Occupancy Evaluation Defining Scales 90.1-1999 30% AEDG Zero Site (by default) Percent Savings from Standard X Maintaining units—continuous scale National Renewable Energy Laboratory Innovation for Our Energy Future
- 10. Defining Scales 90.1-1999 30% AEDG Zero Site Max. Potential “Carnot” National Renewable Energy Laboratory Innovation for Our Energy Future Advanced Energy Design Guides Step towards NZEB Available as free download from www.ashrae.org ASHRAE/IESNA/AIA/ USGBC joint project Prescriptive approach for routine energy savings National Renewable Energy Laboratory Innovation for Our Energy Future
- 11. Procedure • Decide on the goals: – May be new construction targets – May be tracking and reducing current building targets • Establish a long-term plan for measurement • Find a place to put the data • Be careful of comparisons – CBECS • US National Aggregated data • Big picture • Small scale comparisons can be misleading National Renewable Energy Laboratory Innovation for Our Energy Future DOE Commercial Building Benchmarks • Standardized prototypical building models • DOE produced and published • 16 building types available • Can be used to represent building stock • Can be used to create more fine grained analysis • Best for comparison and trends National Renewable Energy Laboratory Innovation for Our Energy Future
- 12. What is the Benchmark Project? Project Goal: – Produce a set of building models and weighting factors that represent ~ 70% of the commercial building stock for use in DOE building research – Realistic building models • Look, construction, systems, operation “Benchmark” Defined – Standard definition that represents “typical” buildings suitable for whole building energy simulations Joint Project: DOE, NREL, PNNL, and LBNL National Renewable Energy Laboratory Innovation for Our Energy Future Can We Build Low Energy Buildings? National Renewable Energy Laboratory Innovation for Our Energy Future
- 13. Where we are today Where we are if all buildings were built to code Assessment potential National Renewable Energy Laboratory Innovation for Our Energy Future 96 Percent savings needed to reach ZEB goal 90 91 90 80 77 73 67 64 70 62 59 58 53 54 50 43 44 43 32 30 10 6 5 -10 n es er al ing All y bl y ce hip t ing ce et y nt) ) ent se can ) atio t or ted on a ll Oth s al rv i rvi ou dg em a tie urs s af o rs gm a ti ora ss i Va era uc Se Se reh Lo od ass I np dn sw utp nd of e Need a 60 to 70 percent decrease on the Ed Lab f rig din od Fo Wa ra ille iou e (o re blic /pr clu Fo nre Ca rd e Energy Consumption in commercial Sk te d ic e lig c ar (e x Pu (no alth co Re era Off tail alth buildings. use bli frig He Re Pu He o Re reh Wa Subsector Percent savings from efficiency needed to reach ZEB National Renewable Energy Laboratory Innovation for Our Energy Future
- 14. EE vs. RE Typically less energy transfers, the better Best to use energy produced on-site, rather than exporting to another building Roughly 60-70 percent savings from EE with 30ish percent RE National Renewable Energy Laboratory Innovation for Our Energy Future Base EUI 45 58 kBtu/ft2-yr % Savings Net 64% 97% National Renewable Energy Laboratory Innovation for Our Energy Future
- 15. The Path to a Net Zero Building 2,500 cash flow 2,000 Lease Costs (or Finance Costs) utility bills Total Annual Costs ($/year) 1,500 1 1,000 500 Typical 90.1 Compliant Building 0 0% 100% Source Energy Savings (%) National Renewable Energy Laboratory Innovation for Our Energy Future The Path to a Net Zero Building cash flow Lease Costs (or Finance Costs) utility bills Total Annual Costs ($/year) 1 2 0 0% 100% Source Energy Savings (%) National Renewable Energy Laboratory Innovation for Our Energy Future
- 16. The Path to a Net Zero Building cash flow Lease Costs (or Finance Costs) utility bills Total Annual Costs ($/year) 1 3 2 0 0% 100% Source Energy Savings (%) National Renewable Energy Laboratory Innovation for Our Energy Future The Path to a Net Zero Building cash flow 4 Lease Costs (or Finance Costs) utility bills Total Annual Costs ($/year) 1 3 2 0 0% 100% Source Energy Savings (%) National Renewable Energy Laboratory Innovation for Our Energy Future
- 17. Parametrics / Optimization 2600 Zero Net Energy Energy + Lease Costs 2340 Mortgage + Energy Costs ($/year) 2080 1820 1560 ~ 750,000 pts. 1300 (parametrics) 1040 Cross-Over Point 780 Energy ~ 750 pts. On-Site Power 520 Efficiency(optimization) (PV) 260 0 0 10 20 30 40 50 60 70 80 90 100 Source Energy Savings (%) National Renewable Energy Laboratory Innovation for Our Energy Future Optimization Curve ZEB Not Possible Maximum Energy Savings Starting Point Cost Neutral Point Minimum Cost Point ~3,000 Simulations National Renewable Energy Laboratory Innovation for Our Energy Future
- 18. Goal Strategies Goal
- 19. Strategies Goal Strategies Goal
- 21. Questions? www.highperformancebuildings.gov National Renewable Energy Laboratory Innovation for Our Energy Future