SlideShare a Scribd company logo
1 of 47
An Introduction to R: free software for data analysis and graphics Allan C. Just PhD Student Environmental Health Sciences Mailman School of Public Health Columbia University December 01, 2010 Wickham 2008 A list of useful links can be found at the end Attribution-NonCommercial-ShareAlike 3.0 United States License. http://creativecommons.org/licenses/by-nc-sa/3.0/us/
Intro to R Objectives After this workshop participants will be able to: Describe some capabilities and uses of R Search for help within R and use good coding practices for reproducible research in R Read in, summarize, and transform a simple dataset in R Create and save reproducible graphs from R (scatterplots, histograms, boxplots, bar charts)
What is R? nytimes.com
R has many uses Work with data: subset, merge, and transform datasets with a powerful syntax Analysis: use existing statistical functions like regression or write your own Graphics: graphs can be made quickly during analysis and polished for publication quality displays
Why learn a whole language to look at data versus Excel? Recreate/redo your exact analysis Automate repetitive tasks Access to statistical methods not available in Excel Graphs are more elegant
Why R versusSAS, SPSS, or Stata? It's free!  It runs on Mac, Windows, and Linux It has state-of-the-art graphics capabilities It contains advanced statistical routines not yet available in other packages – a de facto standard in statistics Can program new statistical methods or automate data manipulation/analysis adapted from statmethods.net
Made in SAS Redone in R learnr.wordpress.com
R plots from my own research
Scatterplot matrixbivariate densities and correlations
Forest plot to compare parameter estimates  from many models
Displaying lots of data: facetted histograms
Plotting data with a model
Automated report generation
Choropleth map Shapefile: CIESIN, Columbia University   	Asthma data: http://nyc.gov/html/doh/downloads/pdf/asthma/asthma-hospital.pdf
Intro to R: recap Objectives After this workshop participants will be able to: Describe some capabilities and uses of R Statistical data analysis Automation (scripting) of functions to work with data Elegant graphics to facilitate data visualization Search for help within R and use good coding practices for reproducible research in R Read in, summarize, and transform a simple dataset in R Create and save reproducible graphs from R (scatterplots, histograms, boxplots, bar charts)
Learning a new language is difficult flickr.com/photos/dnorman/3732851541/
What makes R difficult to learn R is designed to be flexible and powerful rather than simple but limited. R is a fully featured language mainly used from the command line. Learning the commands and the structure of the code takes time and practice.  If I made a a typo you would know what I meant... The solution: be careful, build code in simple pieces and test as you go (learn to debug). Reuse code that works. Use helpful resources. Consider an alternative GUI for R.
Getting help in R	 You can call for help on a function with a leading question mark and leaving off the () ?functionname Search online statmethods.net   An Introduction to R in Windows found under Help – Manuals (in PDF)
Suggestions for an R workflow Leave yourself informative comments #  everything to the right of the pound sign #  is unevaluated Using spaces and indents can help readability Use meaningful names for objects Save the bits of your code that work in a text editor - building a script of clean code that works from start-to-finish.  With clean code instead of transformed data files it is easier to redo analyses if your data is updated or you want to change an earlier step Reproducible research!
Intro to R: recap Objectives After this workshop participants will be able to: Describe some capabilities and uses of R Search for help within R and use good coding practices for reproducible research in R ?t.test  	will bring up R help Free manuals online: Introduction to R   Also: statmethods.net  #use comments; save the code that works to reproduce your results Read in, summarize, and transform a simple dataset in R Create and save reproducible graphs from R (scatterplots, histograms, boxplots, bar charts)
Learning the languageMany important features Arithmetic and logical operators:  +,   <, … Data types: numeric, logical, … Data structures: vectors, matrices, … Functions – always end with (): median(x)
Using R as a calculator Mathematical operators +   -   /   *   ^ log() abs()
R can evaluate logical expressions == equal != not equal &  and |  or (vertical pipe) 10 < 20 [1] TRUE pi > 3 & 2^2 == 4 [1] TRUE "This" != "That" [1] TRUE
Creating new objects Assignment operator is   <-  (looks like an arrow) x <- 10 “Set x to take the value 10” The symbols in this operator must be adjacent.  x <  -  10     What does this do? You can overwrite old values x <- x^2 “Set x to take the value x2”
R operations are vectorized A vector is an ordered set of data  	of the same type (numeric, logical, dates, etc.) Concatenate function is c() x <- c(1, 2, 3) x^2 [1] 1 4 9 For integer sequences we can make vectors quickly with n:m 4:9 [1] 4 5 6 7 8 9 Vector recycling c(0,10) * c(1, 1, 1, 1) [1]  0 10  0 10
Other object classes Matrices: lots of matrix operations you would always use the lm() function to fit a linear model but you could do it manually beta <- solve(t(X)%*%X)%*%t(X)%*%y Arrays: n-dimensional Lists: sets of objects (can be different classes)
Indexing and subsetting refer to components of objects by a position index which goes between square braces  x <- c(10, 20, 30)  x [1] 10 20 30  x[2]			return the second position in x [1] 20  x[c(1, 2)]	return the first and second position in x [1] 10 20  x[-3]		return all except the third position in x [1] 10 20 What wouldx[c(3, 2)]return?
Data frames A data frame is a rectangular collection of data Rows: observations Columns: variables diamonds <- data.frame(carat, cut, price)   carat       cut price 1  0.23     Ideal   326 2  0.21   Premium   326 3  0.23      Good   327 4  0.29   Premium   334 5  0.31      Good   335 6  0.24 Very Good   336
Data frames You can extract the variables as vectors with a $ diamonds$cut You can also index by position (or name) with square braces diamonds[2, 3] returns the single value in row 2, column 3 An empty index is treated like a wildcard and corresponds to all rows or columns depending on position diamonds[, "cut"] (same result as diamonds$cut) How would you return the first three rows and all columns? row,  column
R functions Thousands of functions are built-in: median()		lm() linear model t.test()		chisq.test() or make your own: inch.to.cm <- function(x){x * 2.54} 	inch.to.cm(74)  	[1] 187.96
Missing values These take a value of NA Can be in a data object of any type (logical, numeric, character) By default operations on NA will return NA NA == NA [1] NA 	Can check for NA with is.na() y <- c(2, 10, NA, 12) is.na(y) [1] FALSE FALSE  TRUE FALSE 	Can often pass na.rm = T option to remove NA values in operations mean(y) [1] NA mean(y, na.rm = T) [1] 8
R has several thousandadditional packages time series survival spatial machine learning bioinformatics Interfaces to LaTeX, Excel, SQL databases, Twitter, google maps…
Installing a package Open up R Click in to the console window and type: install.packages() Select a mirror (anywhere in the US) Find and select "ggplot2" and choose OK. This will download ggplot2 and the other packages which it requires.
The default R graphical user interface (Windows)
Rcmdr: an alternate graphic user interface
JGR
Deducer
Recap on GUIs R Default Windows GUI: lacks additional features to make learning or programming easier   Rcmdr: Drop-down menus for basic stats. Uses base graphics. Doesn't make programming easier. JGR: Makes programming easier with syntax highlighting and command argument suggestions. No menus for stats. Looks the same across platforms (Java based) Deducer: Adds menus for basic stats to JGR.  Fewer menu driven stats than RCMDR but more flexible graphics options (building with ggplot2).
R graphics – 3 main "dialects" Base: with(airquality, plot(Temp, Ozone)) Lattice: xyplot(Ozone ~ Temp, airquality) ggplot2:  ggplot(airquality, aes(Temp, Ozone)) + geom_point( )
Google image search: ggplot2
ggplot2 philosophy Written by Hadley Wickham (Rice Univ.) Extends The Grammar of Graphics (Wilkinson, 2005) All graphs can be constructed by combining specifications with data (Wilkinson, 2005). A specification is a structured way to describe how to build the graph from geometric objects (points, lines, etc.) projected on to scales (x, y, color, size, etc.)
ggplot2 philosophy When you can describe the content of the graph with the grammar, you don’t need to know the name of a particular type of plot… Dot plot, forest plot, Manhattan plot are just special cases of this formal grammar. …a plotting system with good defaults for a large set of components that can be combined in flexible and creative ways…
Building a plot in ggplot2 data to visualize (a data frame) 		map variables to aesthetic attributes geometric objects – what you see (points, bars, etc) scales map values from data to aesthetic space 	faceting subsets the data to show multiple plots 	 	statistical transformations – summarize data coordinate systems put data on plane of graphic Wickham 2009
A basic ggplot2 graph ggplot(airquality) + geom_point(aes(x = Temp, y = Ozone)) Aesthetics map variables to scales Data Geometric objects to display
Help with learning ggplot2 Website:  had.co.nz/ggplot2/ Book: ggplot2: Elegant Graphics for Data Analysis Hadley Wickham, 2009
Intro to R: recap Objectives After this workshop participants will be able to: Describe some capabilities and uses of R Search for help within R and use good coding practices for reproducible research in R Read in, summarize, and transform a simple dataset in R 	With your neighbor, work through a script file analyzing data from the WHO - Global School Health Survey. Create and save reproducible graphs from R (scatterplots, histograms, boxplots, bar charts) The script contains code which you can run, modify, and take home!
Setting up our R session in 5 steps then a quick break (laptop users only, file is already on desktops)  Download and save the script file  intro_to_r_script.txt  available from: library.cumc.columbia.edu/rworkshop Open R (       icon) 3. Open script Success! 4. Switch to Files of type: "All files (*.*)" intro_to_r_script.txt  is on Desktop or wherever you saved it  5. Help your neighbor,      ask for help (if stuck),       take a quick break

More Related Content

Recently uploaded

Activity 01 - Artificial Culture (1).pdf
Activity 01 - Artificial Culture (1).pdfActivity 01 - Artificial Culture (1).pdf
Activity 01 - Artificial Culture (1).pdfciinovamais
 
social pharmacy d-pharm 1st year by Pragati K. Mahajan
social pharmacy d-pharm 1st year by Pragati K. Mahajansocial pharmacy d-pharm 1st year by Pragati K. Mahajan
social pharmacy d-pharm 1st year by Pragati K. Mahajanpragatimahajan3
 
Accessible design: Minimum effort, maximum impact
Accessible design: Minimum effort, maximum impactAccessible design: Minimum effort, maximum impact
Accessible design: Minimum effort, maximum impactdawncurless
 
Unit-IV- Pharma. Marketing Channels.pptx
Unit-IV- Pharma. Marketing Channels.pptxUnit-IV- Pharma. Marketing Channels.pptx
Unit-IV- Pharma. Marketing Channels.pptxVishalSingh1417
 
Kisan Call Centre - To harness potential of ICT in Agriculture by answer farm...
Kisan Call Centre - To harness potential of ICT in Agriculture by answer farm...Kisan Call Centre - To harness potential of ICT in Agriculture by answer farm...
Kisan Call Centre - To harness potential of ICT in Agriculture by answer farm...Krashi Coaching
 
Z Score,T Score, Percential Rank and Box Plot Graph
Z Score,T Score, Percential Rank and Box Plot GraphZ Score,T Score, Percential Rank and Box Plot Graph
Z Score,T Score, Percential Rank and Box Plot GraphThiyagu K
 
Introduction to Nonprofit Accounting: The Basics
Introduction to Nonprofit Accounting: The BasicsIntroduction to Nonprofit Accounting: The Basics
Introduction to Nonprofit Accounting: The BasicsTechSoup
 
Key note speaker Neum_Admir Softic_ENG.pdf
Key note speaker Neum_Admir Softic_ENG.pdfKey note speaker Neum_Admir Softic_ENG.pdf
Key note speaker Neum_Admir Softic_ENG.pdfAdmir Softic
 
Presentation by Andreas Schleicher Tackling the School Absenteeism Crisis 30 ...
Presentation by Andreas Schleicher Tackling the School Absenteeism Crisis 30 ...Presentation by Andreas Schleicher Tackling the School Absenteeism Crisis 30 ...
Presentation by Andreas Schleicher Tackling the School Absenteeism Crisis 30 ...EduSkills OECD
 
The basics of sentences session 2pptx copy.pptx
The basics of sentences session 2pptx copy.pptxThe basics of sentences session 2pptx copy.pptx
The basics of sentences session 2pptx copy.pptxheathfieldcps1
 
Grant Readiness 101 TechSoup and Remy Consulting
Grant Readiness 101 TechSoup and Remy ConsultingGrant Readiness 101 TechSoup and Remy Consulting
Grant Readiness 101 TechSoup and Remy ConsultingTechSoup
 
Class 11th Physics NEET formula sheet pdf
Class 11th Physics NEET formula sheet pdfClass 11th Physics NEET formula sheet pdf
Class 11th Physics NEET formula sheet pdfAyushMahapatra5
 
BAG TECHNIQUE Bag technique-a tool making use of public health bag through wh...
BAG TECHNIQUE Bag technique-a tool making use of public health bag through wh...BAG TECHNIQUE Bag technique-a tool making use of public health bag through wh...
BAG TECHNIQUE Bag technique-a tool making use of public health bag through wh...Sapna Thakur
 
A Critique of the Proposed National Education Policy Reform
A Critique of the Proposed National Education Policy ReformA Critique of the Proposed National Education Policy Reform
A Critique of the Proposed National Education Policy ReformChameera Dedduwage
 
Nutritional Needs Presentation - HLTH 104
Nutritional Needs Presentation - HLTH 104Nutritional Needs Presentation - HLTH 104
Nutritional Needs Presentation - HLTH 104misteraugie
 
Holdier Curriculum Vitae (April 2024).pdf
Holdier Curriculum Vitae (April 2024).pdfHoldier Curriculum Vitae (April 2024).pdf
Holdier Curriculum Vitae (April 2024).pdfagholdier
 
Student login on Anyboli platform.helpin
Student login on Anyboli platform.helpinStudent login on Anyboli platform.helpin
Student login on Anyboli platform.helpinRaunakKeshri1
 
IGNOU MSCCFT and PGDCFT Exam Question Pattern: MCFT003 Counselling and Family...
IGNOU MSCCFT and PGDCFT Exam Question Pattern: MCFT003 Counselling and Family...IGNOU MSCCFT and PGDCFT Exam Question Pattern: MCFT003 Counselling and Family...
IGNOU MSCCFT and PGDCFT Exam Question Pattern: MCFT003 Counselling and Family...PsychoTech Services
 

Recently uploaded (20)

Activity 01 - Artificial Culture (1).pdf
Activity 01 - Artificial Culture (1).pdfActivity 01 - Artificial Culture (1).pdf
Activity 01 - Artificial Culture (1).pdf
 
social pharmacy d-pharm 1st year by Pragati K. Mahajan
social pharmacy d-pharm 1st year by Pragati K. Mahajansocial pharmacy d-pharm 1st year by Pragati K. Mahajan
social pharmacy d-pharm 1st year by Pragati K. Mahajan
 
Advance Mobile Application Development class 07
Advance Mobile Application Development class 07Advance Mobile Application Development class 07
Advance Mobile Application Development class 07
 
Accessible design: Minimum effort, maximum impact
Accessible design: Minimum effort, maximum impactAccessible design: Minimum effort, maximum impact
Accessible design: Minimum effort, maximum impact
 
Unit-IV- Pharma. Marketing Channels.pptx
Unit-IV- Pharma. Marketing Channels.pptxUnit-IV- Pharma. Marketing Channels.pptx
Unit-IV- Pharma. Marketing Channels.pptx
 
Kisan Call Centre - To harness potential of ICT in Agriculture by answer farm...
Kisan Call Centre - To harness potential of ICT in Agriculture by answer farm...Kisan Call Centre - To harness potential of ICT in Agriculture by answer farm...
Kisan Call Centre - To harness potential of ICT in Agriculture by answer farm...
 
Z Score,T Score, Percential Rank and Box Plot Graph
Z Score,T Score, Percential Rank and Box Plot GraphZ Score,T Score, Percential Rank and Box Plot Graph
Z Score,T Score, Percential Rank and Box Plot Graph
 
Introduction to Nonprofit Accounting: The Basics
Introduction to Nonprofit Accounting: The BasicsIntroduction to Nonprofit Accounting: The Basics
Introduction to Nonprofit Accounting: The Basics
 
Key note speaker Neum_Admir Softic_ENG.pdf
Key note speaker Neum_Admir Softic_ENG.pdfKey note speaker Neum_Admir Softic_ENG.pdf
Key note speaker Neum_Admir Softic_ENG.pdf
 
Presentation by Andreas Schleicher Tackling the School Absenteeism Crisis 30 ...
Presentation by Andreas Schleicher Tackling the School Absenteeism Crisis 30 ...Presentation by Andreas Schleicher Tackling the School Absenteeism Crisis 30 ...
Presentation by Andreas Schleicher Tackling the School Absenteeism Crisis 30 ...
 
The basics of sentences session 2pptx copy.pptx
The basics of sentences session 2pptx copy.pptxThe basics of sentences session 2pptx copy.pptx
The basics of sentences session 2pptx copy.pptx
 
Grant Readiness 101 TechSoup and Remy Consulting
Grant Readiness 101 TechSoup and Remy ConsultingGrant Readiness 101 TechSoup and Remy Consulting
Grant Readiness 101 TechSoup and Remy Consulting
 
Class 11th Physics NEET formula sheet pdf
Class 11th Physics NEET formula sheet pdfClass 11th Physics NEET formula sheet pdf
Class 11th Physics NEET formula sheet pdf
 
BAG TECHNIQUE Bag technique-a tool making use of public health bag through wh...
BAG TECHNIQUE Bag technique-a tool making use of public health bag through wh...BAG TECHNIQUE Bag technique-a tool making use of public health bag through wh...
BAG TECHNIQUE Bag technique-a tool making use of public health bag through wh...
 
A Critique of the Proposed National Education Policy Reform
A Critique of the Proposed National Education Policy ReformA Critique of the Proposed National Education Policy Reform
A Critique of the Proposed National Education Policy Reform
 
Nutritional Needs Presentation - HLTH 104
Nutritional Needs Presentation - HLTH 104Nutritional Needs Presentation - HLTH 104
Nutritional Needs Presentation - HLTH 104
 
Mattingly "AI & Prompt Design: The Basics of Prompt Design"
Mattingly "AI & Prompt Design: The Basics of Prompt Design"Mattingly "AI & Prompt Design: The Basics of Prompt Design"
Mattingly "AI & Prompt Design: The Basics of Prompt Design"
 
Holdier Curriculum Vitae (April 2024).pdf
Holdier Curriculum Vitae (April 2024).pdfHoldier Curriculum Vitae (April 2024).pdf
Holdier Curriculum Vitae (April 2024).pdf
 
Student login on Anyboli platform.helpin
Student login on Anyboli platform.helpinStudent login on Anyboli platform.helpin
Student login on Anyboli platform.helpin
 
IGNOU MSCCFT and PGDCFT Exam Question Pattern: MCFT003 Counselling and Family...
IGNOU MSCCFT and PGDCFT Exam Question Pattern: MCFT003 Counselling and Family...IGNOU MSCCFT and PGDCFT Exam Question Pattern: MCFT003 Counselling and Family...
IGNOU MSCCFT and PGDCFT Exam Question Pattern: MCFT003 Counselling and Family...
 

Featured

AI Trends in Creative Operations 2024 by Artwork Flow.pdf
AI Trends in Creative Operations 2024 by Artwork Flow.pdfAI Trends in Creative Operations 2024 by Artwork Flow.pdf
AI Trends in Creative Operations 2024 by Artwork Flow.pdfmarketingartwork
 
PEPSICO Presentation to CAGNY Conference Feb 2024
PEPSICO Presentation to CAGNY Conference Feb 2024PEPSICO Presentation to CAGNY Conference Feb 2024
PEPSICO Presentation to CAGNY Conference Feb 2024Neil Kimberley
 
Content Methodology: A Best Practices Report (Webinar)
Content Methodology: A Best Practices Report (Webinar)Content Methodology: A Best Practices Report (Webinar)
Content Methodology: A Best Practices Report (Webinar)contently
 
How to Prepare For a Successful Job Search for 2024
How to Prepare For a Successful Job Search for 2024How to Prepare For a Successful Job Search for 2024
How to Prepare For a Successful Job Search for 2024Albert Qian
 
Social Media Marketing Trends 2024 // The Global Indie Insights
Social Media Marketing Trends 2024 // The Global Indie InsightsSocial Media Marketing Trends 2024 // The Global Indie Insights
Social Media Marketing Trends 2024 // The Global Indie InsightsKurio // The Social Media Age(ncy)
 
Trends In Paid Search: Navigating The Digital Landscape In 2024
Trends In Paid Search: Navigating The Digital Landscape In 2024Trends In Paid Search: Navigating The Digital Landscape In 2024
Trends In Paid Search: Navigating The Digital Landscape In 2024Search Engine Journal
 
5 Public speaking tips from TED - Visualized summary
5 Public speaking tips from TED - Visualized summary5 Public speaking tips from TED - Visualized summary
5 Public speaking tips from TED - Visualized summarySpeakerHub
 
ChatGPT and the Future of Work - Clark Boyd
ChatGPT and the Future of Work - Clark Boyd ChatGPT and the Future of Work - Clark Boyd
ChatGPT and the Future of Work - Clark Boyd Clark Boyd
 
Getting into the tech field. what next
Getting into the tech field. what next Getting into the tech field. what next
Getting into the tech field. what next Tessa Mero
 
Google's Just Not That Into You: Understanding Core Updates & Search Intent
Google's Just Not That Into You: Understanding Core Updates & Search IntentGoogle's Just Not That Into You: Understanding Core Updates & Search Intent
Google's Just Not That Into You: Understanding Core Updates & Search IntentLily Ray
 
Time Management & Productivity - Best Practices
Time Management & Productivity -  Best PracticesTime Management & Productivity -  Best Practices
Time Management & Productivity - Best PracticesVit Horky
 
The six step guide to practical project management
The six step guide to practical project managementThe six step guide to practical project management
The six step guide to practical project managementMindGenius
 
Beginners Guide to TikTok for Search - Rachel Pearson - We are Tilt __ Bright...
Beginners Guide to TikTok for Search - Rachel Pearson - We are Tilt __ Bright...Beginners Guide to TikTok for Search - Rachel Pearson - We are Tilt __ Bright...
Beginners Guide to TikTok for Search - Rachel Pearson - We are Tilt __ Bright...RachelPearson36
 
Unlocking the Power of ChatGPT and AI in Testing - A Real-World Look, present...
Unlocking the Power of ChatGPT and AI in Testing - A Real-World Look, present...Unlocking the Power of ChatGPT and AI in Testing - A Real-World Look, present...
Unlocking the Power of ChatGPT and AI in Testing - A Real-World Look, present...Applitools
 
12 Ways to Increase Your Influence at Work
12 Ways to Increase Your Influence at Work12 Ways to Increase Your Influence at Work
12 Ways to Increase Your Influence at WorkGetSmarter
 

Featured (20)

AI Trends in Creative Operations 2024 by Artwork Flow.pdf
AI Trends in Creative Operations 2024 by Artwork Flow.pdfAI Trends in Creative Operations 2024 by Artwork Flow.pdf
AI Trends in Creative Operations 2024 by Artwork Flow.pdf
 
Skeleton Culture Code
Skeleton Culture CodeSkeleton Culture Code
Skeleton Culture Code
 
PEPSICO Presentation to CAGNY Conference Feb 2024
PEPSICO Presentation to CAGNY Conference Feb 2024PEPSICO Presentation to CAGNY Conference Feb 2024
PEPSICO Presentation to CAGNY Conference Feb 2024
 
Content Methodology: A Best Practices Report (Webinar)
Content Methodology: A Best Practices Report (Webinar)Content Methodology: A Best Practices Report (Webinar)
Content Methodology: A Best Practices Report (Webinar)
 
How to Prepare For a Successful Job Search for 2024
How to Prepare For a Successful Job Search for 2024How to Prepare For a Successful Job Search for 2024
How to Prepare For a Successful Job Search for 2024
 
Social Media Marketing Trends 2024 // The Global Indie Insights
Social Media Marketing Trends 2024 // The Global Indie InsightsSocial Media Marketing Trends 2024 // The Global Indie Insights
Social Media Marketing Trends 2024 // The Global Indie Insights
 
Trends In Paid Search: Navigating The Digital Landscape In 2024
Trends In Paid Search: Navigating The Digital Landscape In 2024Trends In Paid Search: Navigating The Digital Landscape In 2024
Trends In Paid Search: Navigating The Digital Landscape In 2024
 
5 Public speaking tips from TED - Visualized summary
5 Public speaking tips from TED - Visualized summary5 Public speaking tips from TED - Visualized summary
5 Public speaking tips from TED - Visualized summary
 
ChatGPT and the Future of Work - Clark Boyd
ChatGPT and the Future of Work - Clark Boyd ChatGPT and the Future of Work - Clark Boyd
ChatGPT and the Future of Work - Clark Boyd
 
Getting into the tech field. what next
Getting into the tech field. what next Getting into the tech field. what next
Getting into the tech field. what next
 
Google's Just Not That Into You: Understanding Core Updates & Search Intent
Google's Just Not That Into You: Understanding Core Updates & Search IntentGoogle's Just Not That Into You: Understanding Core Updates & Search Intent
Google's Just Not That Into You: Understanding Core Updates & Search Intent
 
How to have difficult conversations
How to have difficult conversations How to have difficult conversations
How to have difficult conversations
 
Introduction to Data Science
Introduction to Data ScienceIntroduction to Data Science
Introduction to Data Science
 
Time Management & Productivity - Best Practices
Time Management & Productivity -  Best PracticesTime Management & Productivity -  Best Practices
Time Management & Productivity - Best Practices
 
The six step guide to practical project management
The six step guide to practical project managementThe six step guide to practical project management
The six step guide to practical project management
 
Beginners Guide to TikTok for Search - Rachel Pearson - We are Tilt __ Bright...
Beginners Guide to TikTok for Search - Rachel Pearson - We are Tilt __ Bright...Beginners Guide to TikTok for Search - Rachel Pearson - We are Tilt __ Bright...
Beginners Guide to TikTok for Search - Rachel Pearson - We are Tilt __ Bright...
 
Unlocking the Power of ChatGPT and AI in Testing - A Real-World Look, present...
Unlocking the Power of ChatGPT and AI in Testing - A Real-World Look, present...Unlocking the Power of ChatGPT and AI in Testing - A Real-World Look, present...
Unlocking the Power of ChatGPT and AI in Testing - A Real-World Look, present...
 
12 Ways to Increase Your Influence at Work
12 Ways to Increase Your Influence at Work12 Ways to Increase Your Influence at Work
12 Ways to Increase Your Influence at Work
 
ChatGPT webinar slides
ChatGPT webinar slidesChatGPT webinar slides
ChatGPT webinar slides
 
More than Just Lines on a Map: Best Practices for U.S Bike Routes
More than Just Lines on a Map: Best Practices for U.S Bike RoutesMore than Just Lines on a Map: Best Practices for U.S Bike Routes
More than Just Lines on a Map: Best Practices for U.S Bike Routes
 

Intro to R: free software for data analysis and graphics

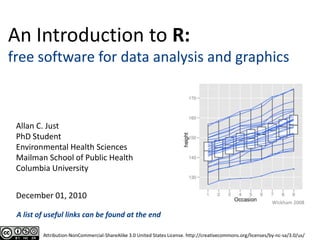
  • 1. An Introduction to R: free software for data analysis and graphics Allan C. Just PhD Student Environmental Health Sciences Mailman School of Public Health Columbia University December 01, 2010 Wickham 2008 A list of useful links can be found at the end Attribution-NonCommercial-ShareAlike 3.0 United States License. http://creativecommons.org/licenses/by-nc-sa/3.0/us/
  • 2. Intro to R Objectives After this workshop participants will be able to: Describe some capabilities and uses of R Search for help within R and use good coding practices for reproducible research in R Read in, summarize, and transform a simple dataset in R Create and save reproducible graphs from R (scatterplots, histograms, boxplots, bar charts)
  • 3. What is R? nytimes.com
  • 4. R has many uses Work with data: subset, merge, and transform datasets with a powerful syntax Analysis: use existing statistical functions like regression or write your own Graphics: graphs can be made quickly during analysis and polished for publication quality displays
  • 5. Why learn a whole language to look at data versus Excel? Recreate/redo your exact analysis Automate repetitive tasks Access to statistical methods not available in Excel Graphs are more elegant
  • 6. Why R versusSAS, SPSS, or Stata? It's free! It runs on Mac, Windows, and Linux It has state-of-the-art graphics capabilities It contains advanced statistical routines not yet available in other packages – a de facto standard in statistics Can program new statistical methods or automate data manipulation/analysis adapted from statmethods.net
  • 7. Made in SAS Redone in R learnr.wordpress.com
  • 8. R plots from my own research
  • 10. Forest plot to compare parameter estimates from many models
  • 11. Displaying lots of data: facetted histograms
  • 14. Choropleth map Shapefile: CIESIN, Columbia University Asthma data: http://nyc.gov/html/doh/downloads/pdf/asthma/asthma-hospital.pdf
  • 15. Intro to R: recap Objectives After this workshop participants will be able to: Describe some capabilities and uses of R Statistical data analysis Automation (scripting) of functions to work with data Elegant graphics to facilitate data visualization Search for help within R and use good coding practices for reproducible research in R Read in, summarize, and transform a simple dataset in R Create and save reproducible graphs from R (scatterplots, histograms, boxplots, bar charts)
  • 16. Learning a new language is difficult flickr.com/photos/dnorman/3732851541/
  • 17. What makes R difficult to learn R is designed to be flexible and powerful rather than simple but limited. R is a fully featured language mainly used from the command line. Learning the commands and the structure of the code takes time and practice. If I made a a typo you would know what I meant... The solution: be careful, build code in simple pieces and test as you go (learn to debug). Reuse code that works. Use helpful resources. Consider an alternative GUI for R.
  • 18. Getting help in R You can call for help on a function with a leading question mark and leaving off the () ?functionname Search online statmethods.net An Introduction to R in Windows found under Help – Manuals (in PDF)
  • 19. Suggestions for an R workflow Leave yourself informative comments # everything to the right of the pound sign # is unevaluated Using spaces and indents can help readability Use meaningful names for objects Save the bits of your code that work in a text editor - building a script of clean code that works from start-to-finish. With clean code instead of transformed data files it is easier to redo analyses if your data is updated or you want to change an earlier step Reproducible research!
  • 20. Intro to R: recap Objectives After this workshop participants will be able to: Describe some capabilities and uses of R Search for help within R and use good coding practices for reproducible research in R ?t.test will bring up R help Free manuals online: Introduction to R Also: statmethods.net #use comments; save the code that works to reproduce your results Read in, summarize, and transform a simple dataset in R Create and save reproducible graphs from R (scatterplots, histograms, boxplots, bar charts)
  • 21. Learning the languageMany important features Arithmetic and logical operators: +, <, … Data types: numeric, logical, … Data structures: vectors, matrices, … Functions – always end with (): median(x)
  • 22. Using R as a calculator Mathematical operators + - / * ^ log() abs()
  • 23. R can evaluate logical expressions == equal != not equal & and | or (vertical pipe) 10 < 20 [1] TRUE pi > 3 & 2^2 == 4 [1] TRUE "This" != "That" [1] TRUE
  • 24. Creating new objects Assignment operator is <- (looks like an arrow) x <- 10 “Set x to take the value 10” The symbols in this operator must be adjacent. x < - 10 What does this do? You can overwrite old values x <- x^2 “Set x to take the value x2”
  • 25. R operations are vectorized A vector is an ordered set of data of the same type (numeric, logical, dates, etc.) Concatenate function is c() x <- c(1, 2, 3) x^2 [1] 1 4 9 For integer sequences we can make vectors quickly with n:m 4:9 [1] 4 5 6 7 8 9 Vector recycling c(0,10) * c(1, 1, 1, 1) [1] 0 10 0 10
  • 26. Other object classes Matrices: lots of matrix operations you would always use the lm() function to fit a linear model but you could do it manually beta <- solve(t(X)%*%X)%*%t(X)%*%y Arrays: n-dimensional Lists: sets of objects (can be different classes)
  • 27. Indexing and subsetting refer to components of objects by a position index which goes between square braces x <- c(10, 20, 30) x [1] 10 20 30 x[2] return the second position in x [1] 20 x[c(1, 2)] return the first and second position in x [1] 10 20 x[-3] return all except the third position in x [1] 10 20 What wouldx[c(3, 2)]return?
  • 28. Data frames A data frame is a rectangular collection of data Rows: observations Columns: variables diamonds <- data.frame(carat, cut, price) carat cut price 1 0.23 Ideal 326 2 0.21 Premium 326 3 0.23 Good 327 4 0.29 Premium 334 5 0.31 Good 335 6 0.24 Very Good 336
  • 29. Data frames You can extract the variables as vectors with a $ diamonds$cut You can also index by position (or name) with square braces diamonds[2, 3] returns the single value in row 2, column 3 An empty index is treated like a wildcard and corresponds to all rows or columns depending on position diamonds[, "cut"] (same result as diamonds$cut) How would you return the first three rows and all columns? row, column
  • 30. R functions Thousands of functions are built-in: median() lm() linear model t.test() chisq.test() or make your own: inch.to.cm <- function(x){x * 2.54} inch.to.cm(74) [1] 187.96
  • 31. Missing values These take a value of NA Can be in a data object of any type (logical, numeric, character) By default operations on NA will return NA NA == NA [1] NA Can check for NA with is.na() y <- c(2, 10, NA, 12) is.na(y) [1] FALSE FALSE TRUE FALSE Can often pass na.rm = T option to remove NA values in operations mean(y) [1] NA mean(y, na.rm = T) [1] 8
  • 32. R has several thousandadditional packages time series survival spatial machine learning bioinformatics Interfaces to LaTeX, Excel, SQL databases, Twitter, google maps…
  • 33. Installing a package Open up R Click in to the console window and type: install.packages() Select a mirror (anywhere in the US) Find and select "ggplot2" and choose OK. This will download ggplot2 and the other packages which it requires.
  • 34. The default R graphical user interface (Windows)
  • 35. Rcmdr: an alternate graphic user interface
  • 36. JGR
  • 38. Recap on GUIs R Default Windows GUI: lacks additional features to make learning or programming easier Rcmdr: Drop-down menus for basic stats. Uses base graphics. Doesn't make programming easier. JGR: Makes programming easier with syntax highlighting and command argument suggestions. No menus for stats. Looks the same across platforms (Java based) Deducer: Adds menus for basic stats to JGR. Fewer menu driven stats than RCMDR but more flexible graphics options (building with ggplot2).
  • 39. R graphics – 3 main "dialects" Base: with(airquality, plot(Temp, Ozone)) Lattice: xyplot(Ozone ~ Temp, airquality) ggplot2: ggplot(airquality, aes(Temp, Ozone)) + geom_point( )
  • 41. ggplot2 philosophy Written by Hadley Wickham (Rice Univ.) Extends The Grammar of Graphics (Wilkinson, 2005) All graphs can be constructed by combining specifications with data (Wilkinson, 2005). A specification is a structured way to describe how to build the graph from geometric objects (points, lines, etc.) projected on to scales (x, y, color, size, etc.)
  • 42. ggplot2 philosophy When you can describe the content of the graph with the grammar, you don’t need to know the name of a particular type of plot… Dot plot, forest plot, Manhattan plot are just special cases of this formal grammar. …a plotting system with good defaults for a large set of components that can be combined in flexible and creative ways…
  • 43. Building a plot in ggplot2 data to visualize (a data frame) map variables to aesthetic attributes geometric objects – what you see (points, bars, etc) scales map values from data to aesthetic space faceting subsets the data to show multiple plots statistical transformations – summarize data coordinate systems put data on plane of graphic Wickham 2009
  • 44. A basic ggplot2 graph ggplot(airquality) + geom_point(aes(x = Temp, y = Ozone)) Aesthetics map variables to scales Data Geometric objects to display
  • 45. Help with learning ggplot2 Website: had.co.nz/ggplot2/ Book: ggplot2: Elegant Graphics for Data Analysis Hadley Wickham, 2009
  • 46. Intro to R: recap Objectives After this workshop participants will be able to: Describe some capabilities and uses of R Search for help within R and use good coding practices for reproducible research in R Read in, summarize, and transform a simple dataset in R With your neighbor, work through a script file analyzing data from the WHO - Global School Health Survey. Create and save reproducible graphs from R (scatterplots, histograms, boxplots, bar charts) The script contains code which you can run, modify, and take home!
  • 47. Setting up our R session in 5 steps then a quick break (laptop users only, file is already on desktops) Download and save the script file intro_to_r_script.txt available from: library.cumc.columbia.edu/rworkshop Open R ( icon) 3. Open script Success! 4. Switch to Files of type: "All files (*.*)" intro_to_r_script.txt is on Desktop or wherever you saved it 5. Help your neighbor, ask for help (if stuck), take a quick break
  • 48. A few helpful R links Download R: http://cran.r-project.org/available for Windows, Mac OS X, and Linux Advice – A clearly stated question with a reproducible example is far more likely to get help. You will often find your own solution by restating where you are getting stuck in a clear and concise way. Reproducible examples: https://gist.github.com/270442 General R links http://statmethods.net/ Quick-R for SAS/SPSS/Stata Users - An all around excellent reference site http://www.ats.ucla.edu/stat/R/ Resources for learning R from UCLA with lots of examples http://www.r-bloggers.com/learning-r-for-researchers-in-psychology/ This is a nice listing of R resources http://stackoverflow.com/questions/tagged/r Q&A forum for R programming questions - lots of good help! see also: http://crossvalidated.com for general stats & R ggplot2 links http://had.co.nz/ggplot2/ ggplot2 help & reference – lots of examples http://groups.google.com/group/ggplot2 ggplot2 user group – great for posting questions https://github.com/hadley/ggplot2/wiki ggplot2 wiki: answers many FAQs, tips & tricks http://www.slideshare.net/hadley/presentations Over 100 presentations by Hadley Wickham, author of ggplot2. A four-part video of a ½ day workshop by him starts here: http://had.blip.tv/file/3362248/ Setting up JGR in Windows JGR requires a JDK – speak to your IT person if this seems daunting (http://www.oracle.com/technetwork/java/javase/downloads/index.html) On Windows, JGR needs to be started from a launcher. For R version 2.12.0 on Windows with a 32bit R you will likely want to get the file jgr-1_62.exe as a launcher from here: http://www.rforge.net/JGR/ A discussion of the features of JGR can be found in this article (starting on page 9): http://stat-computing.org/newsletter/issues/scgn-16-2.pdf Deducer - an R package which works best in a working instance of JGR http://www.deducer.org/pmwiki/pmwiki.php?n=Main.DeducerManual There are great videos linked here introducing the Deducer package (although the volume is quite low) This slide last updated 12/4/2010

Editor's Notes

  1. Therefore, when we interpret the regression coefficient in the single models for MEHP, MECPP, and MEHHP, we should be cautious that the regression coefficient cannot be interpreted as the effect of a single phthalate only. It may represent the overall effect due to a set of highly correlated phthalates. The Bayesian models estimate and test the significance of the association due to each separate phthalate, while the single models in this setting informally show that, overall, these several phthalate metabolites have a strong negative association with gestational age.Like a group test with measurement error
  2. Daily NYC air quality measures from 1973 (Chambers 1983)