
Recommended
Recommended
More Related Content
What's hot
What's hot (20)
Similar to Effects of Global Warming
Similar to Effects of Global Warming (20)
Recently uploaded
Recently uploaded (20)
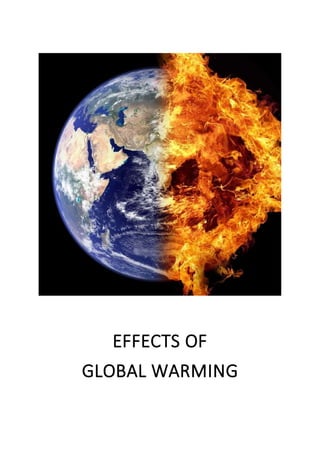
Effects of Global Warming
- 2. Members of Group 19 (Evening Batch) UTKARSH KUMAR (16UEC116) UTKARSH SINGH (16UEC117) VAIBHAV AGRAWAL (16UEC118) VAIBHAV MUNJAL (16UEC119) VAIBHAV NEGI (16UEC120) VAIBHAV TRIPATHI (16UEC121) Submitted To:- Dr. Arpi Majumder
- 3. What is Global Warming? Global warming, also referred to as climate change, is the observed century- scale rise in the average temperature of the Earth's climate system and its related effects. Multiple lines of scientific evidence show that the climate system is warming. Many of the observed changes since the 1950s are unprecedented in the instrumental temperature record which extends back to the mid-19th century, and in pale climate proxy records covering thousands of years. In the period from 1880 to 2012, the global average (land and ocean) surface temperature has increased by 0.85 [0.65 to 1.06] °C, multiple independently produced datasets confirm. In the period from 1906 to 2005, Earth's average surface temperature rose by 0.74±0.18 °C. The rate of warming almost doubled in the last half of that period (0.13±0.03 °C per decade, against 0.07±0.02 °C per decade). In the past, when the Earth experienced increases in temperature it was the result of natural causes but today it is being caused by the accumulation of greenhouse gases in the atmosphere produced by human activities. The natural greenhouse effect maintains the Earth's temperature at a safe level making it possible for humans and many other lifeforms to exist. However, since the Industrial Revolution human activities have significantly enhanced the greenhouse effect causing the Earth's average temperature to rise by almost 1°C. This is creating the global warming we see today. To put this increase in perspective it is important to understand that during the last ice age, a period of massive climate change, the average temperature change around the globe was only about 5°C. A long series of scientific research and international studies has shown, with more than 90% certainty, that this increase in overall temperatures is due to the greenhouse gases produced by humans. Activities such as deforestation and the burning of fossil fuels are the main sources of these emissions. These findings are recognized by the national science academies of all the major industrialized countries.
- 4. Global warming is affecting many places around the world. It is accelerating the melting of ice sheets, permafrost and glaciers which is causing average sea levels to rise. It is also changing precipitation and weather patterns in various places, making someplaces dryer, with more intense periods of drought and at the sametime making other places wetter, with stronger storms and increased flooding. These changes have affected both nature as well as human society and will continue to have increasingly worse effects if greenhouse gas emissions continue to grow at the same pace as today.
- 5. EFFECTS OF GLOBAL WARMING ON OCEANS Global warming can affect sea levels, coastlines, ocean acidification, ocean currents, seawater, sea surface temperatures, tides, the sea floor, weather, and trigger several changes in ocean bio-geochemistry; these affect the functioning of a society. SEA LEVEL Coasts There are a number of factors affecting rising sea levels, including the thermal expansion of seawater, the melting of glaciers and ice sheets on land, and possibly human changes to groundwater storage. Coastal regions would be most affected by rising sea levels. The increase in sea level along the coasts of continents, especially North America are much more significant than the global average. According to 2007 estimates by the InternationalPanel on Climate Change (IPCC), “global average sea level will rise between 0.6 and 2 feet (0.18 to 0.59 meters) in the next century. Along the U.S. Mid-Atlantic and Gulf Coasts, however, sea level rose in the last century 5 to 6 inches morethan the global average. This is due to the subsiding of coastal lands. The sea level along the U.S. Pacific coast has also increased more than the global average but less than along the Atlantic coast. This can be explained by the varying continental margins along both coasts; the Atlantic type continental margin is characterized by a wide, gently sloping continental shelf, while the Pacific type continental margin incorporates a narrow shelf and slope descending into a deep trench. Since low-sloping coastalregions should retreat faster than higher-sloping regions, the Atlantic coast is more vulnerable to sea level rise than the Pacific coast. Society The rise in sea level along coastal regions carries implications for a wide range of habitats and inhabitants. Firstly, rising sea levels will have a serious impact on beaches— a place which humans love to visit recreationally and a prime location for real estate. It is ideal to live on the coast, due to a more moderate climate and pleasant scenery, but beachfront property is at risk from eroding land and rising sea levels. Since the threat posed by rising sea levels has become more prominent, property owners and local government have taken measures to prepare for the worst.
- 6. The seas now absorb much of human-generated carbon dioxide, which then affects temperature change. The oceans store 93 percent of that energy which helps keep the planet liveable by moderating temperatures. A rise in sea level will have a negative impact not only on coastal property and economy but on our supply of fresh water. According to the EPA, “Rising sea level increases the salinity of both surface water and ground water through salt water intrusion.” Global Issue Since rising sea levels present a pressing problem not only to coastal communities but to the whole global population as well, much scientific research has been performed to analysethe causes and consequences of a rise in sea level. Many humanitarians and environmentalists believe that political policy needs to have a bigger role in carbon dioxide reduction. Humans have a substantial influence on the rise of sea level because we emit increasing levels of carbon dioxide into the atmosphere through automobile use and industry. A higher amount of carbon dioxide in the atmosphere leads to higher global temperatures, which then results in thermal expansion of seawater and melting of glaciers and ice sheets. OCEAN CURRENTS The currents in the world’s oceans are a result of varying temperatures associated with the changing latitudes of our planet. As the atmosphere is warmed nearest the equator, the hot air at the surface of our planet is heated, causing it to rise and draw in cooler air to take its place, creating what is known as circulation cells. This ultimately causes the air to be significantly colder near the poles than at the equator. It is important to note that ocean currents provide the necessary nutrients for life to sustain itself in the lower latitudes. Should the currents slow down, fewer nutrients would be brought to sustain ocean life resulting in a crumbling of the food chain and irreparable damage to the marine ecosystem. Slower currents would also mean less carbon fixation. Naturally, the ocean is the largest sink within which carbon is stored. When waters become saturated with carbon, excess carbon has nowhere to go, because the currents are not bringing up enough fresh water to fix the excess.
- 7. OCEAN ACIDIFICATION Another effect of global warming on the carbon cycle is ocean acidification.The ocean and the atmosphere constantly act to maintain a state of equilibrium, so a rise in atmospheric carbon naturally leads to a rise in oceanic carbon. When carbon is dissolved in water it forms hydrogen and bicarbonate ions, which in turn breaks down to hydrogen and carbonate ions. All these extra hydrogen ions increase the acidity of the ocean and make survival harder forplanktonicorganisms that depend on calcium carbonate to form their shells. A decrease in the base of the food chain will, once again, be destructive to the ecosystems to which they belong. With fewer of these photosynthetic organisms present at the surface of the ocean,less carbon will be converted to oxygen,thereby allowing the greenhouse gasses to go unchecked. The effects of ocean acidification can already be seen and have been happening since the start of the industrial revolution, with pH levels of the ocean dropping by 0.1 since the pre-industrial revolution times. An effect called coral bleaching can be seen on the Great Barrier Reef in Australia, where ocean acidification’s effects are already taking place. MARINE LIFE Research indicates that increasing ocean temperatures are taking a toll on the marine ecosystem. A study on the phytoplankton changes in the Indian Ocean indicates a decline of up to 20% in the marine phytoplanktonin the Indian Ocean, duringthe past six decades. The tuna catches rates have also declined abruptly during the past half century, mostly due to increased industrial fisheries, with the ocean warming adding further stress to the fish species.
- 8. CLIMATIC DISASTERS Five Pacific islands lost to rising seas as climate change hits Five tiny Pacific islands have disappeared due to rising seas and erosion, a discovery thought to be the first scientific confirmation of the impact of climate change on coastlines in the Pacific, according to Australian researchers. The submerged islands were part of the Solomon Islands, an archipelago that over the last two decades has seen annual sea levels riseas much as 10mm (0.4in), according to research published in the May issue of the online journal Environmental Research Letters. The missing islands, ranging in size from 1 to 5 hectares (2.5-12.4 acres) were not inhabited by humans. Typhoon Saola hits the Philippines as climate change hits Typhoon Haiyan is the strongest tropical cyclone to make landfall in history. Fierce wind and heavy rain from typhoon Saola has battered the Philippines, killing at least 10 people and over 700,000 people are displaced and at least 11 million people are affected. The storm has sustained winds of 120 kilometres (74 miles) per hour and gusts of 150 kph (93 mph).
- 9. A satellite image of Typhoon Haiyan over the Philippines. Pakistan Floods In August 2013 floodwaters inundated up to one fifth of Pakistan and affected an estimated 20 million people. Research has shown that Pakistan is suffering from a global phenomenon of more frequent and intense weather patterns that put many communities’ lives and livelihoods at risk. A man sits atop the remains of his house destroyed in the Pakistan floods in August 2013.
- 10. Global Warming and Coral Reefs Coral reefs are colourful underwater forests which teem with life and act as a natural protective barrier for coastal regions. The fishes and plants which call them home belong to some of the most diverse--and fragile--ecosystems on the planet. In one year alone, 16 percent of the world's coral reefs were wiped out. A sea temperature change of a mere one degree Celsius would yield similar losses. Increasing levels of carbon dioxide in the water cause additional damage to corals, leaving them defenceless against storm damage and erosion. CORAL REEF HABITAT The spectacular and delicate coral reefs of Florida, Hawaii and Puerto Rico are ecological gems and important economic resources. Often called "rainforests of the sea" for their rich biodiversity, the coral on which these diverse ecosystems are based are LIVING organisms themselves. They form when polyps--the living portion of stony corals--extract calcium from seawater and combine it with carbon dioxide to construct the elaborate limestone skeletons that form the reef. BENEFITS FOR HUMANS AND WILDLIFE In coral reefs around the world thousands of marine species find food and shelter, which in turn support economically valuable recreational and commercial fishing. Coral reefs also form a breakwater for adjacent coasts, providing natural protection from storm surges. Coral reefs are hotspots for the tourism industry, which thrive on providing visitors with unforgettable scuba diving and snorkelling experiences. The coral reefs off the Florida Keys help generate more than $1.6 billion in revenues annually.
- 11. THREATSFROMGLOBALWARMINGON CORAL REEFS Higher sea temperatures fromglobal warming have already caused major coral bleaching events. Bleaching occurs when corals respond to the stress of warmer temperatures by expelling the colourful algae that live within them. Some coral are able to recover, but too often the coral dies, and the entire ecosystem for which it forms the base, virtually disappears. Longer-lasting and more extensive bleaching events are already on the rise, with further increases expected in the decades ahead as ocean temperatures continue to rise. Warmer waters are also expected to increase the incidence of other coral diseases such as black band disease, white band disease, white plague, and white pox, all of which can lead to mass mortality of coral, and subsequently the entire ecosystem it supports. Ocean acidification--which occurs when oceans absorb carbon dioxide from the atmosphere--is also a threat to coral. As the oceans become more acidic, the corals' ability to form skeletons through calcification is inhibited, causing their growth to slow. A doubling of atmospheric carbon dioxide will reduce calcification in some corals by as much as 50 percent. Sea level rise caused by melting sea ice and thermal expansion of the oceans could also cause problems for some reefs by making them too deep to receive adequate sunlight, another factor important for survival.
- 12. What is Coral Bleaching? Warmer water temperatures can result in coral bleaching. When water is too warm, corals will expel the algae (zooxanthellae) living in their tissues causing the coral to turn completely white. This is called coral bleaching. When coral bleaches, it is not dead. Corals can survive a bleaching event, but they are under more stress and are subject to mortality. In 2005, the U.S. lost half of its coral reefs in the Caribbean in one year due to a massive bleaching event. The warm waters centered around the northern Antilles near the Virgin Islands and Puerto Rico expanded southward. Comparison of satellite data from the previous 20 years confirmed that thermal stress from the 2005 event was greater than the previous 20 years combined. Not all bleaching events are due to warm water. In January 2010, chilly water temperatures in the Florida Keys caused a coral bleaching event that resulted in some coral death. Water temperatures dropped 12.06 degrees Fahrenheit lower than the typical temperatures observed at this time of year. Researchers will evaluate if this cold-stress event will make corals more susceptible to disease in the same way that warmer waters impact corals.
- 13. What causes coral bleaching? The corals that form the great reef ecosystems of tropical seas depend upon a symbiotic relationship with algae-like single- celled flagellate protozoa called zooxanthellae that live within their tissues and give the coral its coloration. The zooxanthellae provide the coral with nutrients through photosynthesis, a crucial factor in the clear and nutrient-poor tropical waters. In exchange, the coral provides the zooxanthellae with the carbon dioxide and ammonium needed for photosynthesis. Negative environmental conditions thwart the coral's ability to provide for the zooxanthellae's needs. To ensure short-term survival, the coral-polyp then expels the zooxanthellae. This leads to a lighter or completely white appearance, hence the term "bleached". As the zooxanthellae provide for up to 90% of the coral's energy needs through photosynthesis, after expelling, the coral begins to starve.
- 14. The main cause of coral bleaching is heat stress resulting from high sea temperatures. Temperature increases of only one degree Celsius for only four weeks can trigger bleaching events. If these temperatures persist for longer periods (eight weeks or more) corals begin to die. High water temperatures can affect reefs at regional and global scale. Other stressors can also cause bleaching, including freshwater inundation (low salinity) and poor water quality from sediment or pollutant run-off.
- 15. Ecological impacts of coral bleaching and related mortality Coral bleaching and associated mortality not only have negative impacts on coral communities, but they also impact fish communities and the human communities that depend on coral reefs and associated fisheries for livelihoods and wellbeing. Bleached corals are likely to have reduced growth rates, decreased reproductive capacity, increased susceptibility to diseases and elevated mortality rates. Changes in coral community composition can occur when more susceptible species are killed by bleaching events. Changes in coral communities also affect the species that depend on them, such as the fish and invertebrates that rely on live coral for food, shelter, or recruitment habitat. Change in the abundance and composition of reef fish assemblages may occur when corals die because of coral bleaching. Declines in genetic and species diversity may occur when corals die because of bleaching. Socioeconomicimpactsof coral bleaching and related mortality Degraded coral reefs are less able to provide the ecosystem services on which local human communities depend. For example, degraded reefs are less productive and may not be able to sustain accretion rates necessary to ensure reefs continue to provide shoreline protection services. Reefs damaged by coral bleaching can quickly lose many of the features that underpin the aesthetic appeal that is fundamental to reef tourism. The resultant loss of revenue from reduced tourist activity can threaten the livelihoods of local communities.
- 16. Coral bleaching events that lead to significant coral mortality can drive large shifts in fish communities. This can translate into reduced catches for fishers targeting reef fish species, which in turn leads to impacts on food supply and associated economic activities. Cultural values of many tropical island communities (e.g., religious sites and traditional uses of marine resources) depend upon healthy coral reef ecosystems and can be adversely affected by coral bleaching. Coral reefs are a valuable source of pharmaceutical compounds. Degraded and dead reefs are less likely to serveas a sourcefor important medicinal resources (i.e., drugs to treat heart disease, cancer, and other illnesses).
- 17. GLOBAL WARMING AND El-Nino El Niño is the warmphase of the El Niño Southern Oscillation (commonly called ENSO) and is associated with a band of warm ocean water that develops in the central and east-central equatorial Pacific (between approximately the International Date Line and 120°W), including off the Pacific coast of South America. El Niño Southern Oscillation refers to the cycle of warm and cold temperatures, as measured by sea surface temperature, SST, of the tropical central and eastern Pacific Ocean. El Niño is accompanied by high air pressure in the western Pacific and low air pressure in the eastern Pacific. The cool phase of ENSO is called "La Niña" with SST in the eastern Pacific below average and air pressures high in the eastern and low in western Pacific. The ENSO cycle, both El Niño and La Niña, cause global changes of both temperatures and rainfall. Developing countries that are dependent upon agriculture and fishing, particularly those bordering the Pacific Ocean, are usually most affected. In American Spanish, the capitalized term "El Niño" refers to "the little boy", so named because the pool of warm water in the Pacific near South America is often at its warmest around Christmas. The original name, "El Niño de Navi dad", traces its origin centuries back to Peruvian fishermen, who named the weather phenomenon about the new-born Christ. "La Niña", chosen as the 'opposite' of El Niño, literally translates to "the little girl". What is La Niña? La Niña is a strengthening of the normal trade winds that typically occurs after El Niño. Basically, the normal, non-El Niño wind cycle is reinforced, pushing the warmest waters in the equatorial pacific further west than normal, and increasing the pulling up of cold water to the surfacein the east. La Niña has an effect on global weather, as well, and this effect is typically the opposite of El Niño, causing droughts in the eastern equatorial Pacific and floods in the western equatorial pacific.
- 18. El Niño and La Niña are opposite phases of what is known as the El Niño- Southern Oscillation (ENSO) cycle. The ENSO cycle is a scientific term that describes the fluctuations in temperature between the ocean and atmosphere in the east-central Equatorial Pacific (approximately between the International Date Line (180°) and 120° West longitude. La Niña is sometimes referred to as the cold phase of ENSO and El Niño as the warm phase of ENSO. These deviations from normal surface temperatures can have large-scale impacts not only on ocean processes, but also on global weather and climate. El Niño and La Niña episodes typically last nine to 12 months, but some prolonged events may last for years. They often begin to form between June and August, reach peak strength between December and April, and then decay between May and July of the following year. While their periodicity can be quite irregular, El Niño and La Niña events occur about every three to five years. Typically, El Niño occurs more frequently than La Niña.
- 19. Occurrences of El-Nino El Niño events are thought to have been occurring for thousands of years. For example, it is thought that El Niño affected the Inca Empire in modern-day Peru, who sacrificed humans to try and prevent the rains. It is thought that there have been at least 30 El Niño events since 1900, with the 1982-83, 1997–98 and 2014–16 events among the strongest on record. Since 2000, El Niño events have been observed in 2002–03, 2004–05, 2006–07, 2009–10 and 2014–16. Major ENSO events were recorded in the years 1790–93, 1828, 1876– 78, 1891, 1925–26, 1972–73, 1982–83, 1997–98, and 2014–16. Typically, this anomaly happens at irregular intervals of two to seven years, and lasts nine months to two years. The average period length is five years. When this warming occurs for seven to nine months, it is classified as El Niño "conditions"; when its duration is longer, it is classified as an El Niño "episode". There is no consensus on whether climate change will have any influence on the occurrence, strength or duration of El Niño events, as research supports El Niño events becoming stronger, longer, shorter and weaker. During strong El Niño episodes, a secondary peak in sea surface temperature across the far eastern equatorial Pacific Ocean sometimes follows the initial peak.
- 20. What are The Effects of El Niño on the Weather? The main impacts of El Niño occur in and around the Tropics. The following are some of the effects El Niño has on the weather in this part of the world: In South America, there is a drastic increase in the risk of flooding on the western coast, while there is an increase in the risk of droughts on parts of the eastern coast. In eastern countries, like India and Indonesia, there is an increase in droughts. In general, El Niño causes vast amounts of rainfall in the eastern parts of the Pacific (the western coast of South America), and very dry weather on the western parts (India, Indonesia). With all the extra heat at the surface of the Pacific Ocean, energy is released into the atmosphere, causing an overall warming of the global climate temporarily. Years in which El Niño occurs tend to feature higher temperatures across the globe. The effects of El Niño on the weather peak in December and can last for several months after that. After El Niño, the trade and easterly winds often fall back into their normal, self-perpetuating cycle. However, on some occasions the effect is reversed in a process called La Niña. During La Niña, the trade winds are strengthened, causing the normal cycle to be more dramatic and having the reverse effect of El Niño.
- 21. What are the Economic Effects of El Niño? In Asian countries, there is typically a decrease in rice production. With an increase in droughts on the western side of the equatorial Pacific, GDP in the countries in that area tend to drop during the El Niño cycle. For countries in that area that harvest rice, water is needed, and the lack of rain can have a huge impact on their rice production. Because rice production is of great importance in many of these Asian countries, El Niño has a negative impact on these countries’ economies. In non-Asian countries that are impacted by these El Niño related droughts, such as Australia, the droughts can cause a decrease in the harvesting of other crops, like wheat. For farmers and exporters of these crops, El Niño has a very negative economic impact, similar to that of rice production and exportation in the Asian countries. Meanwhile, the dramatic increase in rainfall on the eastern side of the equatorial Pacific drastically increases the chances of flooding in countries in that area. This flooding can cause property damage to the point where people have to leave their homes and seek shelter elsewhere. The flooding can also cause damage to crops, leading to a similar impact economically that occurs with the droughts on the western part of the equatorial Pacific. Fishing in equatorial coastal countries like Ecuador and Peru becomes difficult, as fish in the waters near these countries tend to disappear in the months of December and January.
- 22. Overall, the drastic change in weather that occurs due to El Niño has a negative economic impact on many countries near the equator. While normal years offer more stable weather, thus leading to more predictable effects on certain markets, El Niño years have a dramatic shift in the weather pattern that leads to extreme weather on either side of the equatorial Pacific. This extreme weather, whether it be drought or flood, has a negative impact on the living conditions and extraction of natural resources in Tropical countries. El Niño is a naturally occurring event, and there is nothing that can be done to stop its effects on the weather or on people around the world. However, because it can typically be noticed by meteorologists, people in the countries affected by it can take measures in order to curb some of the impact. Whether it be preparing for floods or droughts, people in the countries affected by El Niño must take the steps necessary to protect themselves. This can include stocking up on water in the case of a drought, or making sure their homes are able to handle flood waters. Because of the effect on many important crops in these countries, some steps for preparation might also include stocking up on these crops in preparation for the droughts or for damage caused by the flooding.
- 23. Effects of El-Nino in Indian Monsoon Generally, El Nino and the Indian Monsoon rains are inversely related. Trade winds coming from South America normally blow westward towards Asia during Southwest Monsoon. Warming of the Pacific Ocean results in weakening of these winds. Therefore, moisture and heat content gets limited and results in reduction and uneven distribution of rainfall across the Indian sub-continent.The most prominent droughts in India, six of them, since 1871 have been El Nino triggered droughts, including the recent ones that occurred in 2002 and 2009. Nevertheless, it is important to note that all El Nino years do not lead to drought in India.The year 1997-98 is a stark reminder as it was a strong El Nino year but that did not cause drought in India, in fact, rainfall was in excess. On the other hand, a moderate El Nino in 2002 resulted in one of the worst droughts. El Nino events are prompted by natural fluctuation in ocean temperatures in the Pacific but have a global impact, leading to flooding, droughts and heat waves. They also exacerbate the increased extreme weather events occurring due to the continued heating of the world as a result of human-caused climate change. The impacts of El Niño events vary but often lead to hot, dry conditions in south and eastern Australia, as well as in Indonesia, the Philippines and south-eastern Africa. The Indian monsoon rainfall, upon which millions depend, also tends to be lower than normal. Wetter than usual conditions are typicallyseen alongthe Gulf coast of the US, and the west coast of tropical South America.
- 24. Effects of Global Warming in India Climate of India India exhibits a wide diversityof temperatures.The Himalayas participate in warming by preventing the cold winds from blowing in, and the Thar desert attracts the summer monsoon winds, which are responsible for making most of the monsoon season of India. However, most of the regions can be considered climatically tropical. The climate of India is dominated by the monsoon season, which is the most important seasonofIndia,providing80% of the annual rainfall. The season extends from June to September with an average annual rainfall between 750–1,500 mm across the region. The monsoon of India is regarded as the most productive wet season on the earth. Intergovernmental Panel on Climate Change (IPCC) describes Monsoon as a tropical and subtropical seasonal reversal in both the surface winds and associated precipitation, caused by differential heating between a continental-scale land mass and the adjacent ocean. As explained above, the Himalayas and the Thar Desert are important forces controlling this season.The monsoon severity has increased in the last few decades due to the process of global warming, leading to the dreaded floods in India.
- 25. Impact of Global Warming The effect of global warming on the climate of India has led to climate disasters as per some experts. India is a disaster-prone area, with the statistics of 27 out of 35 states beingdisaster prone, with foods being the most frequent disasters. The process of global warming has led to an increase in the frequency and intensity of these climatic disasters. According to surveys, in the year 2007-2008, India ranked the third highest in the world regardingthe number of significant disasters,with 18 such events in one year, resulting in the death of 1103 people due to these catastrophes. The anticipated increase in precipitation, the melting of glaciers and expandingseas havethe power to influence the Indian climate negatively, with an increase in incidence of floods, hurricanes, and storms. With the increasing trends of global warming, predictions of severer climatic events have been made for India. The anticipated increase in precipitation,the meltingof glaciers and expanding seas are projected to influence the Indian climate particularly severely, with an increase in incidence of floods,hurricanes,and storms.Global warmingis also posing as a mammoth threat to the foods security situation in India with recurring and severe droughts and ravaging floods engulfing the arable land.RisingTemperatures on the Tibetan Plateau are causing the melting of the Himalayan glaciers, reducing the water flow in the rivers Ganges, Brahmaputra, Yamuna, and other major rivers, on which the livelihoods of hundreds of thousands of farmers depend.
- 26. Recent Climatic Disasters In India Floods in India India is the most flood distressed state in the world after Bangladesh, accounting for 1/ 5th of the global deaths every year with 30 million people displaced from their homes yearly. Approximately 40 million hectares of the land is vulnerable to floods, with 8 million hectares affected by it. Unprecedented floods take place every year at one place or the other, with the most vulnerable states of India being Uttar Pradesh, Bihar, Assam, West Bengal, Gujarat, Orissa, Andhra Pradesh, Madhya Pradesh, Maharashtra, Punjab and Jammu & Kashmir. 1. FLOODS IN BIHAR: Bihar is an over populated state in Northern India, extremely prone to floods. The total area covered by the state of Bihar is 94,163 km2. Its average elevation above sea level is 173 feet. Bihar faces the predicament of floods almost every year, with the link between India and Nepal through the Koshi River being one of the main reasons for the flood in Bihar. Excessive rainfall due to the recent global warming in Nepal leads to an overloading of dams and leads to flash floods in the Bihar region. a) 1987 Bihar Flood: The flood of 1987 in Bihar was so destructive that it left a total of 1400 people and more than 5000 animal dead. A total of 67,881+680.86 lac INR was the damage to the state; affecting more than 29 million people. After this flood, the River Koshi has been named as” Sorrow of Bihar” (Bihar ka shok). b) 2008 Bihar floods: The 2008 Bihar floods are considered as one of the most disastrous floods in the state’s history. The flood affected more than 2 million people. The flooded and affected areas were Supaul, Araria, Madhepura, Saharsa, Champaran and Purnea.
- 27. Climate Related Effect on Butterfly Warming temperatures have been shown to have both positive and negative effects on populations of British butterflies. Species at the northern limit of their ranges have been able to expand their ranges, moving northwards throughout the UK. Species such as Orange-tip and Peacock have become common in Scotland as the climate has become suitable. Silver-spotted Skipper has been able to colonies new habitats on north facing slopes, having previously been mainly restricted to south facing slopes. Similarly, temperature rises have also been associated with increases in Adonis Blue populations. Recent research has also shown that warming temperatures have facilitated the spread of the Brown Argus throughout England through increased use of host plants it previously only rarely used. Migrant species have also increased in number in response to recent warming. Red Admiral and Clouded Yellow to a lesser extent, now regularly over-winter in the UK to produce resident populations due to increasingly favourable conditions. The story is likely to be the reverse for those species at their southern range limit in the UK with evidence to suggest that their ranges are contracting at the southern edge and/or at lower elevations, a result echoed in studies elsewhere in Europe. Population responses of these species are mixed, however, as numbers of Scotch Argus and Large Heath have both increased on monitored sites, whilst Northern Brown Argus has declined. In addition, most species have started to appear progressively earlier in the year, and this has been strongly linked with increased temperatures. Many species are now able to produce more than one brood in warm years, and this is increasingly observed at monitored sites. For example, Wood White now regularly produces a second brood at most sites where it is monitored, whereas at the start of monitoring this was a much rarer occurrence. Meta-analyses have shown that butterflies and other primary consumers may be advancing at different rates to both their hosts and their predators leading to concerns over potential temporal mismatching in trophic interactions.
- 28. Habitat Related Effect on Butterfly Habitat loss and changes in habitat management have been the greatest drivers of change in UK butterfly populations. Numerous studies on butterfly ecology have helped conservationists to restore suitable habitat, and subsequent monitoring through the UKBMS has enabled us to determine how successful this has been. In recent years some of our most threatened species, including the Pearl-bordered Fritillary and Heath Fritillary have started to show recovery across sites where habitat conservation has been put in place. The Large Blue has been successfully re-introduced into England and has now spread naturally into other suitable areas, whilst populations on monitored sites have significantly increased. However, many species are still strongly affected by management of habitats; biodiversity indicators using UKBMS data show that both woodland and farmland butterflies are declining. Colonisation of newly restored habitats has been shown to take several years, and is related to a species’ mobility and diet, with less mobile species and those with localised host plants taking longest. Models have shown the potential importance of – landscape- versus site-scale conservation. Habitat heterogeneity has been shown to be important for enhancing and stabilising butterfly populations. The habitat connecting butterfly populations affects species’ ability to disperse to new sites and their ability to recovery after population crashes (e.g. caused by extreme events such as drought). Many species have shown significant declines despite the predicted positive effects of climate warming. Those that have increased have generally done so because conservation management has been put in place, for example the Adonis Blue and Silver-spotted Skipper where grazing is essential. Research has also shown that contrary to the expectation that more habitats will be used by butterflies as they move northwards with climate warming, many species’ habitat associations have reduced over time. The expected cause of this is the deleterious effects of habitat degradation.
- 29. Cold-weather or warm-weather “Warm associated species are those that occur mainly in the warmer locations of Europe and, conversely, cold-associated species are likely to be restricted to more northerly countries and upland areas.” Over time, studies have shown that the proportion of warm- weather species within the UK’s bird and butterfly populations is increasing, while the proportion of cold-weatherspecies is decreasing. Other scientists have interpretedthis as bird and butterfly populations keeping pace with climate change by favouring species that can best tolerate warmer conditions.But the new study says this overall pattern masks much more subtle changes going on. Using data from the UK Butterfly Monitoring Scheme and the Commons Birds Census, the researchers analysed114 bird and 63 butterfly species at 613 sites over the past 30 years. The authors found that both warm and cold-weather bird species have declined in total abundance and species richness over the past three decades. Cold-weatherspecies have seen numbers drop much faster in that time, however. In other words, the growing proportion of warm-weather birds over the past 30 years is less to do with an increase in those species per se and is more being driven by the loss of cold-weather species, including extinctions in some sites. This suggests a more pessimistic outlook for Britain’s birds in response to climate change than previously thought. Butterflies appear to be coping with climate change relativelybetter than birds, showing minor change in cold-weather species at the same time as a small rise in those that prefer warmth.
- 30. Relationship between increasingly high land-use intensity (left to right, x-axis) and decreasing abundance (top to bottom, y-axis) for cold-weather birds (top left) and butterflies (bottom left) and warm-weather birds (top right) and butterflies (bottom right) Source: Oliver et al., (2017)
- 31. Other major effects of Global Warming Agriculture: Global warming can affect agriculture. As the global temperature will increase, plants will find it harder to survive and will die. Plants are the major source of food for human beings and as a result food shortage may occur. The shortage of the food may lead to war and conflicts in some countries. Rise of Sea Levels: The melting of polar ice-caps and less water evaporating into the atmosphere are causing increased sea levels. Quaint coastal towns and cities near the U.S. east coast and Gulf of Mexico are just a few areas where devastating flood damage is starting to make its mark in history. Hurricanes Frequency: As the temperature of the oceans rises, hurricanes and other storms are likely to become stronger. With the increase in the global warming, the water in the ocean warms up and it heats up the surrounding air, creating hurricanes. Diseases: As the temperature becomes warmer, it can affect the health of humans and the diseases they are exposed to. With the increase in the rainfall, water borne diseases are likely to spread like malaria. The earth will become warmer and as a result heat waves are likely to increase that can cause a major blow to the people. Fresh Water: Our fresh water supply will great diminish with global warming. With the demise of coral reefs and the ecosystems therein, less fresh water will flow into lakes and tributaries. More heat wave deaths as temperatures rise across India: Rising summer temperatures are leading to more heat-related deaths in India. As parts of India reel under a heat wave, a study has said summer temperatures had gone up by more than 0.5 degrees Celsius on an averageover five decades, and that this risehas increased the probability of deaths caused by heat by 146%. The study by University of California, Irvine(UCI) with co-authors from the Indian Instituteof Technology – Bombay (IIT-B) and IIT-Delhi, analysed daily temperatures from 395 weather stations between 1960 and 2009, and the death rates during those years.
- 32. Global Warming and Its Implications for India Global warming is an increase in the average temperature over a longer period of the Earth’s atmosphere which causes changes in the global climate. Right from the North Pole to the South Pole every place of the Earth is warming and is actually up by more than 1-degree Fahrenheit (0.8 degree Celsius) which has specially become sensitive in the Polar regions. India and the other countries in South Eastern Asia are expected to tolerate warming above the global mean throughout the 21st century. There will be a huge seasonal variation of temperatures in India. The heat waves have increased abnormally in India in recent years which continue for a longer period with warmer temperatures at night and hotter days. Due to these heat waves, there will be lot of changes in summer monsoon precipitation and will affect the Indian agriculture sector drastically. For the past 30 years the average number of category 4 and 5 hurricanes each year has increased due to the global warming. Indian coastline is very much susceptible to cyclones and it has been observed that the Bay of Bengal experiences more cyclones than the Arabian Sea. The most susceptiblecyclonic States are West Bengal, Odisha, Andhra Pradesh and Tamil Nadu along the Bay of Bengal which are mostly affected.
- 33. NASA Study Finds Indian, Pacific Oceans Temporarily Hide Global Warming A new NASA study of ocean temperature measurements shows in recent years extra heat from greenhouse gases has been trapped in the waters of the Pacific and Indian oceans. Researchers say this shifting pattern of ocean heat accounts for the slowdown in the global surface temperature trend observed during the past decade. During the 20th century, as greenhouse gas concentrations increased and trapped more heat energy on Earth, global surface temperatures also increased. However, in the 21st century, this pattern seemed to change temporarily. Greenhouse gases continued to trap extra heat, but for about 10 years starting in the early 2000s, global average surface temperature stopped climbing, and even cooled a bit. Scientists have high confidence that global temperatures will continue to rise for decades to come, largely due to greenhouse gases produced by human activities. The Intergovernmental Panel on Climate Change (IPCC), which includes more than 1,300 scientists from the United States and other countries, forecasts a temperature rise of 2.5 to 10 degrees Fahrenheit over the next century.
- 34. HOW CAN WE STOP GLOBAL WARMING? Nations around the world are upping their game in the fight against climate change, even as PresidentTrump recently announced the U.S.'s withdrawal fromthe Paris Agreement. And despite this reckless move, American mayors, state leaders, county officials, governors, major companies, and millions of citizens across our country havepledged that they're "still in" when it comes to the agreement, and supporting the goal of limiting future warming to well below 2 degrees Celsius. It’s importantto remember the equally vital contributions that can be made by private citizens—which is to say, by you. “Changeonly happens when individuals take action,” AliyaHaq, deputy director of NRDC’s CleanPower Plan initiative, says. “There’s no other way, if it doesn’tstart with people.” The goal is simple. Carbon dioxide is the climate’s worstenemy. It’s released when oil, coal, and other fossilfuels are burned for energy—the energy we use to power our homes, cars, and smartphones. By using less of it, wecan curb our own contribution to climate changewhile also saving money. Here are a dozen easy, effective ways each one of us can make a difference: 1. Speak up! What’s thesinglebiggest way you can makean impact on global climatechange? “Talk to your friends and family, and makesureyour representatives aremaking good decisions,” Haq says. By voicing your concerns—via socialmedia or, better yet, directly to your elected officials—you send a messagethat you careabout thewarming world. EncourageCongress to enact new laws that limit carbon emissions and requirepolluters to pay for theemissions they produce. “Themain reason elected officials do anything difficult is becausetheir constituents makethem,” Haq says. You can help protect public lands, stop offshoredrilling.
- 35. 2. Power your home with renewable energy. Choosea utility company thatgenerates at least half its power from wind or solar and has been certified by Green-e Energy, an organization that vets renewableenergy options. If that isn’t possiblefor you, look at your electric bill; many utilities now list other ways to support renewablesources on their monthly statementsand websites. 3. Weatherize, weatherize, weatherize. “Building heating and cooling areamong thebiggest uses of energy,” Haq says. Indeed, heating and air-conditioning account for almosthalf of homeenergy use. You can make your spacemoreenergy efficient by sealing drafts and ensuring it’s adequately insulated. You can also claim federal tax credits for many energy-efficiency home improvements. 4. Invest in energy-efficient appliances. Sincethey were first implemented nationally in 1987, efficiency standards for dozens of appliances and products havekept 2.3 billion tons of carbon dioxideout of theair. That’s about thesameamount as theannual carbon pollution coughed up by nearly 440 million cars. “Energy efficiency is the lowest-cost way to reduceemissions,” Haq says. When shopping for refrigerators, washing machines, and other appliances, look for the Energy Star label. It will tell you which are themost efficient. 5. Reduce water waste. Saving water reduces carbon pollution, too. That's becauseit takes a lot of energy to pump, heat, and treat your water. So, takeshorter showers, turn off thetap while brushing your teeth, and switch to Water Sense-labelled fixtures and appliances. The EPA estimates that if just oneout of every 100 American homes wereretrofitted with water-efficient fixtures, about 100 million kilowatt-hours of electricity per year would be saved—avoiding 80,000 tonsof global warming pollution.
- 36. 6. Eat the food you buy—and make less of it meat. Approximately 10 percent of U.S. energy usegoes into growing, processing, packaging, and shipping food—about 40 percent of which just winds up in thelandfill. “If you’re wasting less food, you’relikely cutting down on energy consumption,” Haq says. And sincelivestock products areamong themost resource-intensiveto produce, eating meat-free meals can makea significant difference, too. 7. Buy better bulbs. LED lightbulbs useup to 80 percent less energy than conventional incandescent. They’re also cheaper in thelong run: A 10-watt LEDthat replaces your traditional 60-watt bulb will saveyou $125 over the lightbulb’s life. 8. Pull the plug(s). Taken together, theoutlets in your homearelikely powering about 65 different devices – an averageload for a homein theU.S. Audio and video devices, cordless vacuums and power tools, and other electronics useenergy even when they'renot charging. This "idle load" across all U.S. households adds up to theoutput of 50 largepower plants in the U.S. So, don't leavefully charged devices plugged into your home's outlets, unplug rarely used devices or plug them into power strips and timers, and adjust your computers and monitors to automaticallypower down to thelowest power modewhen not in use. 9. Drive a fuel-efficientvehicle. Gas-smart cars, such as hybrids and fully electric vehicles, savefuel and money. And once all cars and light trucks meet 2025’s clean car standards, which means averaging 54.5 miles per gallon, they’ll bea mainstay. For good reason: Relativeto a national fleet of vehicles that averaged only 28.3 miles per gallon in 2011, Americans will spend $80 billion less at thepump each year and cut their automotiveemissions by half. Beforeyou buy a new set of wheels, comparefuel-economy performance here.
- 37. 10. Maintain your ride. If all Americans kept their tires properly inflated, wecould say 1.2 billion gallons of gas each year. A simpletune-up can boost miles per gallon anywherefrom 4 percent to 40 percent, and a new air filter can get you a 10 percent boost. 11. Rethink planes, trains, and automobiles. Choosing to livein walkable smart-growth cities and townswith qualitypublic transportation leads to less driving, less money spenton fuel, and less pollution in the air. Less frequent flying can makea significant difference, too. “Air transport is a major sourceof climatepollution,” Haq says. “If you can takea train instead, do that.” 12. Shrink your carbon profile. You can offset the carbon you produceby purchasing carbon offsets, which represent clean power that you can add to thenation’s energy grid in place of power from fossil fuels. But not all carbon offset companies arealike. Do your homework to find thebest supplier. “It’s time to teach everyone to beat global warming.”