SlideShare a Scribd company logo
1 of 10
Download to read offline
Getting the most out of Facebook Insights
Presented by Sarah Baughman and Karen Jeannette, eXtension


Insights Basics
Please note you must be an administrator on the Facebook Page that you want to analyze!

To access Insights, click on “Insights” on left side of page


                                                                                          1|Page
You should see this in the middle of the page:


       Key metrics to view here are noted along the top bar. Also note that this is ONLY for the previous week.
       You can click on the small arrows next to each metric for an explanation of that metric.
       The pink circles at the bottom show the number of posts. The green line is “people talking about this”
        and the blue line is your “weekly total reach”
       Take a look at the “peaks and valleys.” For instance on this page, you might wonder why the weekly
        total reach fell so much around February 15th.


                                                                                                     2|Page
Next you want to take a look at the bottom of this page w here the posts are listed.


      This section lists the post by date.
      You can learn more about each column by clicking on the small question mark next to each column
       label.
      You will want to spend some time exploring your posts. What posts are going viral? Are there
       similarities in the types of posts that are most viral (like video links, new articles, etc)?
      Think about the goals for your Facebook page. Are your posts getting you towards those goals?

After you have explored your posts go back to the top left and under Insights you will see “Likes.” Click
on “Likes” to learn more about the people who have “liked” your page. There are two main sections,
demographics and locations and where your likes are coming from or how people are finding you.


                                                                                                 3|Page
   Note the box with the date at the top of this page. You can customize the date range for likes by
       clicking on the arrow in that box.
      Start by looking at your demographics: Are they what you would expect? Are you reaching your target
       audience?
      It can also be interesting to get a sense for the countries and cities where the most people are from that
       like your page. Keep in mind that cities listed often encompass a broad area and are identified by the
       closest major city.

Now take a look at where your likes come from


      Starting on the left side of the screen, you can see your new likes by date as well as unlikes. This is also
       a good place to examine hills and valleys. What made one day get you more likes or unlikes?
      Next take a look at “Like Sources” to learn how people are finding your page. Click on the small question
       marks next to each source to find out what that means. This is an interesting metric to examine over
       time to see if there are trends based on other actions you have taken.


                                                                                                       4|Page
After you have explored your “likes” go back to the top left and under Insights you will see “Reach.”
Click on “Reach” to learn more about the people who are actually viewing your page or posts.


      Once again you can customize the date range by clicking on the arrow next to the date.
      The first section you will see is demographics and locations. This looks similar to the information you
       saw under likes. The difference is “Likes” demographics tells you about the people who have clicked
       “like” on your page whereas “Reach” demographics tells you about the people who have seen any
       content associated with your page.

Now take a look at how you reached people


      Notice that you can change what type of page content you want to explore by clicking on the arrow next
       to “All Page Content” box.
      The first graph shows you how many people saw any content about your page and whether these
       people were reached directly by you (organic), from a friend (viral) or via a paid ad (paid).
      You can also explore how frequently individuals are accessing your page by looking at “Unique Users by
       Frequency.” It is nice to see people being reached more than one or twice.


                                                                                                      5|Page
Now take a look at visits to your page


      The final section under reach is titled “Visits to Your Page”.
      The graph tells you how many times the page has been viewed versus the number of unique visitors.
       Unique visitors is a better indicator of your reach because it only counts a visitor one time no matter
       how many times they return to the page that day.
      On the bottom left, you can see more details on how people are viewing your page.
      The “External Referrers” list is helpful in understanding where people are coming from to your page.
       For instance it is useful to know that the blog is directing people to the Facebook page considerably
       more often than the public web presence.


                                                                                                       6|Page
After you have explored your “Reach” go back to the top left and under Insights you will see “Talking
about This.” Click on “Talking about this” to learn more about how you are engaging with people.


      Once again you can modify the date range by clicking on the arrow next to the date box.
      The first box gives you the demographics and locations of the people who are talking about your page.
       Talking about your page means they have created a story about your page. For instance they may have
       shared a link on their home page about your post.

Now take a look at how people are talking about your page


      Once again you can customize the type of story you want to see so you can get either a big picture view
       with “all stories” or a more specific view with page likes or questions.
      This particular set of graphs is interesting because it tells us that during the week of February 8 – 14
       while only 68 people created a story about this page, 5750 people saw that story. So someone(s) who
       shared or created a story was very influential! It would be worth investigating further to see who
       shared what type of story so these results can be replicated.


                                                                                                     7|Page
Finally, for those true data lovers…..

Return to the main “Insights” page by clicking on “Insights” on the left side of the page.


Notice the box on the right side of the page that says “Export Data.” This allows you to get all of the data we
have just seen by customized date plus much more!

To export data, click on the “Export Data” box and you will get a pop-up that looks like this:


To download data, select “page level data” in a “comma-separated values” format (you can save as excel later)
for the desired date range. I use .csv because I have found that the file doesn’t download well directly into
excel. I open as .csv and then save as .xls file.


                                                                                                       8|Page
When prompted, click to open the file then save before you start looking at the data. Your file will look like this


This file gives you much more detail about the activity on your facebook page. The columns I find particularly
useful are:

       Column D - 28 Days The number of people sharing stories about your page.
       Coumn G - 28 Days The number of stories created about your Page. (Total Count)
       Column L - 28 Days The number of people who engaged with your Page. Engagement includes any click
        or story created. (Unique Users)
       Column W - 28 Days The number of people who have seen any content associated with your Page.
        (Unique Users)
       Column AF - 28 Days The number of people who saw your Page or one of its posts from a story
        published by a friend
       Column AI - 28 Days The number of impressions seen of any content associated with your Page. (Total
        Count)
       Coumn AY - 28 Days The number of people who saw any of your Page posts. (Unique Users)
       Column BH - 28 Days The number of people who saw your Page posts via a story from a friend. (Unique
        Users)
       Column GN - 28 Days The number of people who clicked on any of your content. Clicks generating
        stories are included in "Other Clicks." Stories generated without clicks on page content (e.g.,
        liking the page in Timeline) are not included. (Unique Users)

                                                                                                         9|Page
   Column GP - 28 Days The number of clicks on any of your content. Clicks generating stories are included
       in "Other Clicks." Stories generated without clicks on page content (e.g., liking the page in
       Timeline) are not included. (Total Count)
      Colunn XE - 28 Days The number of people who have given negative feedback to your Page. (Unique
       Users)

Be sure to save your downloaded file on a regular basis (weekly, monthly, quarterly or whatever works for you)
so that you will have access to the historical data!


                                                                                                   10 | P a g e

More Related Content

Viewers also liked

Viewers also liked (7)

Beyond Logic Models: Evaluating Complex Programs
Beyond Logic Models: Evaluating Complex  ProgramsBeyond Logic Models: Evaluating Complex  Programs
Beyond Logic Models: Evaluating Complex Programs
 
Discussion for MFLN F2F January 2015
Discussion for MFLN F2F January 2015Discussion for MFLN F2F January 2015
Discussion for MFLN F2F January 2015
 
Twitter - Measuring Reach and Engagement
Twitter - Measuring Reach and EngagementTwitter - Measuring Reach and Engagement
Twitter - Measuring Reach and Engagement
 
Social Media Measurement
Social Media Measurement Social Media Measurement
Social Media Measurement
 
Social media101
Social media101Social media101
Social media101
 
NeXC 2012 evaluating social media 101 presentation
NeXC 2012 evaluating social media 101 presentationNeXC 2012 evaluating social media 101 presentation
NeXC 2012 evaluating social media 101 presentation
 
Social Media Evaluation Webinar for NAEPSDP
Social Media Evaluation Webinar for NAEPSDP Social Media Evaluation Webinar for NAEPSDP
Social Media Evaluation Webinar for NAEPSDP
 

Similar to Getting the most out of Facebook Insights

Page insights en_usbar
Page insights en_usbarPage insights en_usbar
Page insights en_usbar
Hadi Salahi
 
Page Insights Guide
Page Insights GuidePage Insights Guide
Page Insights Guide
Javier Ruiz
 
Facebok page insights guide [October 7, 2011]
Facebok page insights guide [October 7, 2011]Facebok page insights guide [October 7, 2011]
Facebok page insights guide [October 7, 2011]
Tâm Nguyễn Đức Minh
 
Form 39-01 facepage-insights-guide
Form   39-01  facepage-insights-guideForm   39-01  facepage-insights-guide
Form 39-01 facepage-insights-guide
MikeKelly01
 
Facebook Page insights- New guide
Facebook Page insights- New guideFacebook Page insights- New guide
Facebook Page insights- New guide
Stephane Allard
 
Facebook Page Insights Guide
Facebook Page Insights GuideFacebook Page Insights Guide
Facebook Page Insights Guide
James Garrow
 
Ict project for social change subject for Empowerment Technology
Ict project for social change subject for Empowerment TechnologyIct project for social change subject for Empowerment Technology
Ict project for social change subject for Empowerment Technology
RouAnnNavarroza
 

Similar to Getting the most out of Facebook Insights (20)

Page insights en_us
Page insights en_usPage insights en_us
Page insights en_us
 
Aws app post to plutoone
Aws app post to plutooneAws app post to plutoone
Aws app post to plutoone
 
Facebook Page Insights
Facebook Page InsightsFacebook Page Insights
Facebook Page Insights
 
Page insights en_usbar
Page insights en_usbarPage insights en_usbar
Page insights en_usbar
 
Page Insights Guide
Page Insights GuidePage Insights Guide
Page Insights Guide
 
Facebook Page Insights Guide
Facebook Page Insights GuideFacebook Page Insights Guide
Facebook Page Insights Guide
 
Facebook page insights guide
Facebook page insights guideFacebook page insights guide
Facebook page insights guide
 
Facebook Page Insights Guide
Facebook Page Insights GuideFacebook Page Insights Guide
Facebook Page Insights Guide
 
Facebok page insights guide [October 7, 2011]
Facebok page insights guide [October 7, 2011]Facebok page insights guide [October 7, 2011]
Facebok page insights guide [October 7, 2011]
 
Nowe statystyki Facebooka: przewodnik
Nowe statystyki Facebooka: przewodnikNowe statystyki Facebooka: przewodnik
Nowe statystyki Facebooka: przewodnik
 
Page insights guide
Page insights guidePage insights guide
Page insights guide
 
Guía de Estadísticas Facebook 2011 (Facebook Insights)
Guía de Estadísticas Facebook 2011 (Facebook Insights)Guía de Estadísticas Facebook 2011 (Facebook Insights)
Guía de Estadísticas Facebook 2011 (Facebook Insights)
 
Form 39-01 facepage-insights-guide
Form   39-01  facepage-insights-guideForm   39-01  facepage-insights-guide
Form 39-01 facepage-insights-guide
 
Facebook page insights-guide
Facebook page insights-guideFacebook page insights-guide
Facebook page insights-guide
 
Facebook Page Insights Guide
Facebook Page Insights GuideFacebook Page Insights Guide
Facebook Page Insights Guide
 
Facebook Page insights- New guide
Facebook Page insights- New guideFacebook Page insights- New guide
Facebook Page insights- New guide
 
Facebook Page Insights Guide
Facebook Page Insights GuideFacebook Page Insights Guide
Facebook Page Insights Guide
 
Facebook Page insights - New Guide
Facebook Page insights - New GuideFacebook Page insights - New Guide
Facebook Page insights - New Guide
 
Ict project for social change subject for Empowerment Technology
Ict project for social change subject for Empowerment TechnologyIct project for social change subject for Empowerment Technology
Ict project for social change subject for Empowerment Technology
 
Facebook Insights
Facebook InsightsFacebook Insights
Facebook Insights
 

More from Sarah Baughman

More from Sarah Baughman (9)

10 tips for Effective Online Focus Groups
10 tips for Effective Online Focus Groups10 tips for Effective Online Focus Groups
10 tips for Effective Online Focus Groups
 
Social media demographics for extension
Social media demographics for extensionSocial media demographics for extension
Social media demographics for extension
 
Pinterest: Pinning for Success
Pinterest: Pinning for SuccessPinterest: Pinning for Success
Pinterest: Pinning for Success
 
Facebook insights update nex conf
Facebook insights update nex confFacebook insights update nex conf
Facebook insights update nex conf
 
Infographic Basics for eXtension Evaluation Community of Practice
Infographic Basics for eXtension Evaluation Community of PracticeInfographic Basics for eXtension Evaluation Community of Practice
Infographic Basics for eXtension Evaluation Community of Practice
 
Using a Developmental Approach to Evaluating Innovative Extension Programs
Using a Developmental Approach to Evaluating Innovative Extension ProgramsUsing a Developmental Approach to Evaluating Innovative Extension Programs
Using a Developmental Approach to Evaluating Innovative Extension Programs
 
Using Online Focus Groups to Inform Staff and Professional Development
Using Online Focus Groups to Inform Staff and Professional DevelopmentUsing Online Focus Groups to Inform Staff and Professional Development
Using Online Focus Groups to Inform Staff and Professional Development
 
Online survey basics
Online survey basicsOnline survey basics
Online survey basics
 
Reporting CoP evaluation results
Reporting CoP evaluation resultsReporting CoP evaluation results
Reporting CoP evaluation results
 

Recently uploaded

Jual Obat Aborsi Hongkong ( Asli No.1 ) 085657271886 Obat Penggugur Kandungan...
Jual Obat Aborsi Hongkong ( Asli No.1 ) 085657271886 Obat Penggugur Kandungan...Jual Obat Aborsi Hongkong ( Asli No.1 ) 085657271886 Obat Penggugur Kandungan...
Jual Obat Aborsi Hongkong ( Asli No.1 ) 085657271886 Obat Penggugur Kandungan...
ZurliaSoop
 
1029-Danh muc Sach Giao Khoa khoi 6.pdf
1029-Danh muc Sach Giao Khoa khoi  6.pdf1029-Danh muc Sach Giao Khoa khoi  6.pdf
1029-Danh muc Sach Giao Khoa khoi 6.pdf
QucHHunhnh
 
Salient Features of India constitution especially power and functions
Salient Features of India constitution especially power and functionsSalient Features of India constitution especially power and functions
Salient Features of India constitution especially power and functions
KarakKing
 

Recently uploaded (20)

General Principles of Intellectual Property: Concepts of Intellectual Proper...
General Principles of Intellectual Property: Concepts of Intellectual  Proper...General Principles of Intellectual Property: Concepts of Intellectual  Proper...
General Principles of Intellectual Property: Concepts of Intellectual Proper...
 
Kodo Millet PPT made by Ghanshyam bairwa college of Agriculture kumher bhara...
Kodo Millet  PPT made by Ghanshyam bairwa college of Agriculture kumher bhara...Kodo Millet  PPT made by Ghanshyam bairwa college of Agriculture kumher bhara...
Kodo Millet PPT made by Ghanshyam bairwa college of Agriculture kumher bhara...
 
Introduction to Nonprofit Accounting: The Basics
Introduction to Nonprofit Accounting: The BasicsIntroduction to Nonprofit Accounting: The Basics
Introduction to Nonprofit Accounting: The Basics
 
Application orientated numerical on hev.ppt
Application orientated numerical on hev.pptApplication orientated numerical on hev.ppt
Application orientated numerical on hev.ppt
 
Sociology 101 Demonstration of Learning Exhibit
Sociology 101 Demonstration of Learning ExhibitSociology 101 Demonstration of Learning Exhibit
Sociology 101 Demonstration of Learning Exhibit
 
Jual Obat Aborsi Hongkong ( Asli No.1 ) 085657271886 Obat Penggugur Kandungan...
Jual Obat Aborsi Hongkong ( Asli No.1 ) 085657271886 Obat Penggugur Kandungan...Jual Obat Aborsi Hongkong ( Asli No.1 ) 085657271886 Obat Penggugur Kandungan...
Jual Obat Aborsi Hongkong ( Asli No.1 ) 085657271886 Obat Penggugur Kandungan...
 
1029-Danh muc Sach Giao Khoa khoi 6.pdf
1029-Danh muc Sach Giao Khoa khoi  6.pdf1029-Danh muc Sach Giao Khoa khoi  6.pdf
1029-Danh muc Sach Giao Khoa khoi 6.pdf
 
Mehran University Newsletter Vol-X, Issue-I, 2024
Mehran University Newsletter Vol-X, Issue-I, 2024Mehran University Newsletter Vol-X, Issue-I, 2024
Mehran University Newsletter Vol-X, Issue-I, 2024
 
Salient Features of India constitution especially power and functions
Salient Features of India constitution especially power and functionsSalient Features of India constitution especially power and functions
Salient Features of India constitution especially power and functions
 
Key note speaker Neum_Admir Softic_ENG.pdf
Key note speaker Neum_Admir Softic_ENG.pdfKey note speaker Neum_Admir Softic_ENG.pdf
Key note speaker Neum_Admir Softic_ENG.pdf
 
How to Manage Global Discount in Odoo 17 POS
How to Manage Global Discount in Odoo 17 POSHow to Manage Global Discount in Odoo 17 POS
How to Manage Global Discount in Odoo 17 POS
 
On National Teacher Day, meet the 2024-25 Kenan Fellows
On National Teacher Day, meet the 2024-25 Kenan FellowsOn National Teacher Day, meet the 2024-25 Kenan Fellows
On National Teacher Day, meet the 2024-25 Kenan Fellows
 
How to Give a Domain for a Field in Odoo 17
How to Give a Domain for a Field in Odoo 17How to Give a Domain for a Field in Odoo 17
How to Give a Domain for a Field in Odoo 17
 
Basic Civil Engineering first year Notes- Chapter 4 Building.pptx
Basic Civil Engineering first year Notes- Chapter 4 Building.pptxBasic Civil Engineering first year Notes- Chapter 4 Building.pptx
Basic Civil Engineering first year Notes- Chapter 4 Building.pptx
 
TỔNG ÔN TẬP THI VÀO LỚP 10 MÔN TIẾNG ANH NĂM HỌC 2023 - 2024 CÓ ĐÁP ÁN (NGỮ Â...
TỔNG ÔN TẬP THI VÀO LỚP 10 MÔN TIẾNG ANH NĂM HỌC 2023 - 2024 CÓ ĐÁP ÁN (NGỮ Â...TỔNG ÔN TẬP THI VÀO LỚP 10 MÔN TIẾNG ANH NĂM HỌC 2023 - 2024 CÓ ĐÁP ÁN (NGỮ Â...
TỔNG ÔN TẬP THI VÀO LỚP 10 MÔN TIẾNG ANH NĂM HỌC 2023 - 2024 CÓ ĐÁP ÁN (NGỮ Â...
 
Accessible Digital Futures project (20/03/2024)
Accessible Digital Futures project (20/03/2024)Accessible Digital Futures project (20/03/2024)
Accessible Digital Futures project (20/03/2024)
 
Dyslexia AI Workshop for Slideshare.pptx
Dyslexia AI Workshop for Slideshare.pptxDyslexia AI Workshop for Slideshare.pptx
Dyslexia AI Workshop for Slideshare.pptx
 
Python Notes for mca i year students osmania university.docx
Python Notes for mca i year students osmania university.docxPython Notes for mca i year students osmania university.docx
Python Notes for mca i year students osmania university.docx
 
Fostering Friendships - Enhancing Social Bonds in the Classroom
Fostering Friendships - Enhancing Social Bonds  in the ClassroomFostering Friendships - Enhancing Social Bonds  in the Classroom
Fostering Friendships - Enhancing Social Bonds in the Classroom
 
Single or Multiple melodic lines structure
Single or Multiple melodic lines structureSingle or Multiple melodic lines structure
Single or Multiple melodic lines structure
 

Getting the most out of Facebook Insights

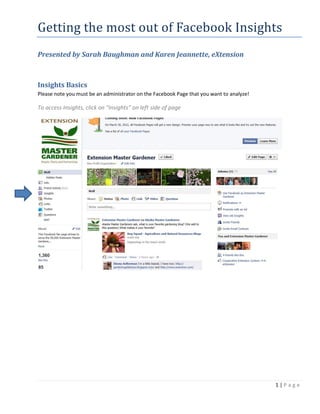
  • 1. Getting the most out of Facebook Insights Presented by Sarah Baughman and Karen Jeannette, eXtension Insights Basics Please note you must be an administrator on the Facebook Page that you want to analyze! To access Insights, click on “Insights” on left side of page 1|Page
  • 2. You should see this in the middle of the page:  Key metrics to view here are noted along the top bar. Also note that this is ONLY for the previous week.  You can click on the small arrows next to each metric for an explanation of that metric.  The pink circles at the bottom show the number of posts. The green line is “people talking about this” and the blue line is your “weekly total reach”  Take a look at the “peaks and valleys.” For instance on this page, you might wonder why the weekly total reach fell so much around February 15th. 2|Page
  • 3. Next you want to take a look at the bottom of this page w here the posts are listed.  This section lists the post by date.  You can learn more about each column by clicking on the small question mark next to each column label.  You will want to spend some time exploring your posts. What posts are going viral? Are there similarities in the types of posts that are most viral (like video links, new articles, etc)?  Think about the goals for your Facebook page. Are your posts getting you towards those goals? After you have explored your posts go back to the top left and under Insights you will see “Likes.” Click on “Likes” to learn more about the people who have “liked” your page. There are two main sections, demographics and locations and where your likes are coming from or how people are finding you. 3|Page
  • 4. Note the box with the date at the top of this page. You can customize the date range for likes by clicking on the arrow in that box.  Start by looking at your demographics: Are they what you would expect? Are you reaching your target audience?  It can also be interesting to get a sense for the countries and cities where the most people are from that like your page. Keep in mind that cities listed often encompass a broad area and are identified by the closest major city. Now take a look at where your likes come from  Starting on the left side of the screen, you can see your new likes by date as well as unlikes. This is also a good place to examine hills and valleys. What made one day get you more likes or unlikes?  Next take a look at “Like Sources” to learn how people are finding your page. Click on the small question marks next to each source to find out what that means. This is an interesting metric to examine over time to see if there are trends based on other actions you have taken. 4|Page
  • 5. After you have explored your “likes” go back to the top left and under Insights you will see “Reach.” Click on “Reach” to learn more about the people who are actually viewing your page or posts.  Once again you can customize the date range by clicking on the arrow next to the date.  The first section you will see is demographics and locations. This looks similar to the information you saw under likes. The difference is “Likes” demographics tells you about the people who have clicked “like” on your page whereas “Reach” demographics tells you about the people who have seen any content associated with your page. Now take a look at how you reached people  Notice that you can change what type of page content you want to explore by clicking on the arrow next to “All Page Content” box.  The first graph shows you how many people saw any content about your page and whether these people were reached directly by you (organic), from a friend (viral) or via a paid ad (paid).  You can also explore how frequently individuals are accessing your page by looking at “Unique Users by Frequency.” It is nice to see people being reached more than one or twice. 5|Page
  • 6. Now take a look at visits to your page  The final section under reach is titled “Visits to Your Page”.  The graph tells you how many times the page has been viewed versus the number of unique visitors. Unique visitors is a better indicator of your reach because it only counts a visitor one time no matter how many times they return to the page that day.  On the bottom left, you can see more details on how people are viewing your page.  The “External Referrers” list is helpful in understanding where people are coming from to your page. For instance it is useful to know that the blog is directing people to the Facebook page considerably more often than the public web presence. 6|Page
  • 7. After you have explored your “Reach” go back to the top left and under Insights you will see “Talking about This.” Click on “Talking about this” to learn more about how you are engaging with people.  Once again you can modify the date range by clicking on the arrow next to the date box.  The first box gives you the demographics and locations of the people who are talking about your page. Talking about your page means they have created a story about your page. For instance they may have shared a link on their home page about your post. Now take a look at how people are talking about your page  Once again you can customize the type of story you want to see so you can get either a big picture view with “all stories” or a more specific view with page likes or questions.  This particular set of graphs is interesting because it tells us that during the week of February 8 – 14 while only 68 people created a story about this page, 5750 people saw that story. So someone(s) who shared or created a story was very influential! It would be worth investigating further to see who shared what type of story so these results can be replicated. 7|Page
  • 8. Finally, for those true data lovers….. Return to the main “Insights” page by clicking on “Insights” on the left side of the page. Notice the box on the right side of the page that says “Export Data.” This allows you to get all of the data we have just seen by customized date plus much more! To export data, click on the “Export Data” box and you will get a pop-up that looks like this: To download data, select “page level data” in a “comma-separated values” format (you can save as excel later) for the desired date range. I use .csv because I have found that the file doesn’t download well directly into excel. I open as .csv and then save as .xls file. 8|Page
  • 9. When prompted, click to open the file then save before you start looking at the data. Your file will look like this This file gives you much more detail about the activity on your facebook page. The columns I find particularly useful are:  Column D - 28 Days The number of people sharing stories about your page.  Coumn G - 28 Days The number of stories created about your Page. (Total Count)  Column L - 28 Days The number of people who engaged with your Page. Engagement includes any click or story created. (Unique Users)  Column W - 28 Days The number of people who have seen any content associated with your Page. (Unique Users)  Column AF - 28 Days The number of people who saw your Page or one of its posts from a story published by a friend  Column AI - 28 Days The number of impressions seen of any content associated with your Page. (Total Count)  Coumn AY - 28 Days The number of people who saw any of your Page posts. (Unique Users)  Column BH - 28 Days The number of people who saw your Page posts via a story from a friend. (Unique Users)  Column GN - 28 Days The number of people who clicked on any of your content. Clicks generating stories are included in "Other Clicks." Stories generated without clicks on page content (e.g., liking the page in Timeline) are not included. (Unique Users) 9|Page
  • 10. Column GP - 28 Days The number of clicks on any of your content. Clicks generating stories are included in "Other Clicks." Stories generated without clicks on page content (e.g., liking the page in Timeline) are not included. (Total Count)  Colunn XE - 28 Days The number of people who have given negative feedback to your Page. (Unique Users) Be sure to save your downloaded file on a regular basis (weekly, monthly, quarterly or whatever works for you) so that you will have access to the historical data! 10 | P a g e