Downloaded 51 times
![JMX Syntax
[domain]:[key1]=[value1],[key2]=[value2] …
org.apache.cassandra.metrics:type=ColumnFamily,keyspace=outbrain,scope=user_events,name=TotalDiskSpaceUsed](https://image.slidesharecdn.com/osa19lliqxgg9ght7vge-signature-5ebad17a8e958bd16de143f0587d32bdb93052c076173d66bb108c243849a2e6-poli-141029123908-conversion-gate02/75/Monitoring-Cassandra-with-graphite-using-Yammer-Coda-Hale-Library-12-2048.jpg)
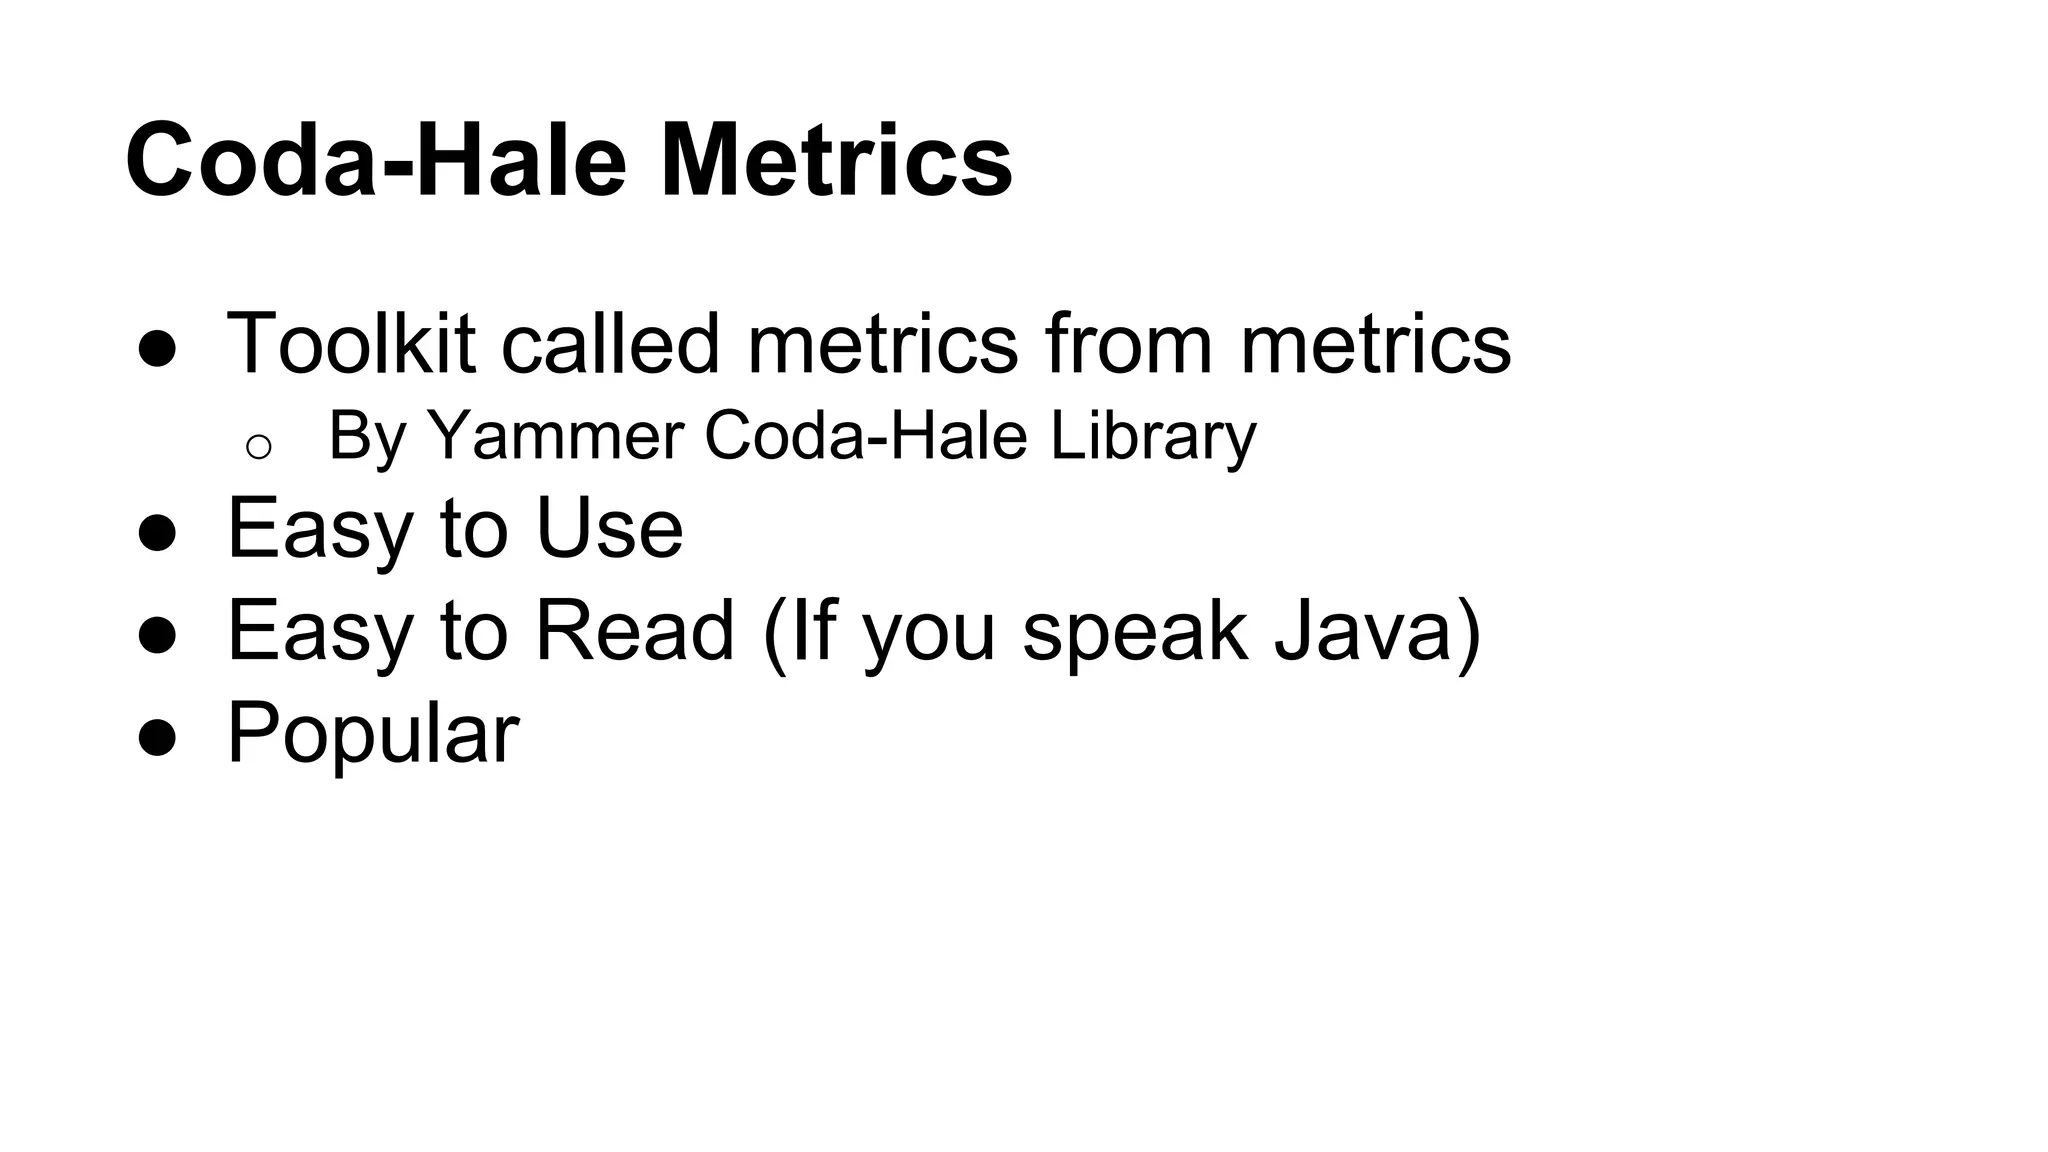
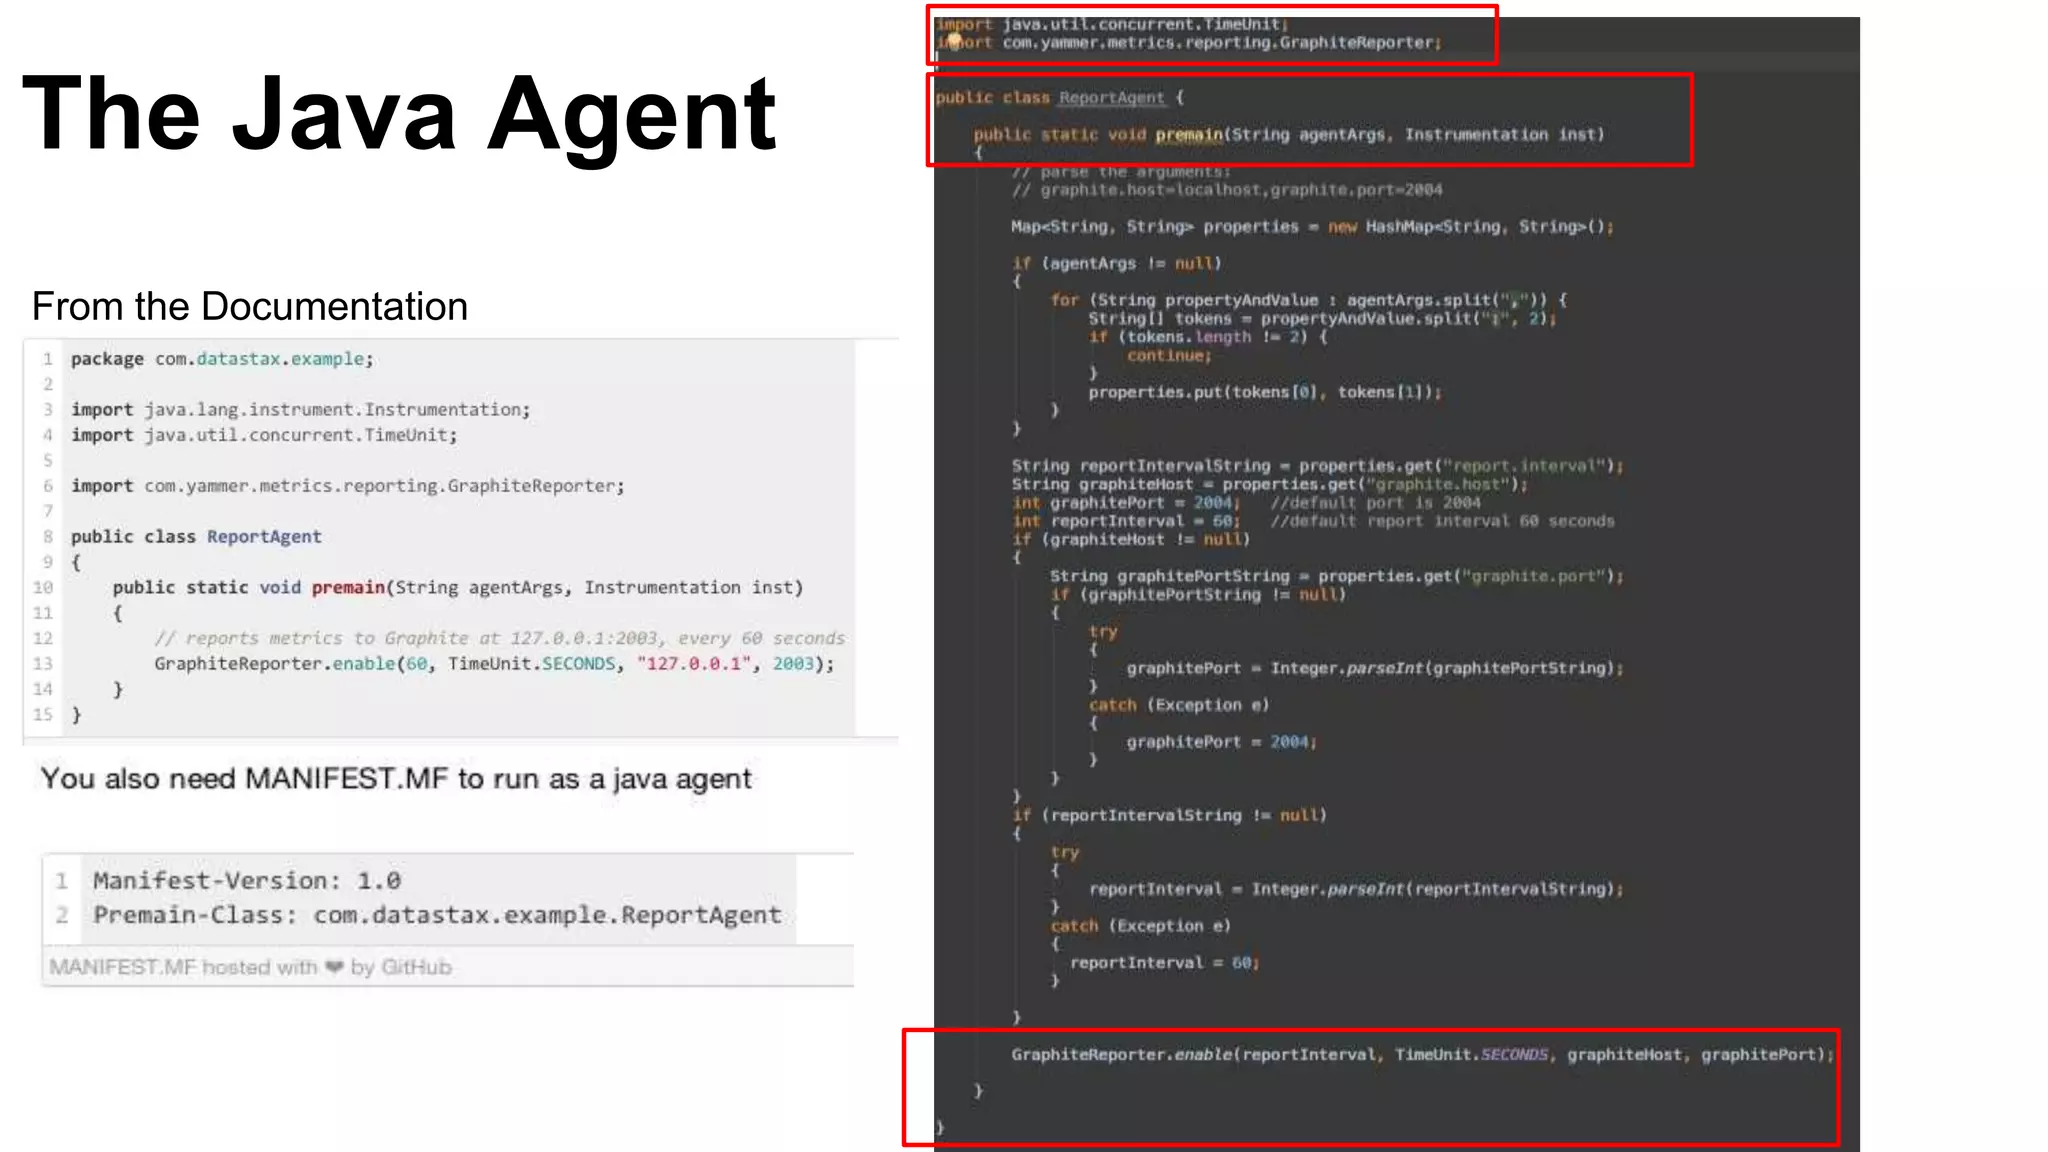
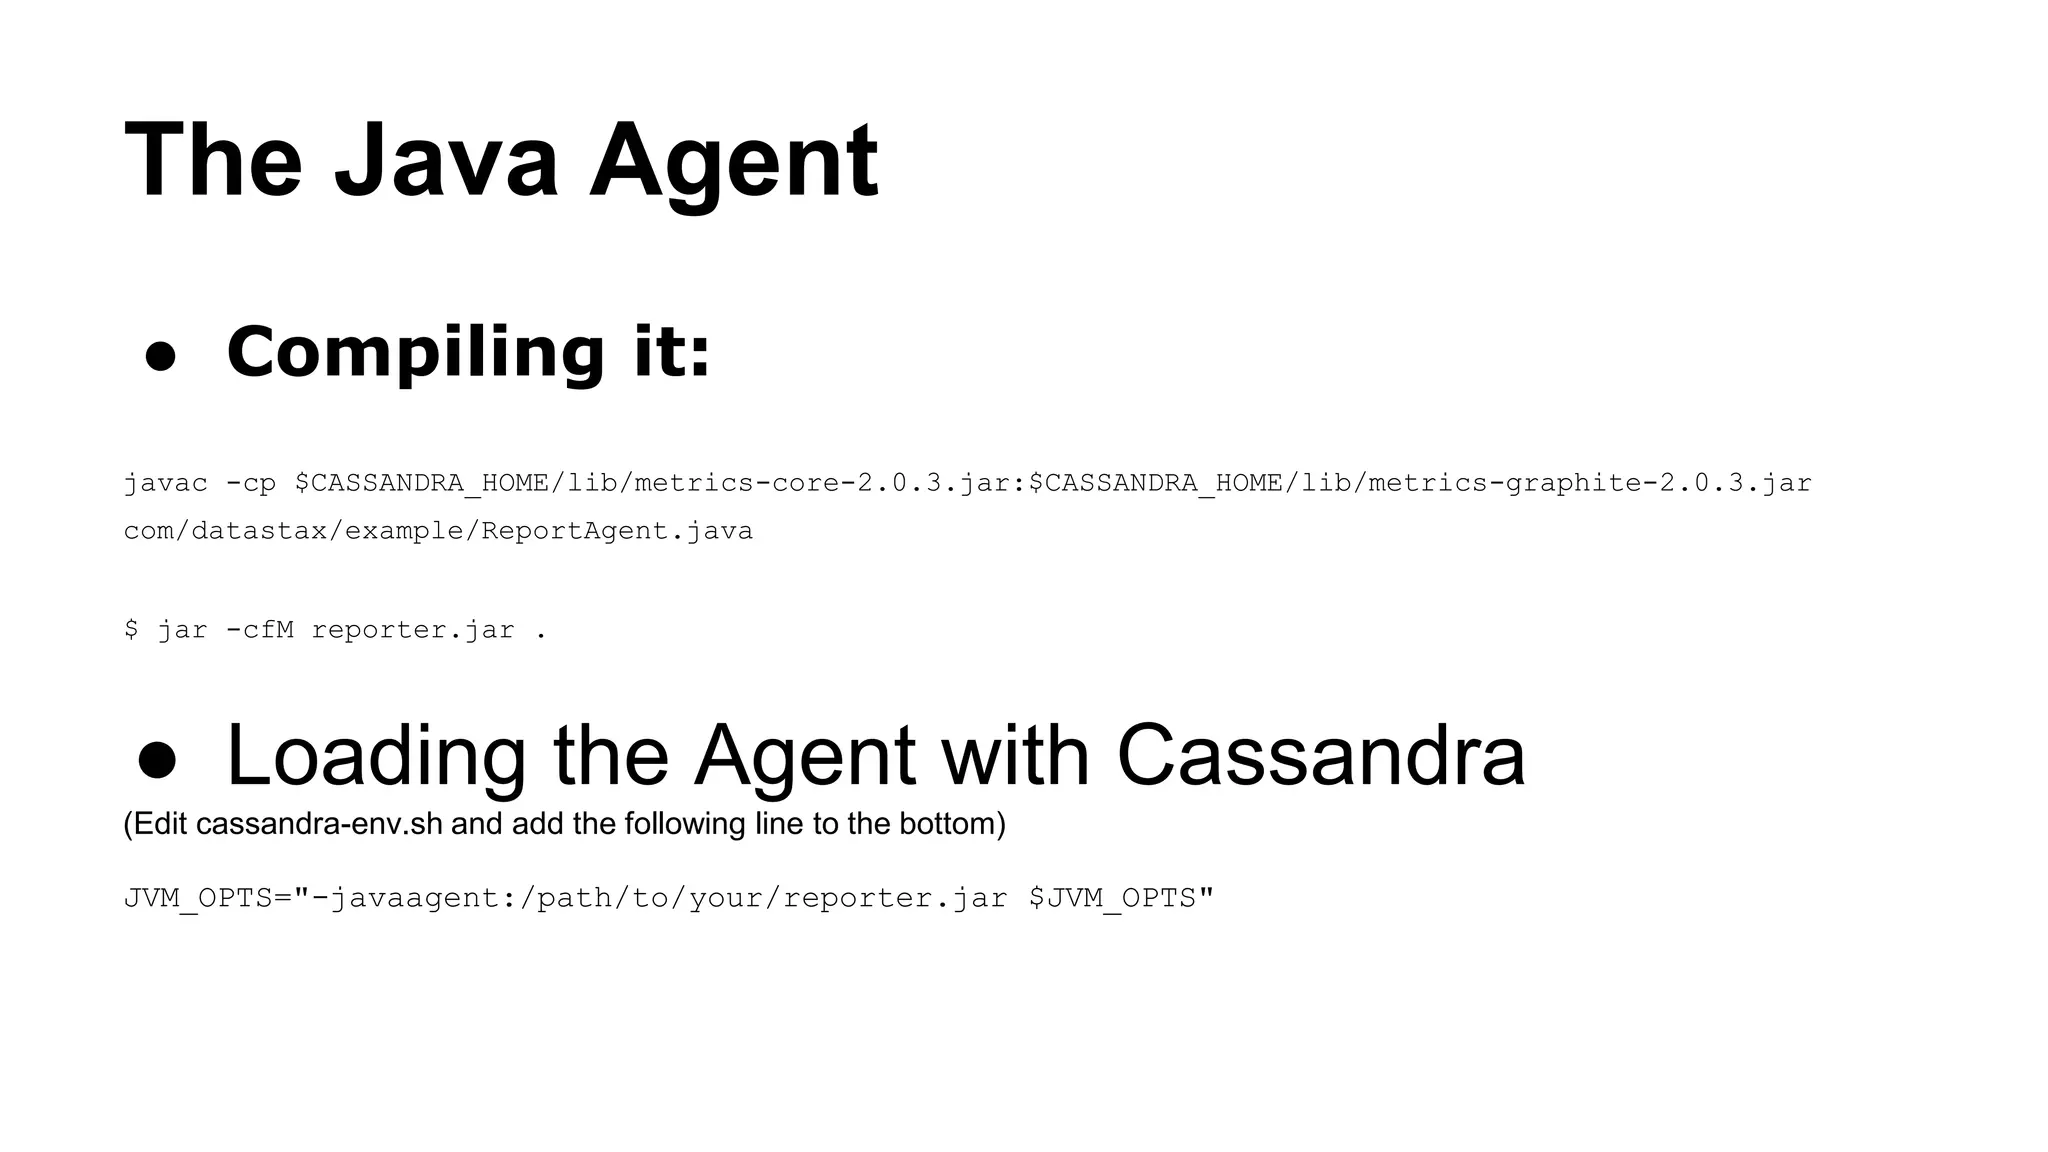


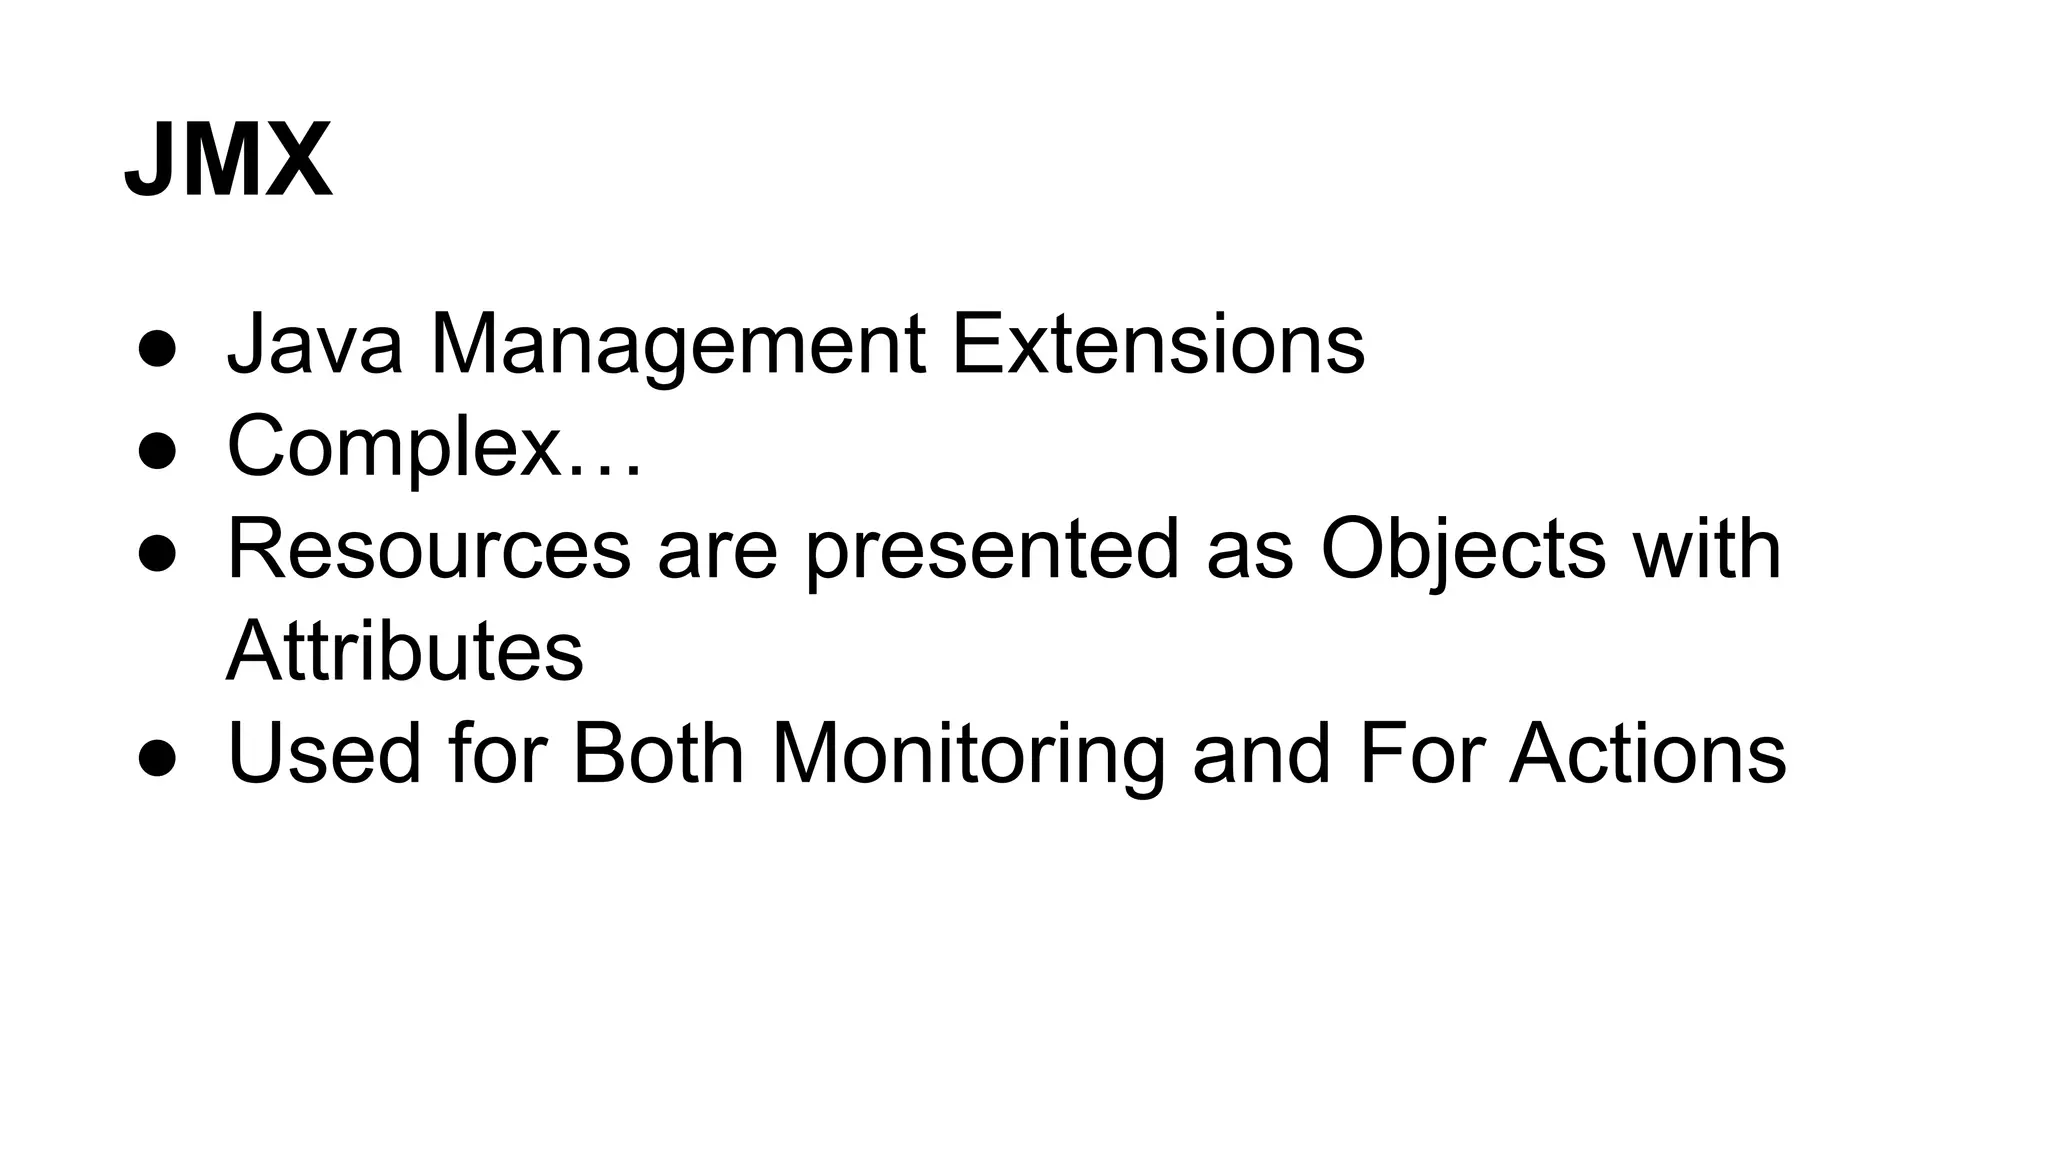
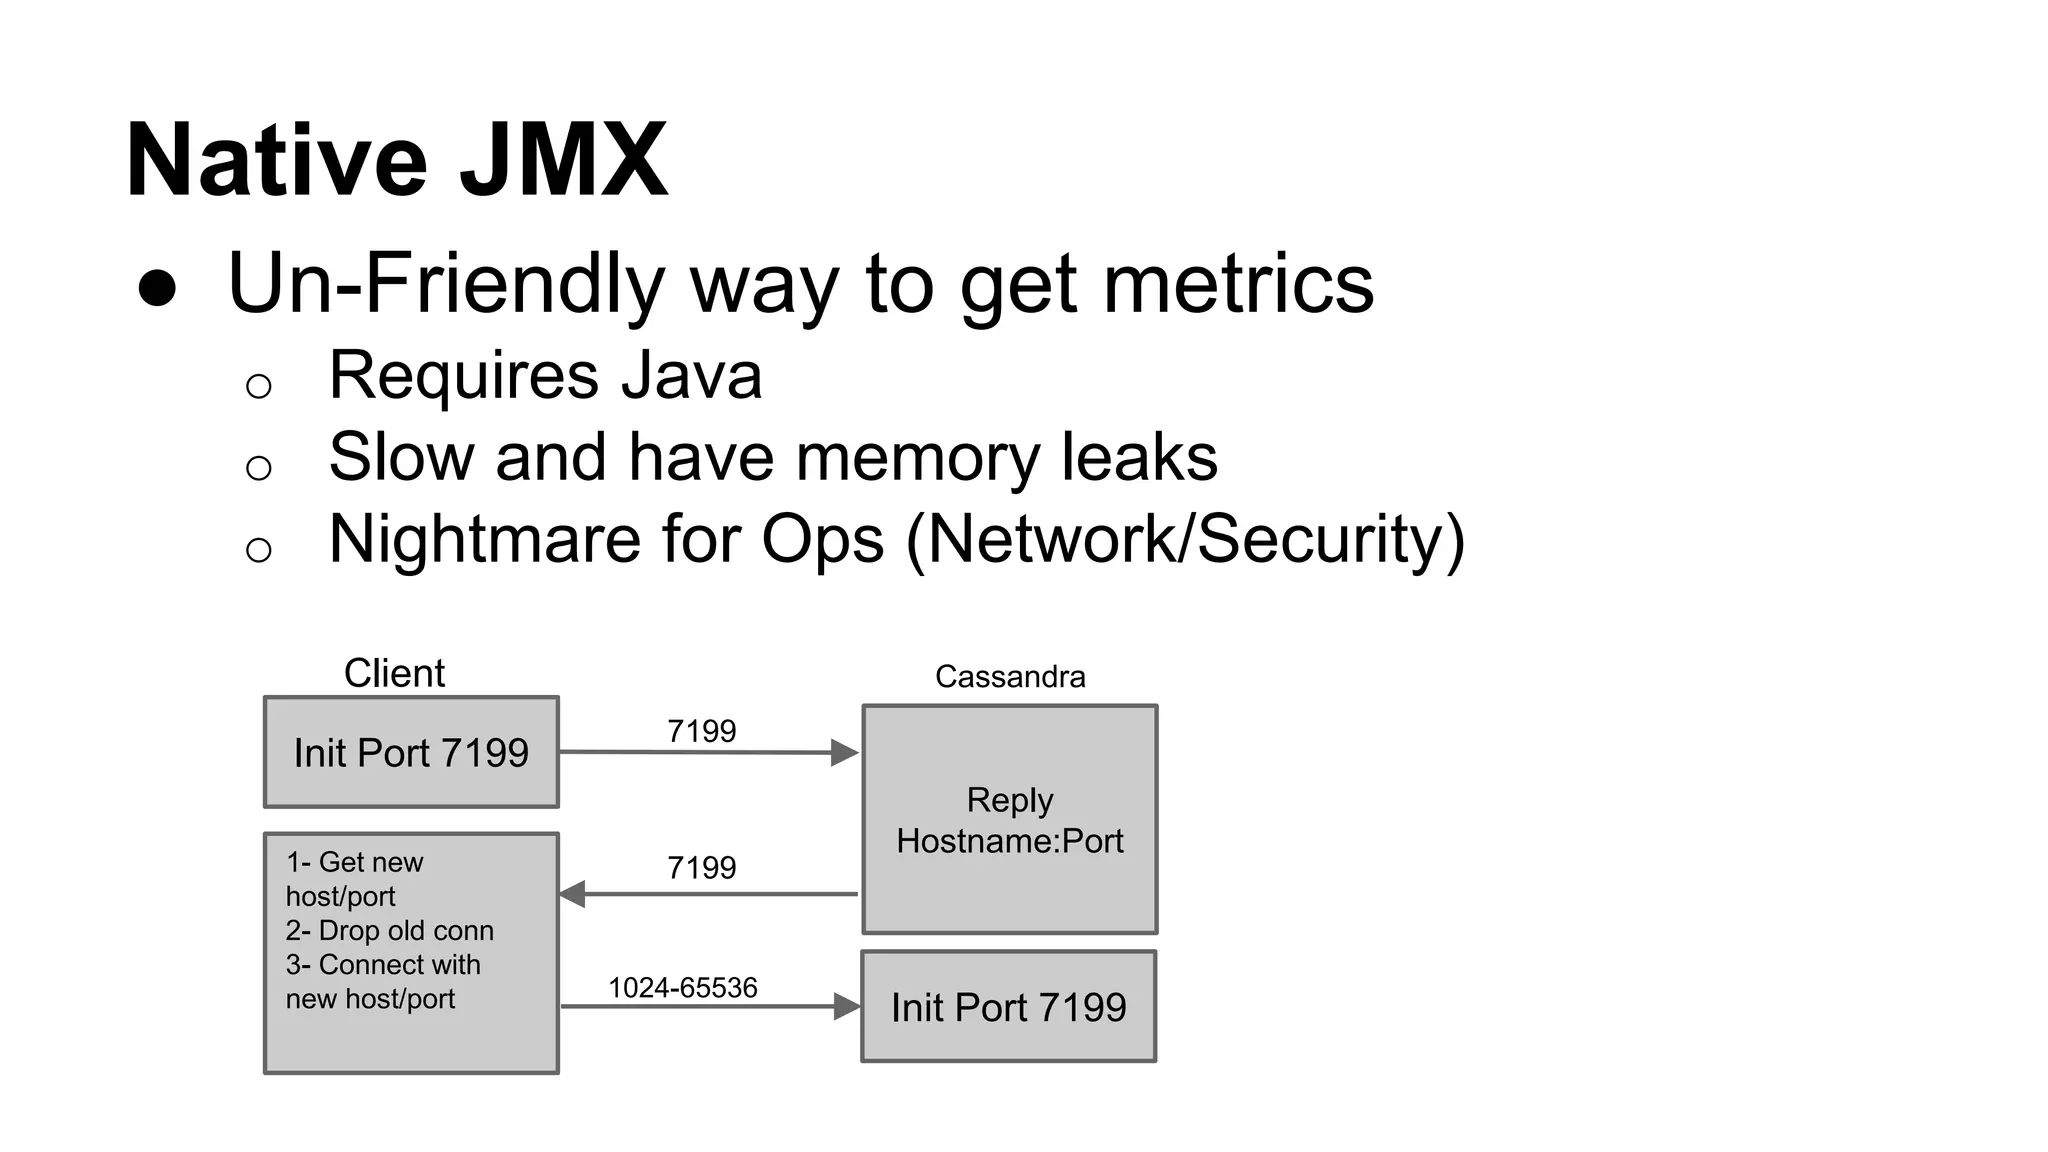
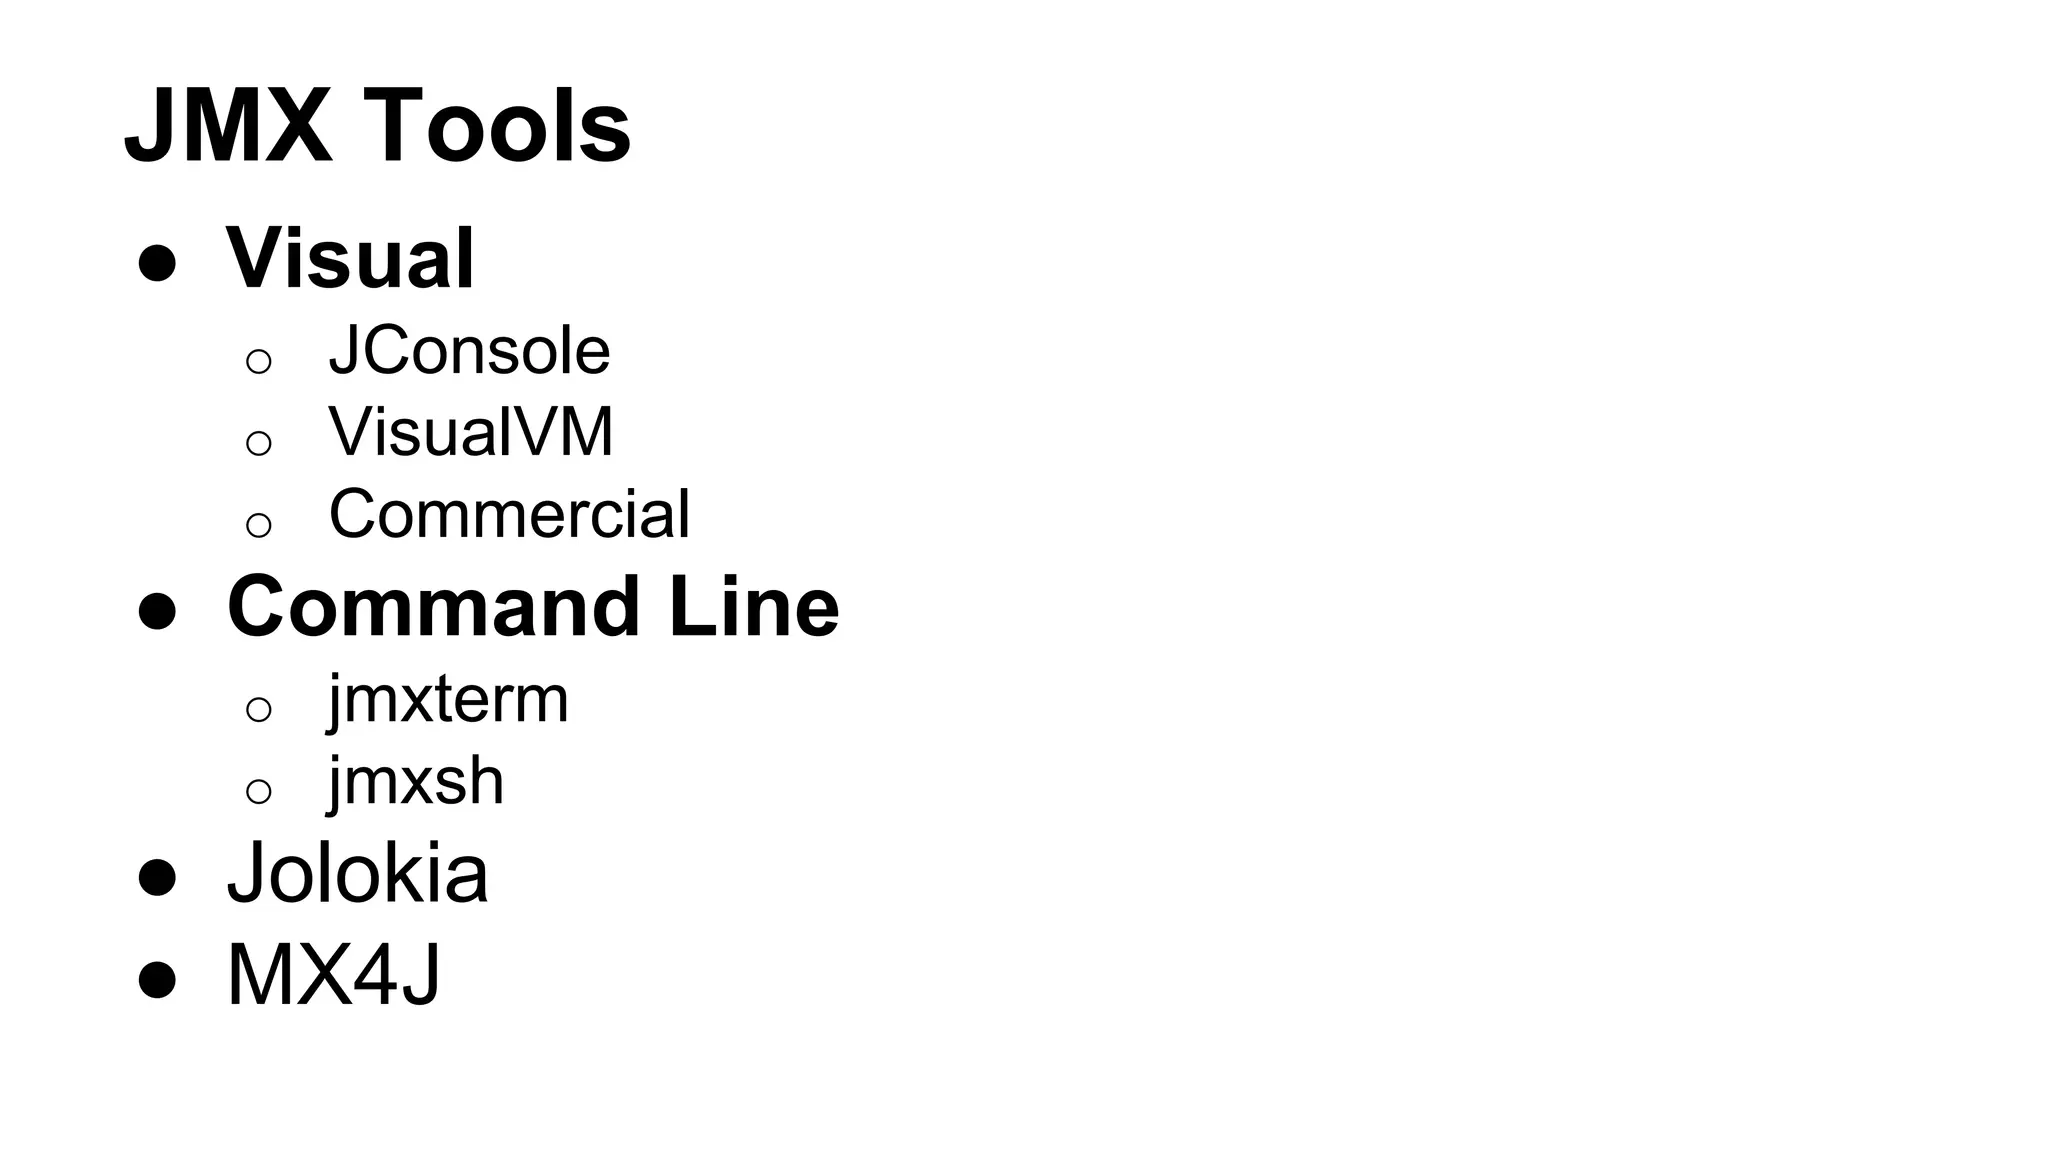
This document discusses monitoring Cassandra metrics and sending them to Graphite for visualization. It covers: - Using JMX to access Cassandra metrics and the complexity of JMX - Tools like JConsole and Jolokia that can help access JMX metrics - The Coda-Hale metrics library that Cassandra uses to instrument metrics and make them easier to access - Configuring a Java agent to extract Cassandra metrics via JMX and report them to Graphite for storage and graphing