A simplified example of searching systematically
•
1 like•858 views

This document provides an example of how to systematically track searches conducted for research. It shows a spreadsheet containing 4 search queries for information on measuring carbon footprints. Each query recorded the search terms, fields searched, databases, and results. In total over 6,000 results were found, with 65 books and 126 journal articles identified as relevant. 23 sources were saved to the citation manager RefWorks. The spreadsheet allows the researcher to document their search process to include in their methodology section.

Recommended
More Related Content
What's hot
What's hot (13)
Similar to A simplified example of searching systematically
Similar to A simplified example of searching systematically (20)
More from Linda_Kelly
More from Linda_Kelly (13)
Recently uploaded
Recently uploaded (20)
A simplified example of searching systematically
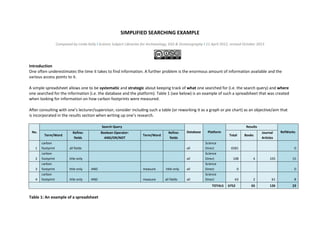
- 1. SIMPLIFIED SEARCHING EXAMPLE Composed by Linda Kelly l Science Subject Librarian for Archaeology, EGS & Oceanography l 11 April 2012, revised October 2013 Introduction One often underestimates the time it takes to find information. A further problem is the enormous amount of information available and the various access points to it. A simple spreadsheet allows one to be systematic and strategic about keeping track of what one searched for (i.e. the search query) and where one searched for the information (i.e. the database and the platform). Table 1 (see below) is an example of such a spreadsheet that was created when looking for information on how carbon footprints were measured. After consulting with one’s lecturer/supervisor, consider including such a table (or reworking it as a graph or pie chart) as an objective/aim that is incorporated in the results section when writing up one’s research. Search Query No. 1 2 3 4 Term/Word carbon footprint carbon footprint carbon footprint carbon footprint Refine: fields Boolean Operator: AND/OR/NOT Results Term/Word Refine: fields Database all fields all title only all title only AND measure title only all title only AND measure all fields all Platform Science Direct Science Direct Science Direct Science Direct TOTALS Table 1: An example of a spreadsheet Total Books Journal Articles 6581 108 0 4 105 0 63 6752 RefWorks 15 0 2 61 8 65 126 23
- 2. Explanation of table • Search Query No. 1: Look at the first search query indicated by no. 1. The term “carbon footprint” was used and the all fields option (i.e. it was not limited to the title or abstract) was selected. All the databases available by the platform Science Direct were searched and the total results were 6581. This was too many results to look through so search query no. 2 was created. • Search Query No. 2: The term “carbon footprint” was used and the title only option was selected. The same database and platform were used. A total of 108 results were found of which four were books and 105 were journal articles. From these results, 15 items were directly exported to RefWorks. • Search Query No. 3: The student wanted to see if there was specific information about measuring carbon footprints. She created the search query “(carbon footprints) AND measure”. She put brackets around “carbon footprints” so it would be searched as a term and not as two individual words. She used the word “measure” as it is the root word for measurement. The Boolean Operator “AND” was used as she wanted to find both words together. She decided to select the title only option for both words/terms. Her results were 0 which meant that there were no titles that had both terms in it. She had to expand her search and created search query no. 4. • Search Query No. 4: The student kept the search query the same, i.e. “(carbon footprints) AND measure”. The same database and platform were used. The only change was to select the all fields option for the term “measure”. There were 63 results of which two were books and 61 were journal articles. After looking through these results, eight items were directly exported to RefWorks. Conclusion In total only four search queries were created. A total of 6 752 items were located of which 65 were books and 126 were journal articles. From these items, 23 were directly exported into RefWorks and will be used for her literature review. The student knows what she searched for and where she located her information. She also knows which search queries gave her the most relevant results and how many items she exported directly to her RefWorks account. She also has a table that she could insert in her Methodology Chapter (speak to your lecturer/supervisor before including it). Alternatively, she could rework the table into a graph or pie chart.