Download as PDF, PPTX


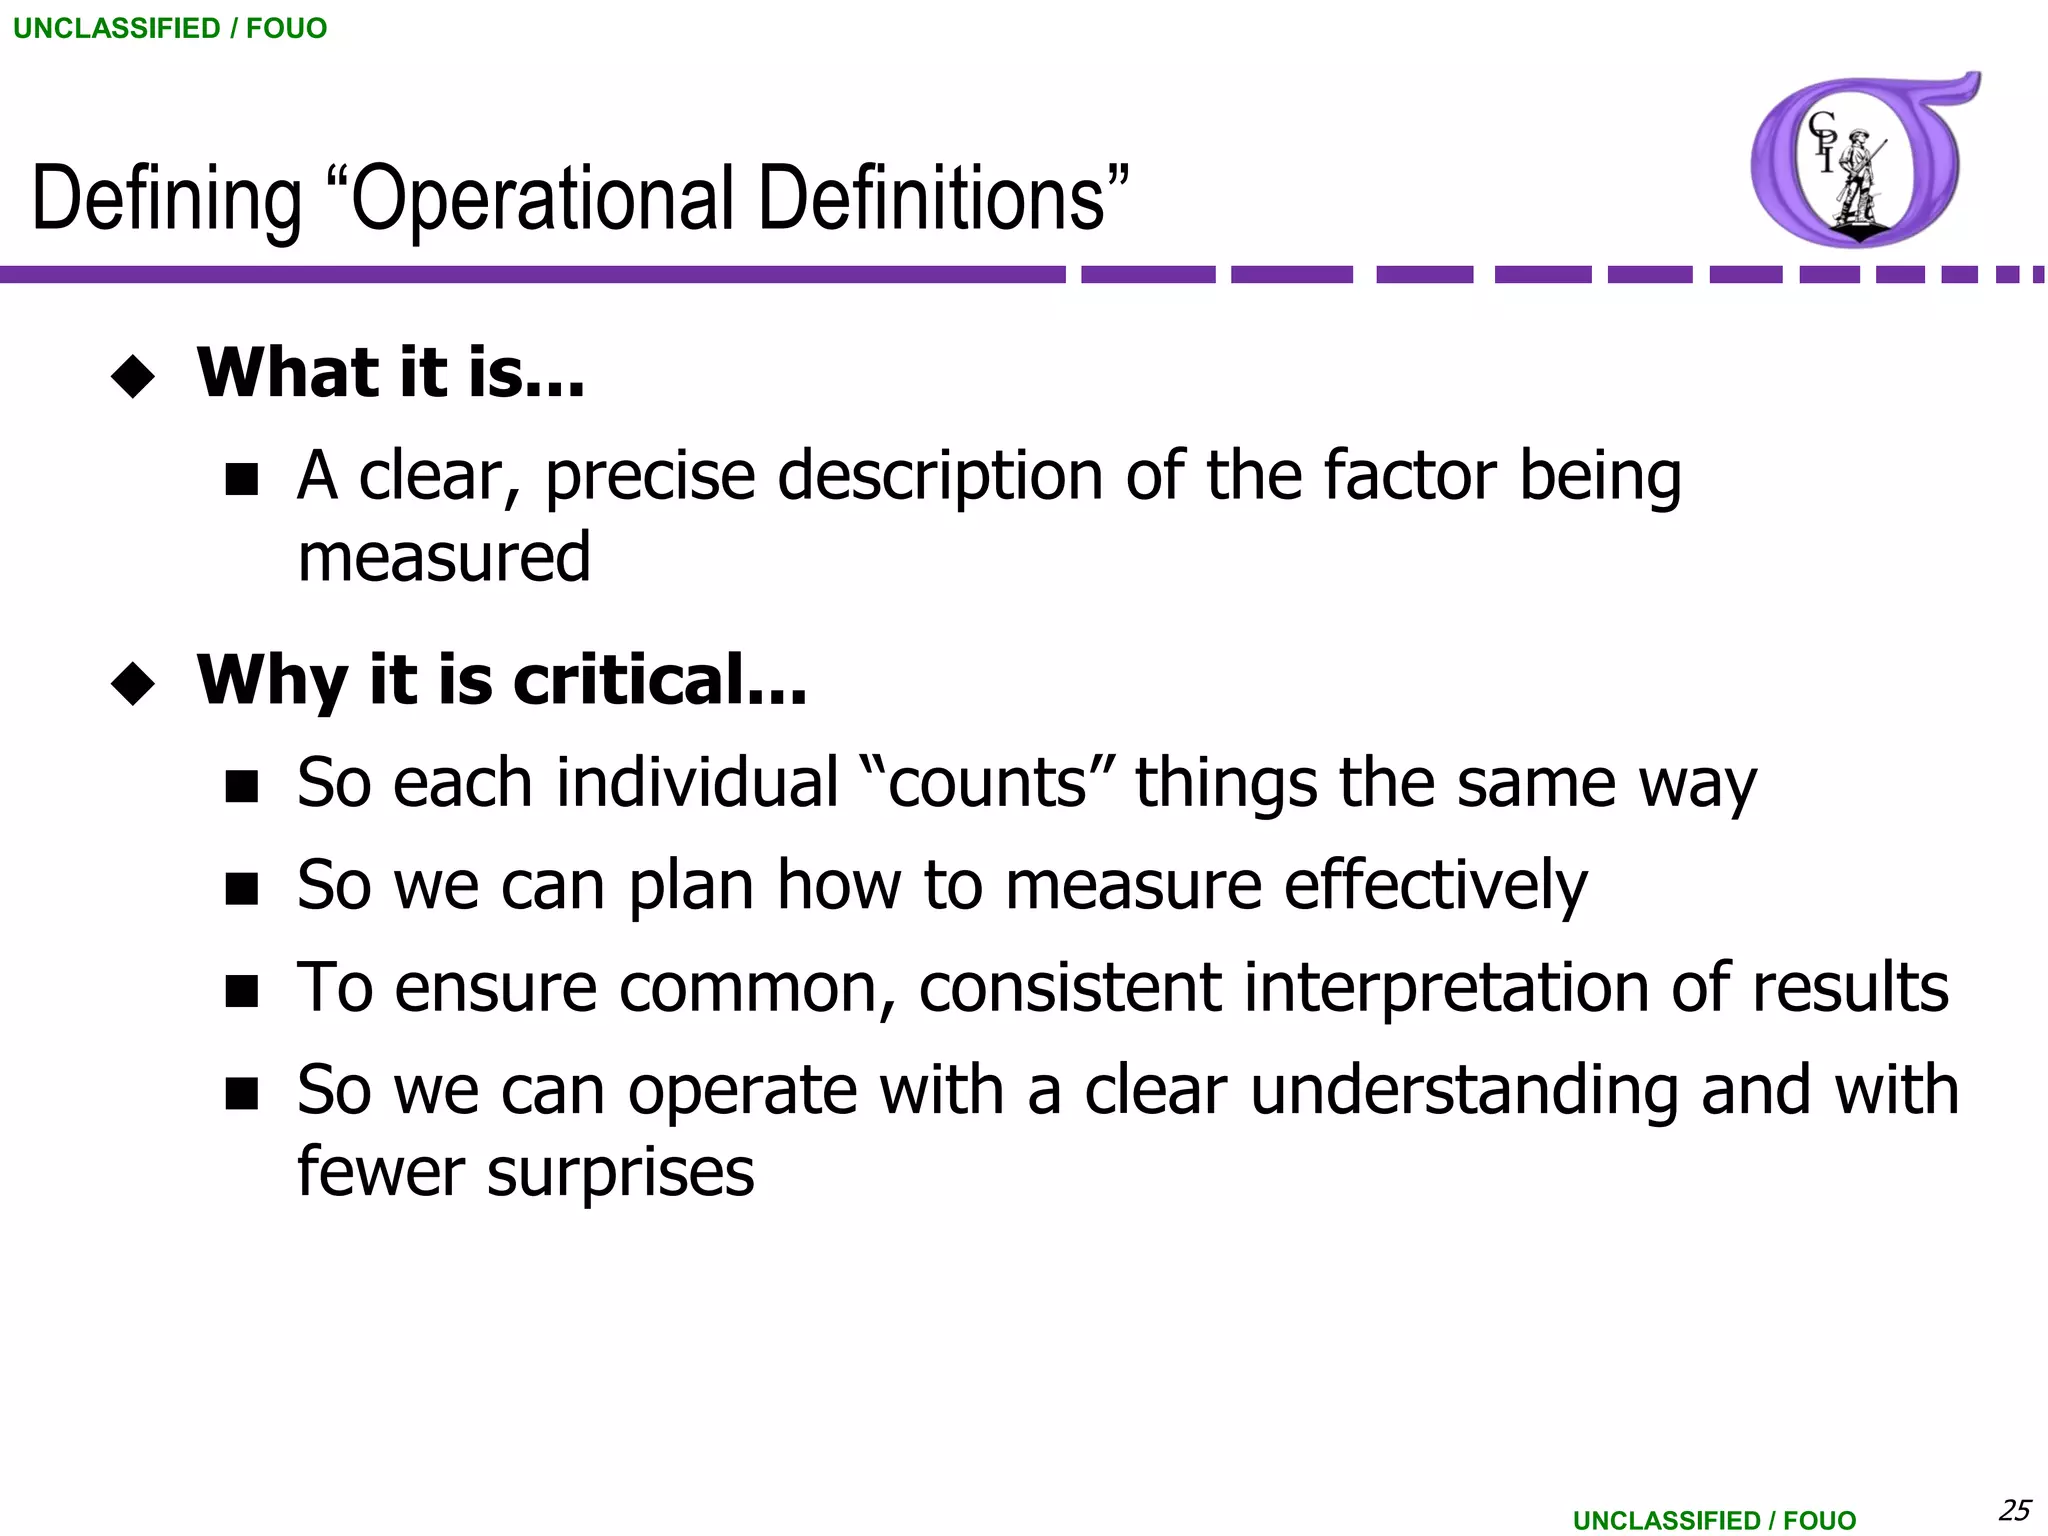


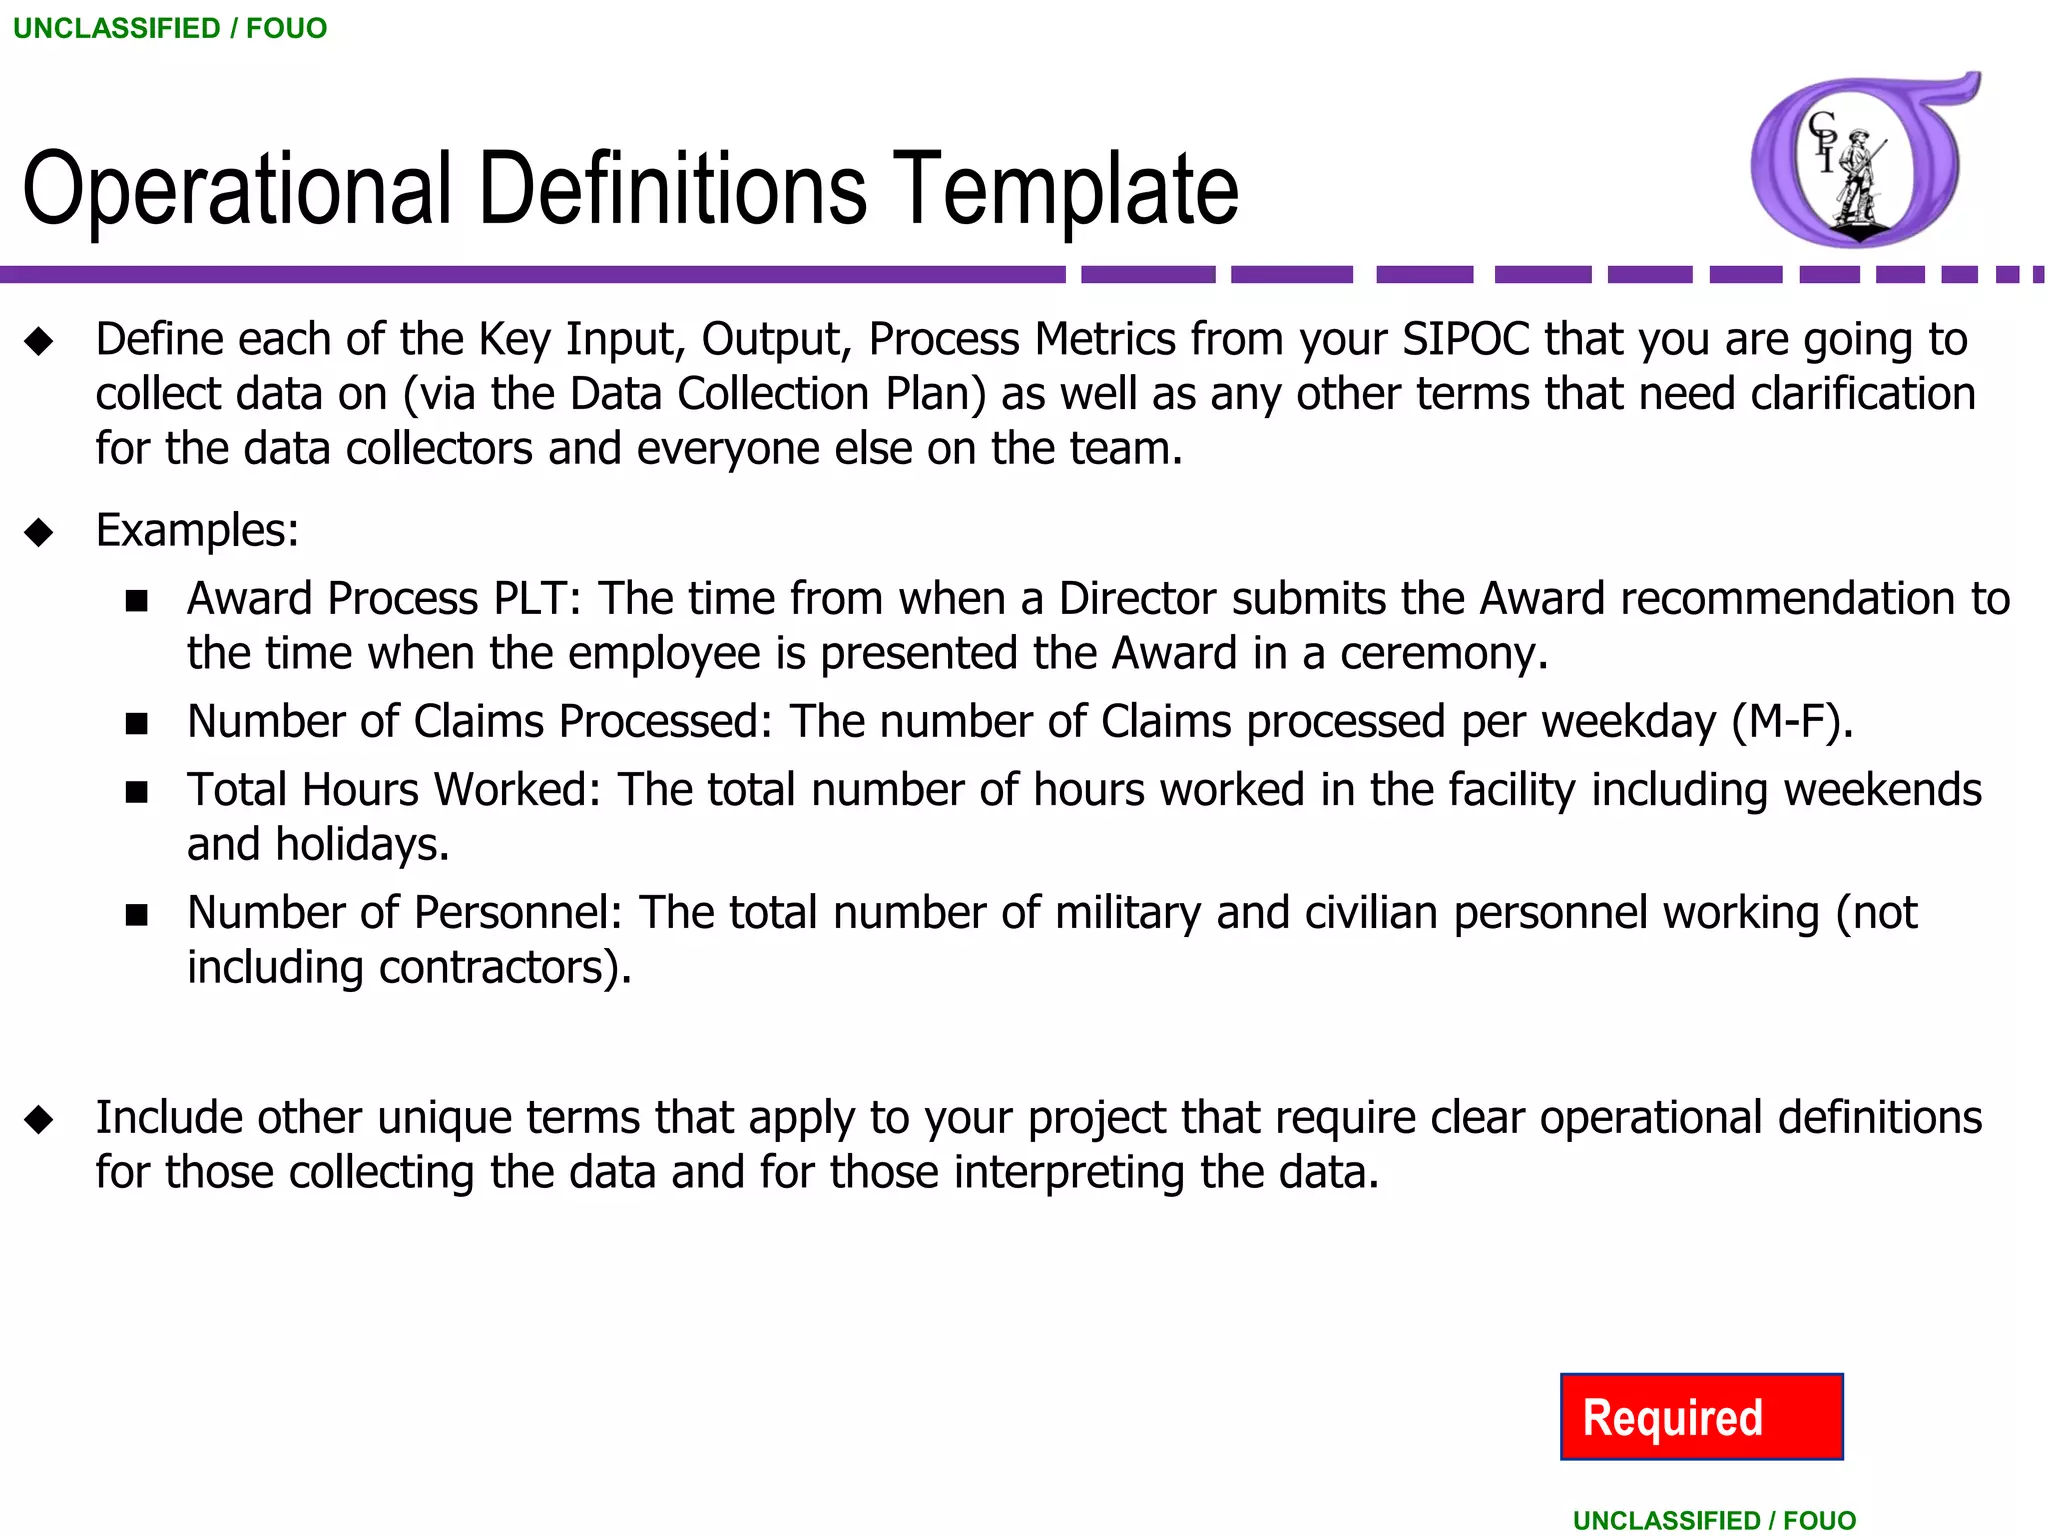


Here are the key steps in developing operational definitions: 1. Identify the factor or variable you want to measure 2. Write a draft definition in your own words 3. Review the definition with others to refine language and ensure common understanding 4. Finalize the definition and document it clearly for those collecting data 5. Periodically review definitions and refine as needed over time Clear, precise operational definitions are essential to ensure consistent and accurate measurement. Taking the time up front to develop them pays off in the quality of the data collected and insights generated.


![NG BB 53 Process Control [Compatibility Mode]](https://cdn.slidesharecdn.com/ss_thumbnails/6906860-thumbnail.jpg?width=640&height=640&fit=bounds)


