ADAPT Water, Climate, Food and Environment under Climate Change
•
2 likes•521 views

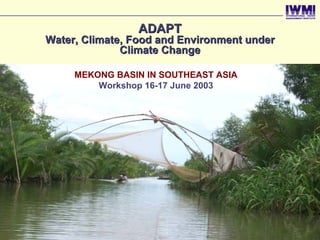
ADAPT Water, Climate, Food and Environment under Climate Change MEKONG BASIN IN SOUTHEAST ASIAWorkshop 16-17 June 2003

Recommended
Recommended
More Related Content
More from International Water Management Institute (IWMI)
More from International Water Management Institute (IWMI) (20)
Recently uploaded
Recently uploaded (20)
ADAPT Water, Climate, Food and Environment under Climate Change
- 1. ADAPT Water, Climate, Food and Environment under Climate Change MEKONG BASIN IN SOUTHEAST ASIA Workshop 16-17 June 2003 Jun-03
- 2. Contents 1. Main projected changes in climate in 2100 2. Effects of these changes on hydrology, environment, food and industry 3. Brief description of adaptation strategies 4. Evaluation of strategies 5. SWOT (strengths, weaknesses, opportunities, threats) Jun-03
- 3. Mekong River Sub-basins Area Sub-basin Raster 0.5 degree (km2) Mun 60,912 Chi 55,985 Chi-Mun 4,175 Lancang 225,562 Nam Ou 30,708 Nam Ngum 8,886 Mekong 1 156,509 Mekong 2 20,558 Sekong 28,601 Srepok 48,318 Mekong 3 27,701 Tonlesap 86,594 China Delta 40,492 Total 795,000 Myanmar Vietnam Lao PDR ThailandMEKONG BASIN Cambodia Climate station with long records Jun-03
- 4. 1. Main projected changes in climate in 2100 Jun-03
- 5. Precipitation Precipitation (mm/month) 600 500 400 A2 300 200 100 0 1961 1971 1981 1991 2001 2011 2021 2031 2041 2051 2061 2071 2081 2091 Year Precipitation (mm/month) 600 500 400 B2 300 200 100 0 1961 1971 1981 1991 2001 2011 2021 2031 2041 2051 2061 2071 2081 2091 Year Jun-03
- 6. Mean temperature Mean temperature (oC) 35 30 25 A2 20 15 1961 1971 1981 1991 2001 2011 2021 2031 2041 2051 2061 2071 2081 2091 Year Mean temperature (oC) 35 30 B2 25 20 15 1961 1971 1981 1991 2001 2011 2021 2031 2041 2051 2061 2071 2081 2091 Year Jun-03
- 7. Max temperature Maximum temperature (oC) 45 40 A2 35 30 25 20 1961 1971 1981 1991 2001 2011 2021 2031 2041 2051 2061 2071 2081 2091 Year Maximum temperature (oC) 45 40 B2 35 30 25 20 1961 1971 1981 1991 2001 2011 2021 2031 2041 2051 2061 2071 2081 2091 Year Jun-03
- 8. Minimum Min temperature temperature (oC) 30 25 20 A2 15 10 5 1961 1971 1981 1991 2001 2011 2021 2031 2041 2051 2061 2071 2081 2091 Year Minimum temperature (oC) 30 25 B2 20 15 10 5 1961 1971 1981 1991 2001 2011 2021 2031 2041 2051 2061 2071 2081 2091 Year Jun-03
- 9. Radiation Solar radiation (w/m2) 300 250 A2 200 150 100 1961 1971 1981 1991 2001 2011 2021 2031 2041 2051 2061 2071 2081 2091 Year Solar radiation (w/m2) 300 250 B2 200 150 100 1961 1971 1981 1991 2001 2011 2021 2031 2041 2051 2061 2071 2081 2091 Year Jun-03
- 10. Relative humidity Relative humidity 95 (%) 90 85 80 75 A2 70 65 60 55 50 45 1961 1971 1981 1991 2001 2011 2021 2031 2041 2051 2061 2071 2081 2091 Year Relative humidity (%) 95 85 75 B2 65 55 45 1961 1971 1981 1991 2001 2011 2021 2031 2041 2051 2061 2071 2081 2091 Year Jun-03
- 11. Wind speed (m/s) Wind speed 4.0 3.5 3.0 A2 2.5 2.0 1.5 1961 1971 1981 1991 2001 2011 2021 2031 2041 2051 2061 2071 2081 2091 Year Wind speed (m/s) 4.0 3.5 B2 3.0 2.5 2.0 1.5 1961 1971 1981 1991 2001 2011 2021 2031 2041 2051 2061 2071 2081 2091 Year Jun-03
- 12. 2. Effects of CC on hydrology, environment, food and industry Jun-03
- 13. Mekong River Sub-basins Area Sub-basin Raster 0.5 degree (km2) Mun 60,912 Chi 55,985 Chi-Mun 4,175 Lancang 225,562 Nam Ou 30,708 Nam Ngum 8,886 Mekong 1 156,509 Mekong 2 20,558 Sekong 28,601 Srepok 48,318 Mekong 3 27,701 Tonlesap 86,594 China Delta 40,492 Total 795,000 Myanmar Vietnam Lao PDR ThailandMEKONG BASIN Cambodia Climate station with long records Jun-03
- 14. Hydrology (only CC) Monthly Q - A2 - Mekong 3 Q (m3/s) Monthly Q - A2 - Delta Q (m3/s) 70,000 70,000 60,000 60,000 50,000 50,000 40,000 40,000 30,000 30,000 20,000 20,000 10,000 10,000 0 0 1961 1971 1981 1991 2001 2011 2021 2031 2041 2051 2061 2071 2081 2091 1961 1971 1981 1991 2001 2011 2021 2031 2041 2051 2061 2071 2081 2091 Month Month Q (m3/s) Monthly Q - B2 - Mekong 3 Q (m3/s) Monthly Q - B2 - Delta 70,000 70,000 60,000 60,000 50,000 50,000 40,000 40,000 30,000 30,000 20,000 20,000 10,000 10,000 0 0 1961 1971 1981 1991 2001 2011 2021 2031 2041 2051 2061 2071 2081 2091 1961 1971 1981 1991 2001 2011 2021 2031 2041 2051 2061 2071 2081 2091 Month Month Jun-03
- 15. Food demand: increased with population Population Food demand Sub-basin Growth rate Population (106) Food demand (mil t) 2000 (106) 2000 (mil t) 2000-25 2025-75 2025 2075 2025 2075 Scenario A2 China 9.6 2.9 1.2 0.9 12.9 20.2 3.9 6.1 Myanmar 0.9 0.3 1.1 0.8 1.2 1.8 0.4 0.5 Laos 4.9 1.5 2 1.5 8.0 16.9 2.4 5.1 Thailand 23.1 6.9 1.2 0.9 31.1 48.7 9.3 14.6 Cambodia 9.8 2.9 1.6 1.6 14.6 32.2 4.4 9.7 Vietnam 16.9 5.1 1.6 1.2 25.1 45.6 7.5 13.7 Total 65.2 19.6 93.0 165.5 27.9 49.7 Ratio to 2000 1.4 2.5 1.4 2.5 Scenario B2 China 9.6 2.9 0.9 0.6 12.0 16.2 3.6 4.9 Myanmar 0.9 0.3 0.8 0.5 1.1 1.4 0.3 0.4 Laos 4.9 1.5 1.5 1 7.1 11.7 2.1 3.5 Thailand 23.1 6.9 0.9 0.6 28.9 39.0 8.7 11.7 Cambodia 9.8 2.9 1.6 1.1 14.6 25.2 4.4 7.6 Vietnam 16.9 5.1 1.2 0.8 22.8 33.9 6.8 10.2 Total 65.2 19.6 86.5 127.4 25.9 38.2 Jun-03 to 2000 Ratio 1.3 2.0 1.3 2.0
- 16. Food: increase production Rice yield (t/ha) from SWAP (Peter Droogers) 2010-39 2070-99 Yield Ratio to Ratio to Scenario / Period 1961-90 Yield 61-90 Yield 61-90 Baseline A2 4.9 5.6 1.1 6.8 1.4 No irrigation A2 4.9 5.6 1.1 6.4 1.3 Short season 4.8 5.8 1.2 6.5 1.4 Baseline B2 5.0 4.9 1.0 5.4 1.1 No irrigation B2 5.0 4.9 1.0 5.1 1.0 Short season B2 5.0 5.0 1.0 5.4 1.1 Jun-03
- 17. Environment: higher flood, deeper salinity intrusion Monthly discharge (m3/s) % change Daily discharge (m3/s) % change Sub-basin Mekong 3 Delta Mekng 3 Delta Mekong 3 Delta Mekng 3 Delta Max 61_90 40,995 45,681 54,829 51,161 Min 61_90 560 1,857 Ave 61_90 12,894 15,459 Scenario A2 Max 10_39 46,635 45,091 14 -1 57,387 50,294 5 -2 Min 10_39 574 1,726 2 -7 Ave 10_39 12,940 15,399 0 0 Max 70_99 57,659 54,269 41 19 74,055 66,439 35 30 Min 70_99 424 1,370 -24 -26 Ave 70_99 15,147 17,698 17 14 Scenario B2 Max 10_39 45,163 45,271 10 -1 54,016 50,188 -1 -2 Min 10_39 592 1,588 6 -15 Ave 10_39 12,973 15,397 1 0 Max 70_99 55,168 53,181 35 16 62,118 58,696 13 15 Min 70_99 466 1,311 -17 -29 Ave 70_99 13,672 16,140 6 4 Jun-03
- 18. Hydropower: higher potential Monthly discharge (m3/s) % change Daily discharge (m3/s) % change Sub-basin Mekong 3 Delta Mekng 3 Delta Mekong 3 Delta Mekng 3 Delta Ave 61_90 12,894 15,459 Scenario A2 Ave 10_39 12,940 15,399 0 0 Ave 70_99 15,147 17,698 17 14 Scenario B2 Ave 10_39 12,973 15,397 1 0 Ave 70_99 13,672 16,140 6 4 Jun-03
- 19. 3. A brief description of adaptation strategies Jun-03
- 20. Scenarios No. Scenario Objective Agriculture Reforestation development 1 Baseline Current trend Developed for Current without CC food 2 CC-NoAgri Effects of CC Current Current 3 CC-Agri Effects of CC & Developed for Current agriculture food 4 CC-AgriFor Effects of CC, Developed for Reforestation of agriculture & food all shrub land forestry (17.7%) by mixed forest Jun-03
- 21. Scenario Baseline No CC – with Agri. development Monthly discharge Daily discharge (m3/s) % change (m3/s) % change Sub-basin Mekong 3 Delta Mekng 3 Delta Mekong 3 Delta Mekng 3 Delta Max 61_90 40,995 45,681 54,829 51,161 Min 61_90 560 1,857 Ave 61_90 12,894 15,459 Max 10_39 41,214 46,047 1 1 55,111 51,559 1 1 Min 10_39 560 1,817 0 -2 Ave 10_39 12,787 15,257 -1 -1 Max 70_99 41,031 45,861 0 0 54,932 51,359 0 0 Min 70_99 560 1,811 0 -2 Ave 70_99 12,725 15,167 -1 -2 Jun-03
- 22. Scenario CC-NoAgri: higher flood, deeper salinity intrusion Monthly discharge (m3/s) % change Daily discharge (m3/s) % change Sub-basin Mekong 3 Delta Mekng 3 Delta Mekong 3 Delta Mekng 3 Delta Max 61_90 40,995 45,681 54,829 51,161 Min 61_90 560 1,857 Ave 61_90 12,894 15,459 Scenario A2 Max 10_39 46,635 45,091 14 -1 57,387 50,294 5 -2 Min 10_39 574 1,726 2 -7 Ave 10_39 12,940 15,399 0 0 Max 70_99 57,659 54,269 41 19 74,055 66,439 35 30 Min 70_99 424 1,370 -24 -26 Ave 70_99 15,147 17,698 17 14 Scenario B2 Max 10_39 45,163 45,271 10 -1 54,016 50,188 -1 -2 Min 10_39 592 1,588 6 -15 Ave 10_39 12,973 15,397 1 0 Max 70_99 55,168 53,181 35 16 62,118 58,696 13 15 Min 70_99 466 1,311 -17 -29 Ave 70_99 13,672 16,140 6 4 Jun-03
- 23. Scenario CC-Agri: higher flood, deeper salinity intrusion Monthly discharge (m3/s) % change Daily discharge (m3/s) % change Sub-basin Mekong 3 Delta Mekng 3 Delta Mekong 3 Delta Mekng 3 Delta Max 61_90 40,995 45,681 54,829 51,161 Min 61_90 560 1,857 Ave 61_90 12,894 15,459 Scenario A2 Max 10_39 46,646 45,446 14 -1 57,629 50,533 5 -1 Min 10_39 574 1,726 2 -7 Ave 10_39 12,843 15,230 0 -1 Max 70_99 57,723 54,497 41 19 74,178 66,648 35 30 Min 70_99 424 1,370 -24 -26 Ave 70_99 14,967 17,439 16 13 Scenario B2 Max 10_39 45,504 45,264 11 -1 53,979 50,165 -2 -2 Min 10_39 592 1,484 6 -20 Ave 10_39 12,884 15,245 0 -1 Max 70_99 55,106 53,138 34 16 62,070 58,655 13 15 Min 70_99 466 1,305 -17 -30 Ave 70_99 13,512 15,902 5 3 Jun-03
- 24. Scenario CC-AgriFor: less severe flood Monthly discharge (m3/s) % change Daily discharge (m3/s) % change Mekong Mekong Sub-basin Mekong 3 Delta 3 Delta Mekong 3 Delta 3 Delta Max 61_90 40,995 45,681 54,829 51,161 Min 61_90 560 1,857 Ave 61_90 12,894 15,459 Scenario A2 Max 10_39 42,376 43,190 3 -5 57,410 49,928 5 -2 Min 10_39 508 1,634 -9 -12 Ave 10_39 11,905 14,119 -8 -9 Max 70_99 53,370 52,770 30 16 71,874 64,245 31 26 Min 70_99 412 1,356 -26 -27 Ave 70_99 13,809 16,103 7 4 Scenario B2 Max 10_39 44,536 41,725 9 -9 53,068 48,221 -3 -6 Min 10_39 533 1,423 -5 -23 Ave 10_39 11,942 14,132 -7 -9 Max 70_99 54,967 52,735 34 15 66,124 59,099 21 16 Min 70_99 394 1,149 -30 -38 Jun-03
- 25. 3. Evaluation of strategies Jun-03
- 26. A2 indicator analysis Good A2 no Stable adaptation A2 future adaptation Decrease Environm.t Food Industry Mixed very bad Mea- Cur- Indi Sured rent 2010 2070 2010 2070 2010 2070 2010 2070 2010 2070 cator Indicator in 2000 -39 -99 -39 -99 -39 -99 -39 -99 -39 -99 # affected people by flood number 18.6 27.5 53.6 26.6 52.2 27.5 53.6 26.6 52.2 Fisheries +++/--- ha upstream forest number ha floodplain forest number ha wetlands number Envi ron Lateral freedom number Ment Longitudinal freedom number Fertilizer +++/--- BOD +++/--- NaCl (salinity intrusion) +++/--- -- --- --- --- --- --- --- --- --- PCB +++/--- tons of rice per year number 19.4 22.2 25.4 33.5 66.7 tons of maize per year number 2.1 2.4 2.8 3.4 6.8 tons of river fish Food caught per year number average farm income US$ 1.0 1.2 1.4 1.7 3.4 variation in farm income US$ 0.1 0.2 0.4 0.2 0.4 # dams number Indus hydropower MW try Jun-03 # days unnavigable number
- 27. B2 indicator analysis A2 no Good adaptation A2 future adaptation Stable Decrease Environm.t Food Industry Mixed very bad Mea- Cur- Indi Sured rent 2010 2070 2010 2070 2010 2070 2010 2070 2010 2070 cator Indicator in 2000 -39 -99 -39 -99 -39 -99 -39 -99 -39 -99 # affected people by flood number 18.6 25.9 40.8 24.7 39.1 25.9 40.8 24.7 39.1 Fisheries +++/--- ha upstream forest number ha floodplain forest number ha wetlands number Envi ron Lateral freedom number ment Longitudinal freedom number Fertilizer +++/--- BOD +++/--- NaCl (salinity intrusion) +++/--- -- --- --- --- --- --- --- --- --- PCB +++/--- tons of rice per year number 19.4 19.0 19.8 25.2 38.7 tons of maize per year number 2.1 2.4 2.4 3.2 4.6 tons of river fish Food caught per year number average farm income US$ 1.0 1.0 1.1 1.3 2.1 variation in farm income US$ 0.1 0.1 0.1 0.1 0.1 # dams number Indus hydropower MW try Jun-03 # days unnavigable number
- 28. 5. SWOT (strengths, weaknesses, opportunities, threats) Jun-03
- 29. Scenarios Strengths Weaknesses Opportunities Threats Large & long Improve water basin: resource Unequal seasonal Water is unequal development for distribution: high plentiful distribution in food, flood in rainy (total volume space & time, environment & season & low flow & per capita) data problem industry in dry season Six riparian countries: management Collaboration in Difficult in sharing CC provides & data research & resources due to more water problem development political problem Jun-03
- 30. SLURP: Changes in water resources Higher flood and more drought in A2, 2010-39 Need more analysis in extremes by sub-basin Jun-03
- 31. THANK YOU FOR YOUR ATTENTION Jun-03