Downloaded 232 times


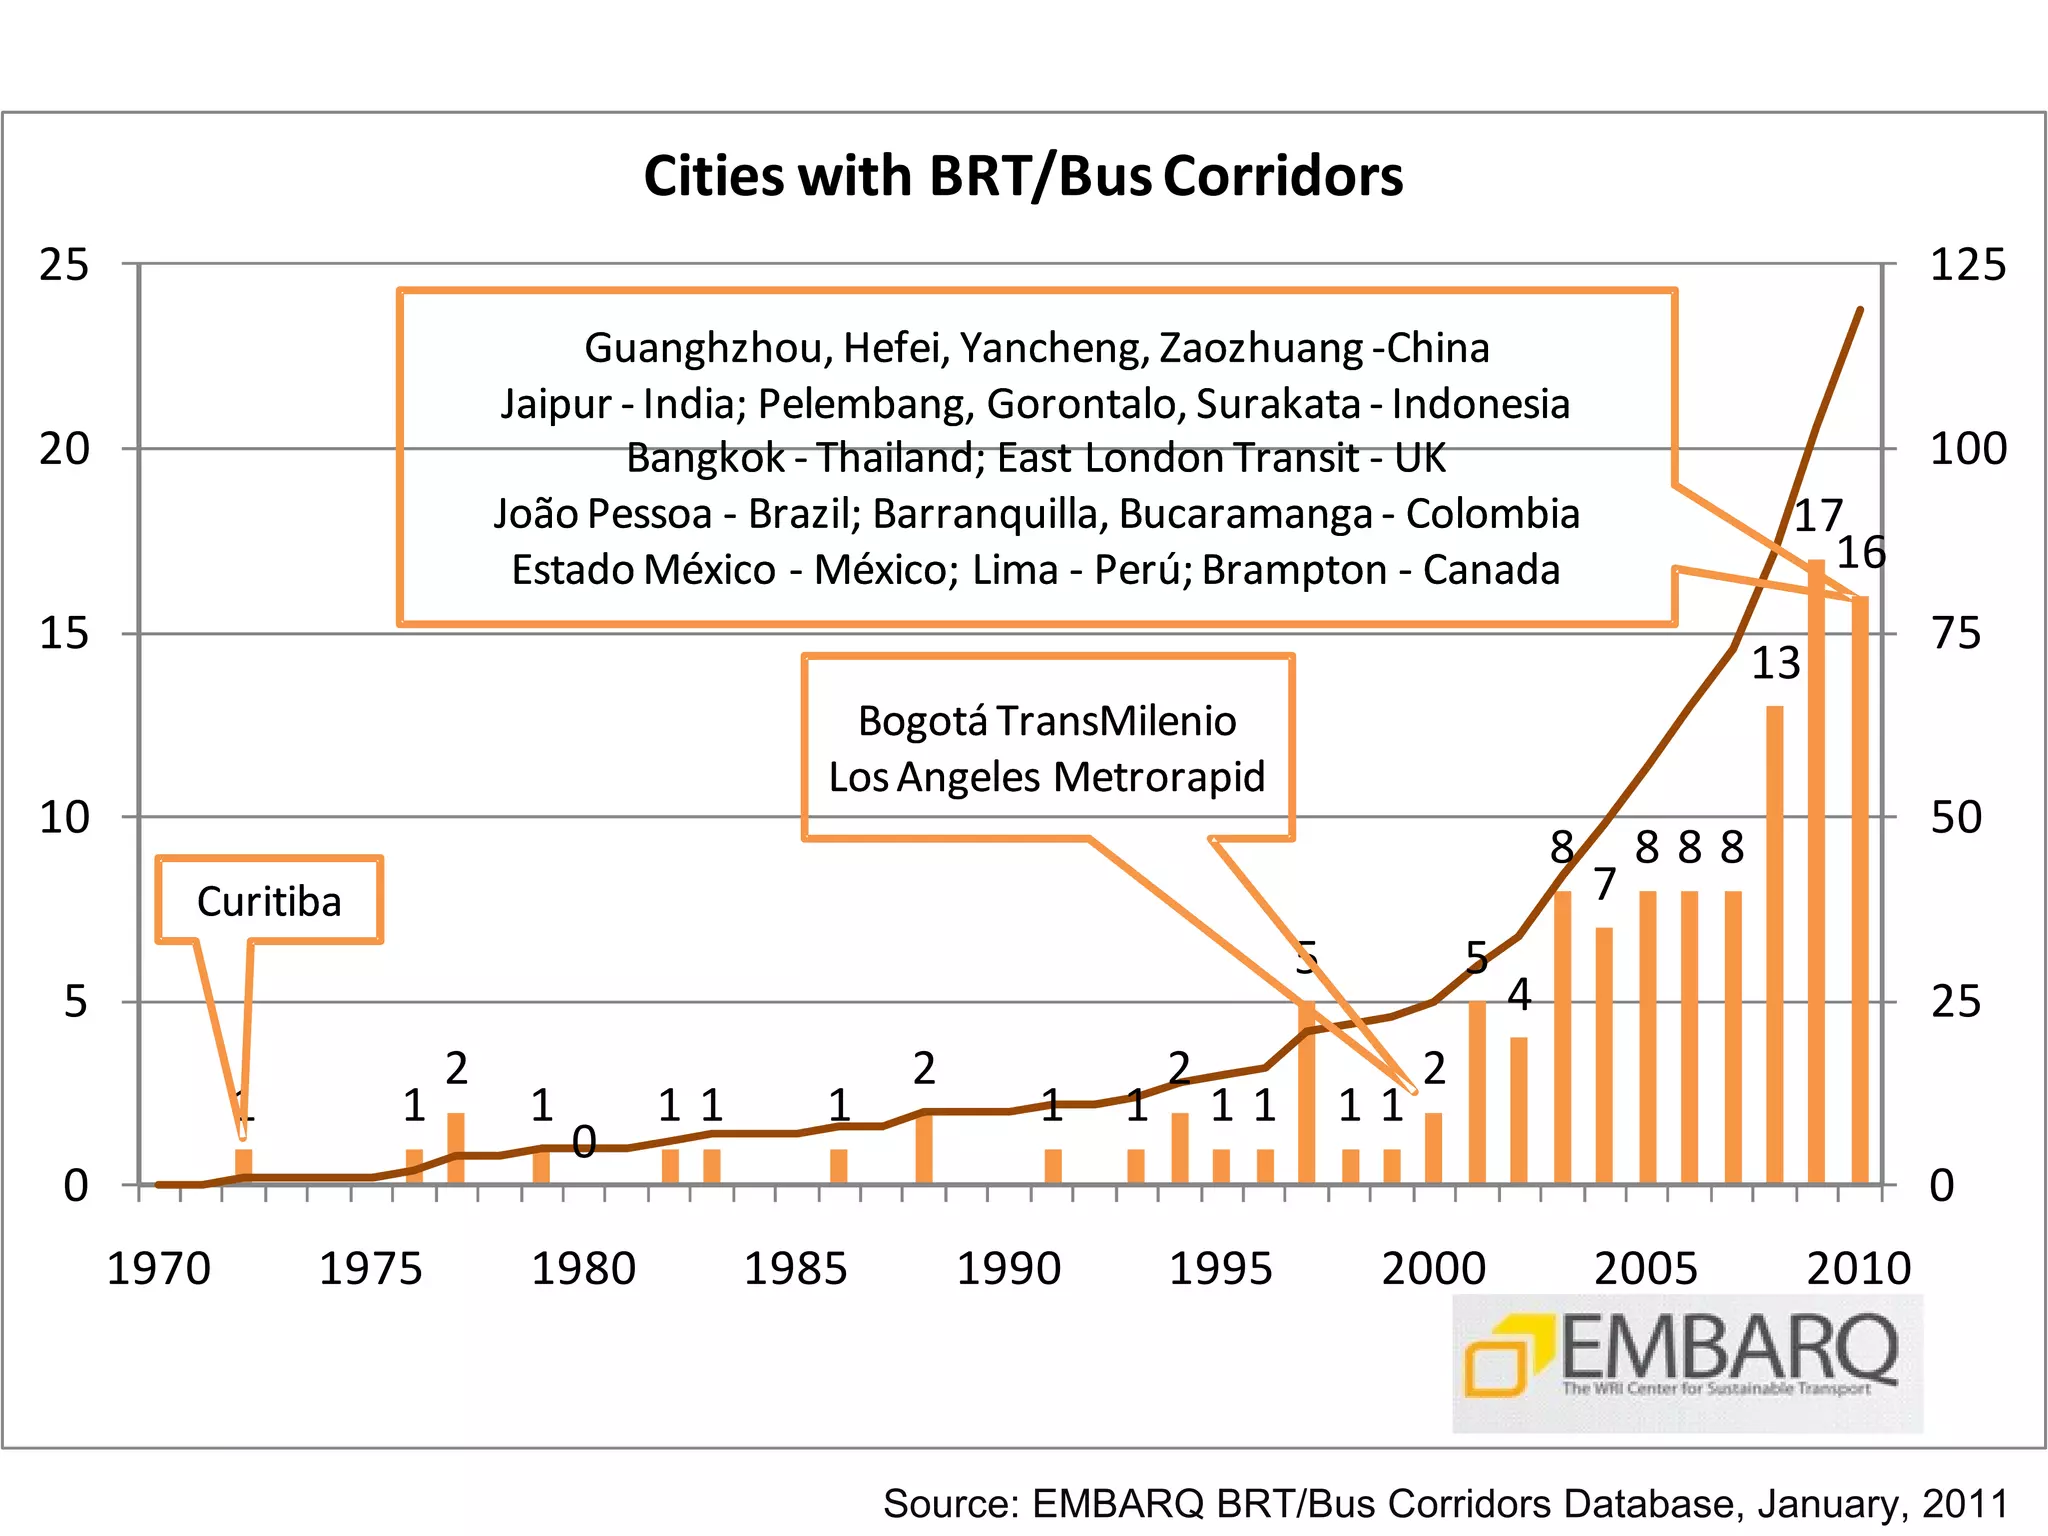
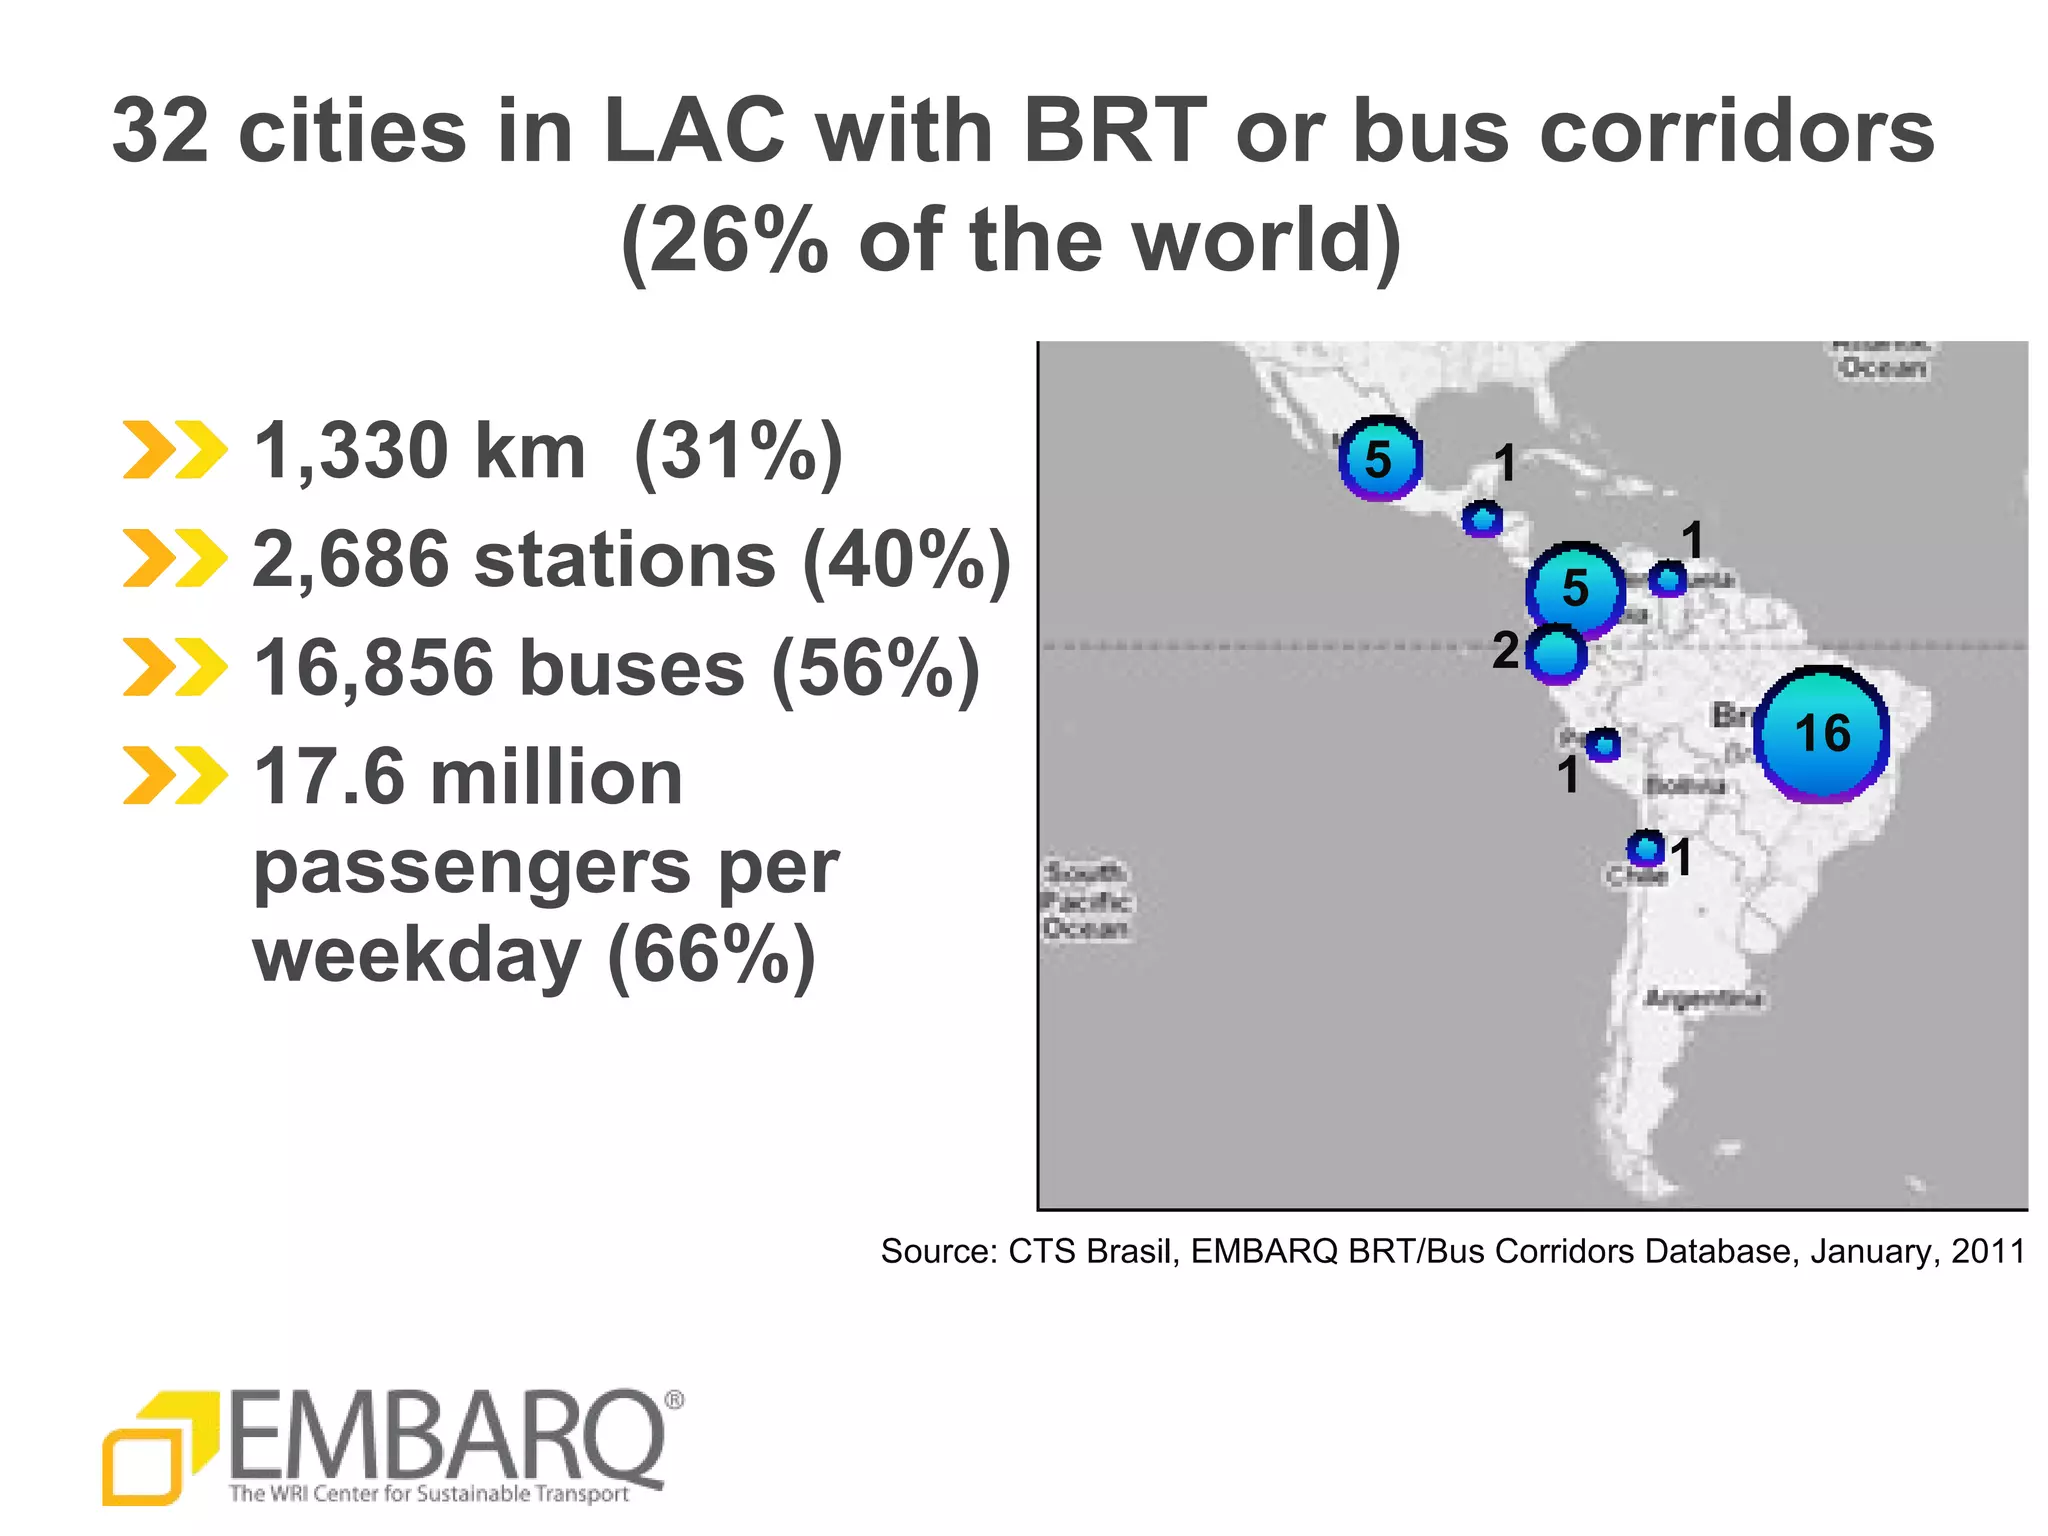


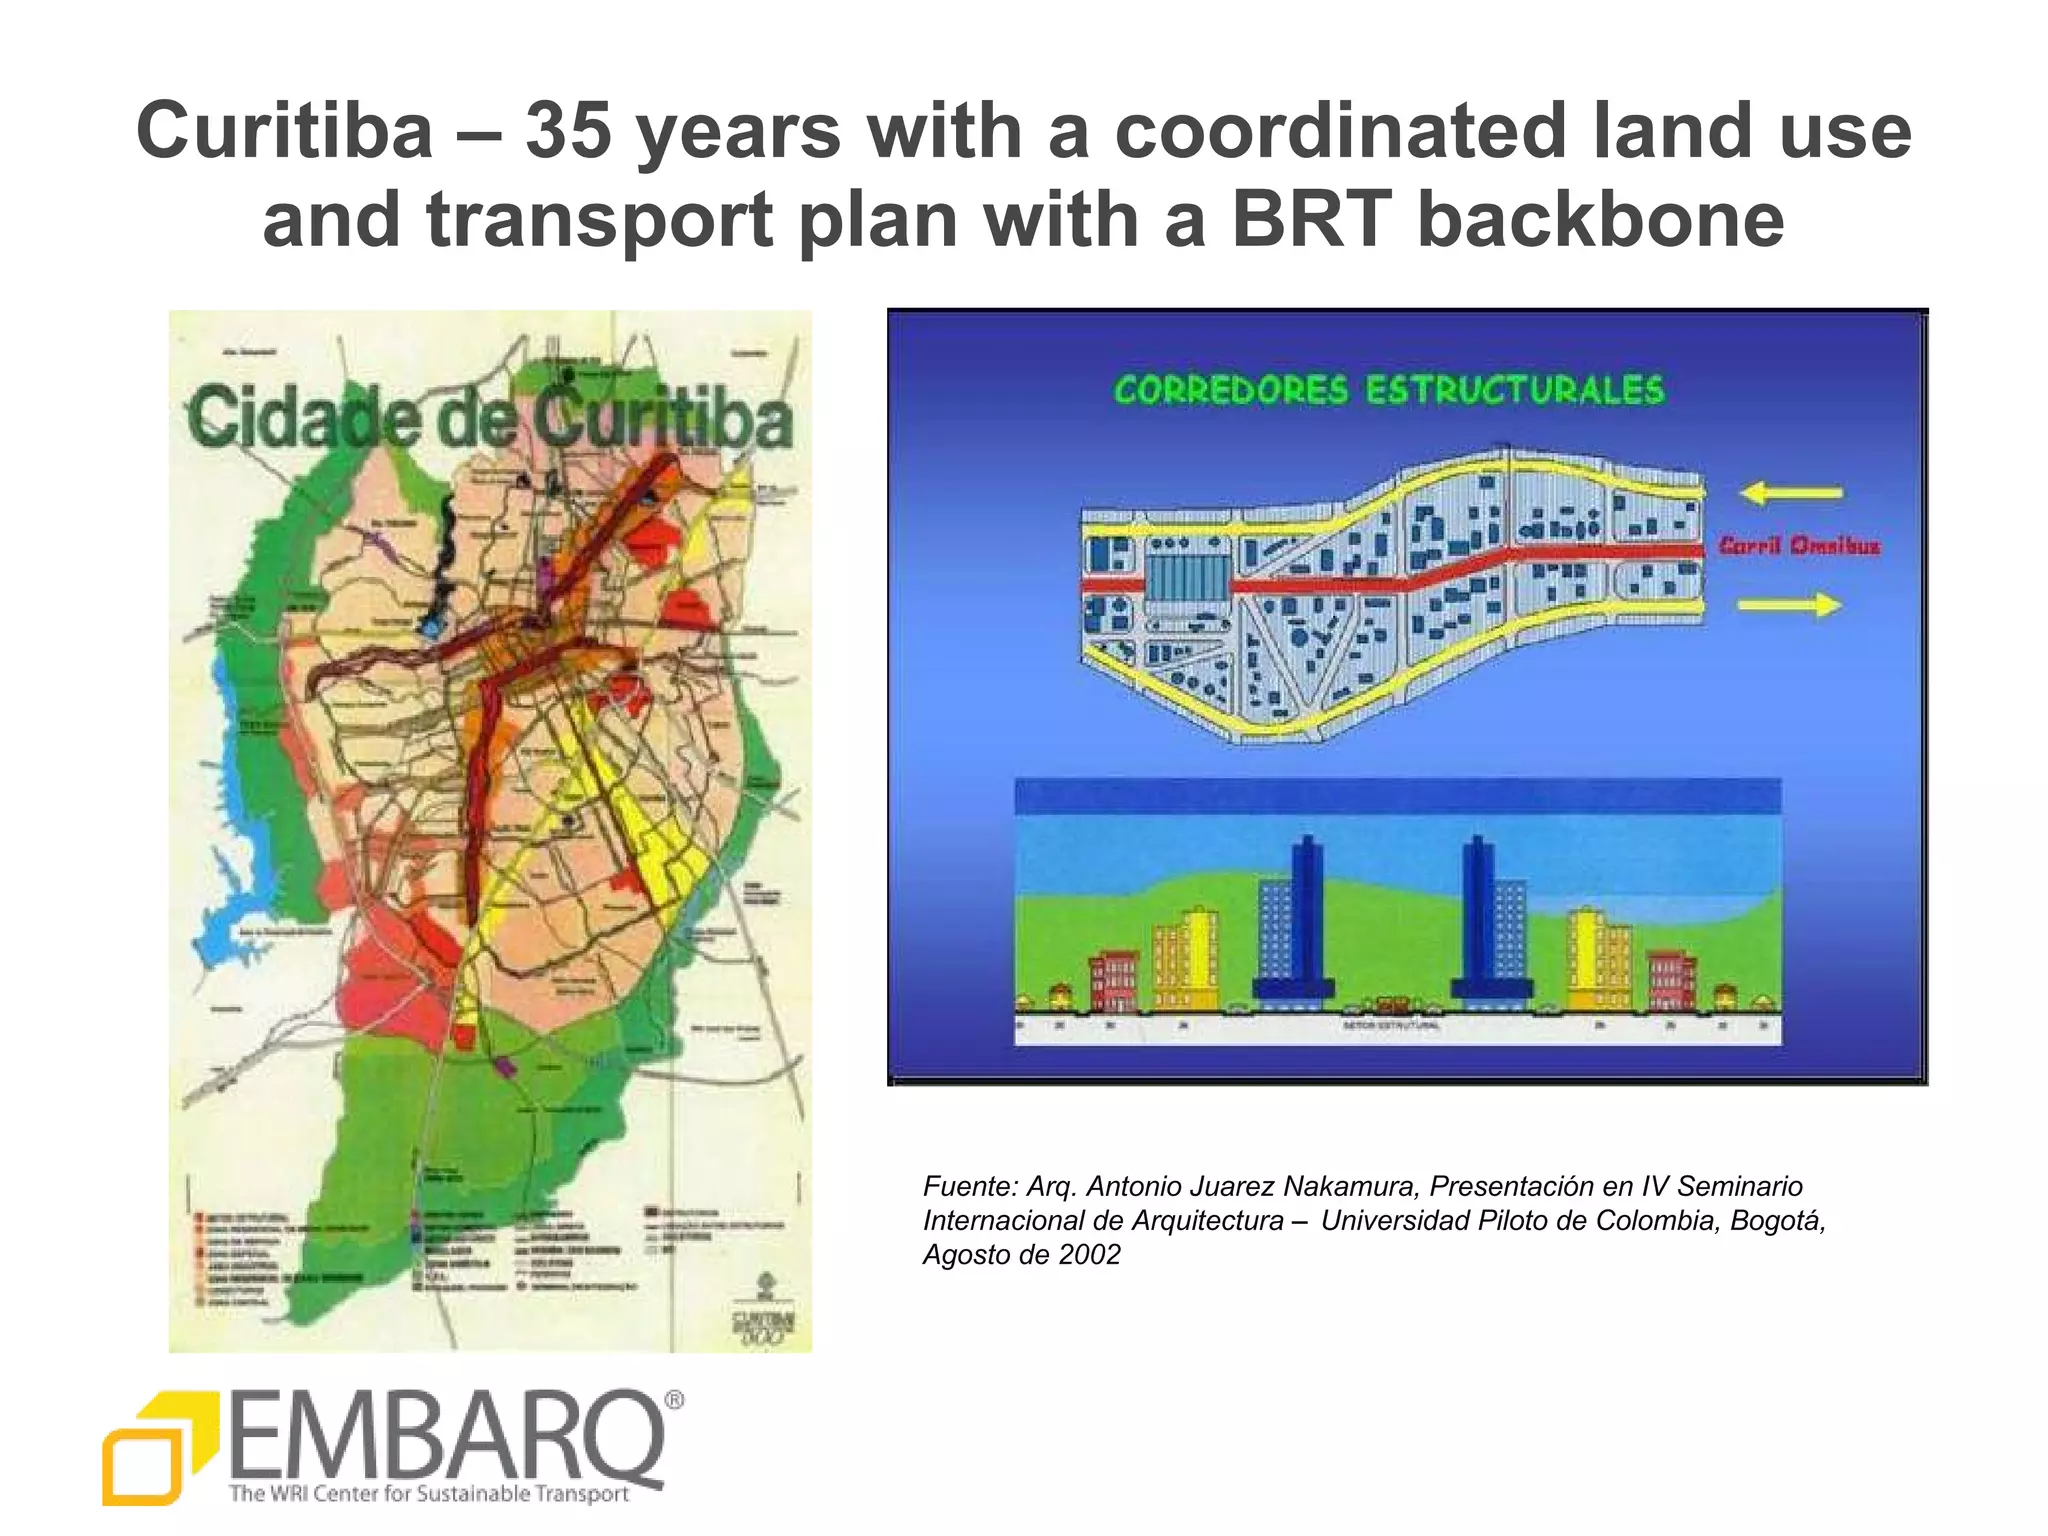


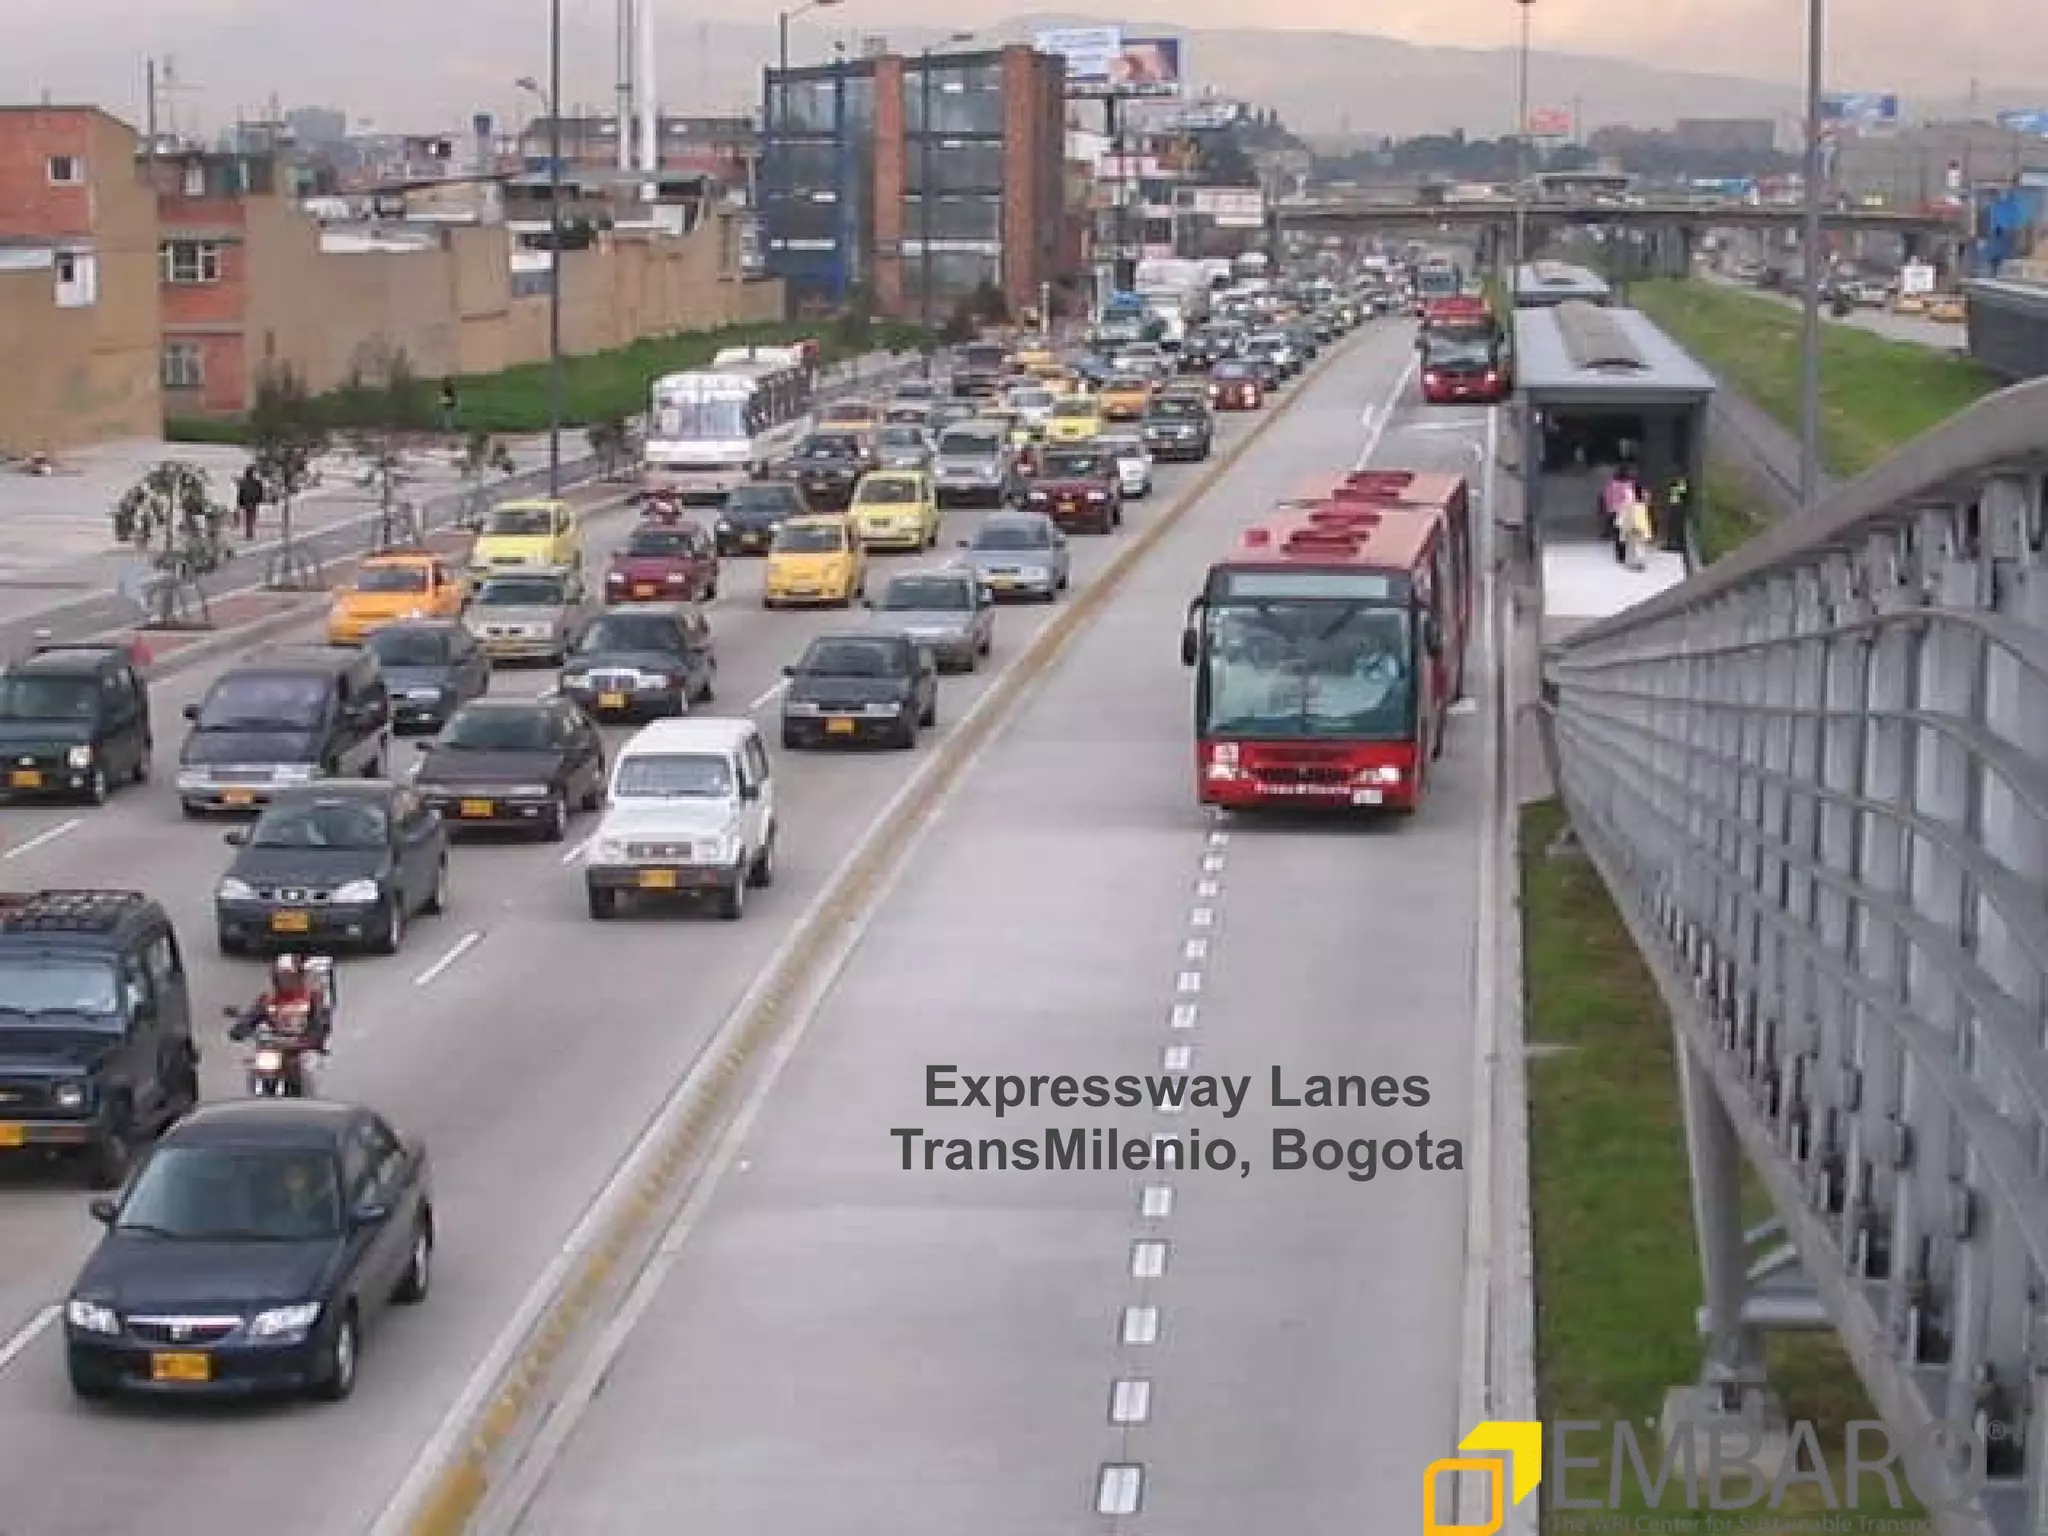


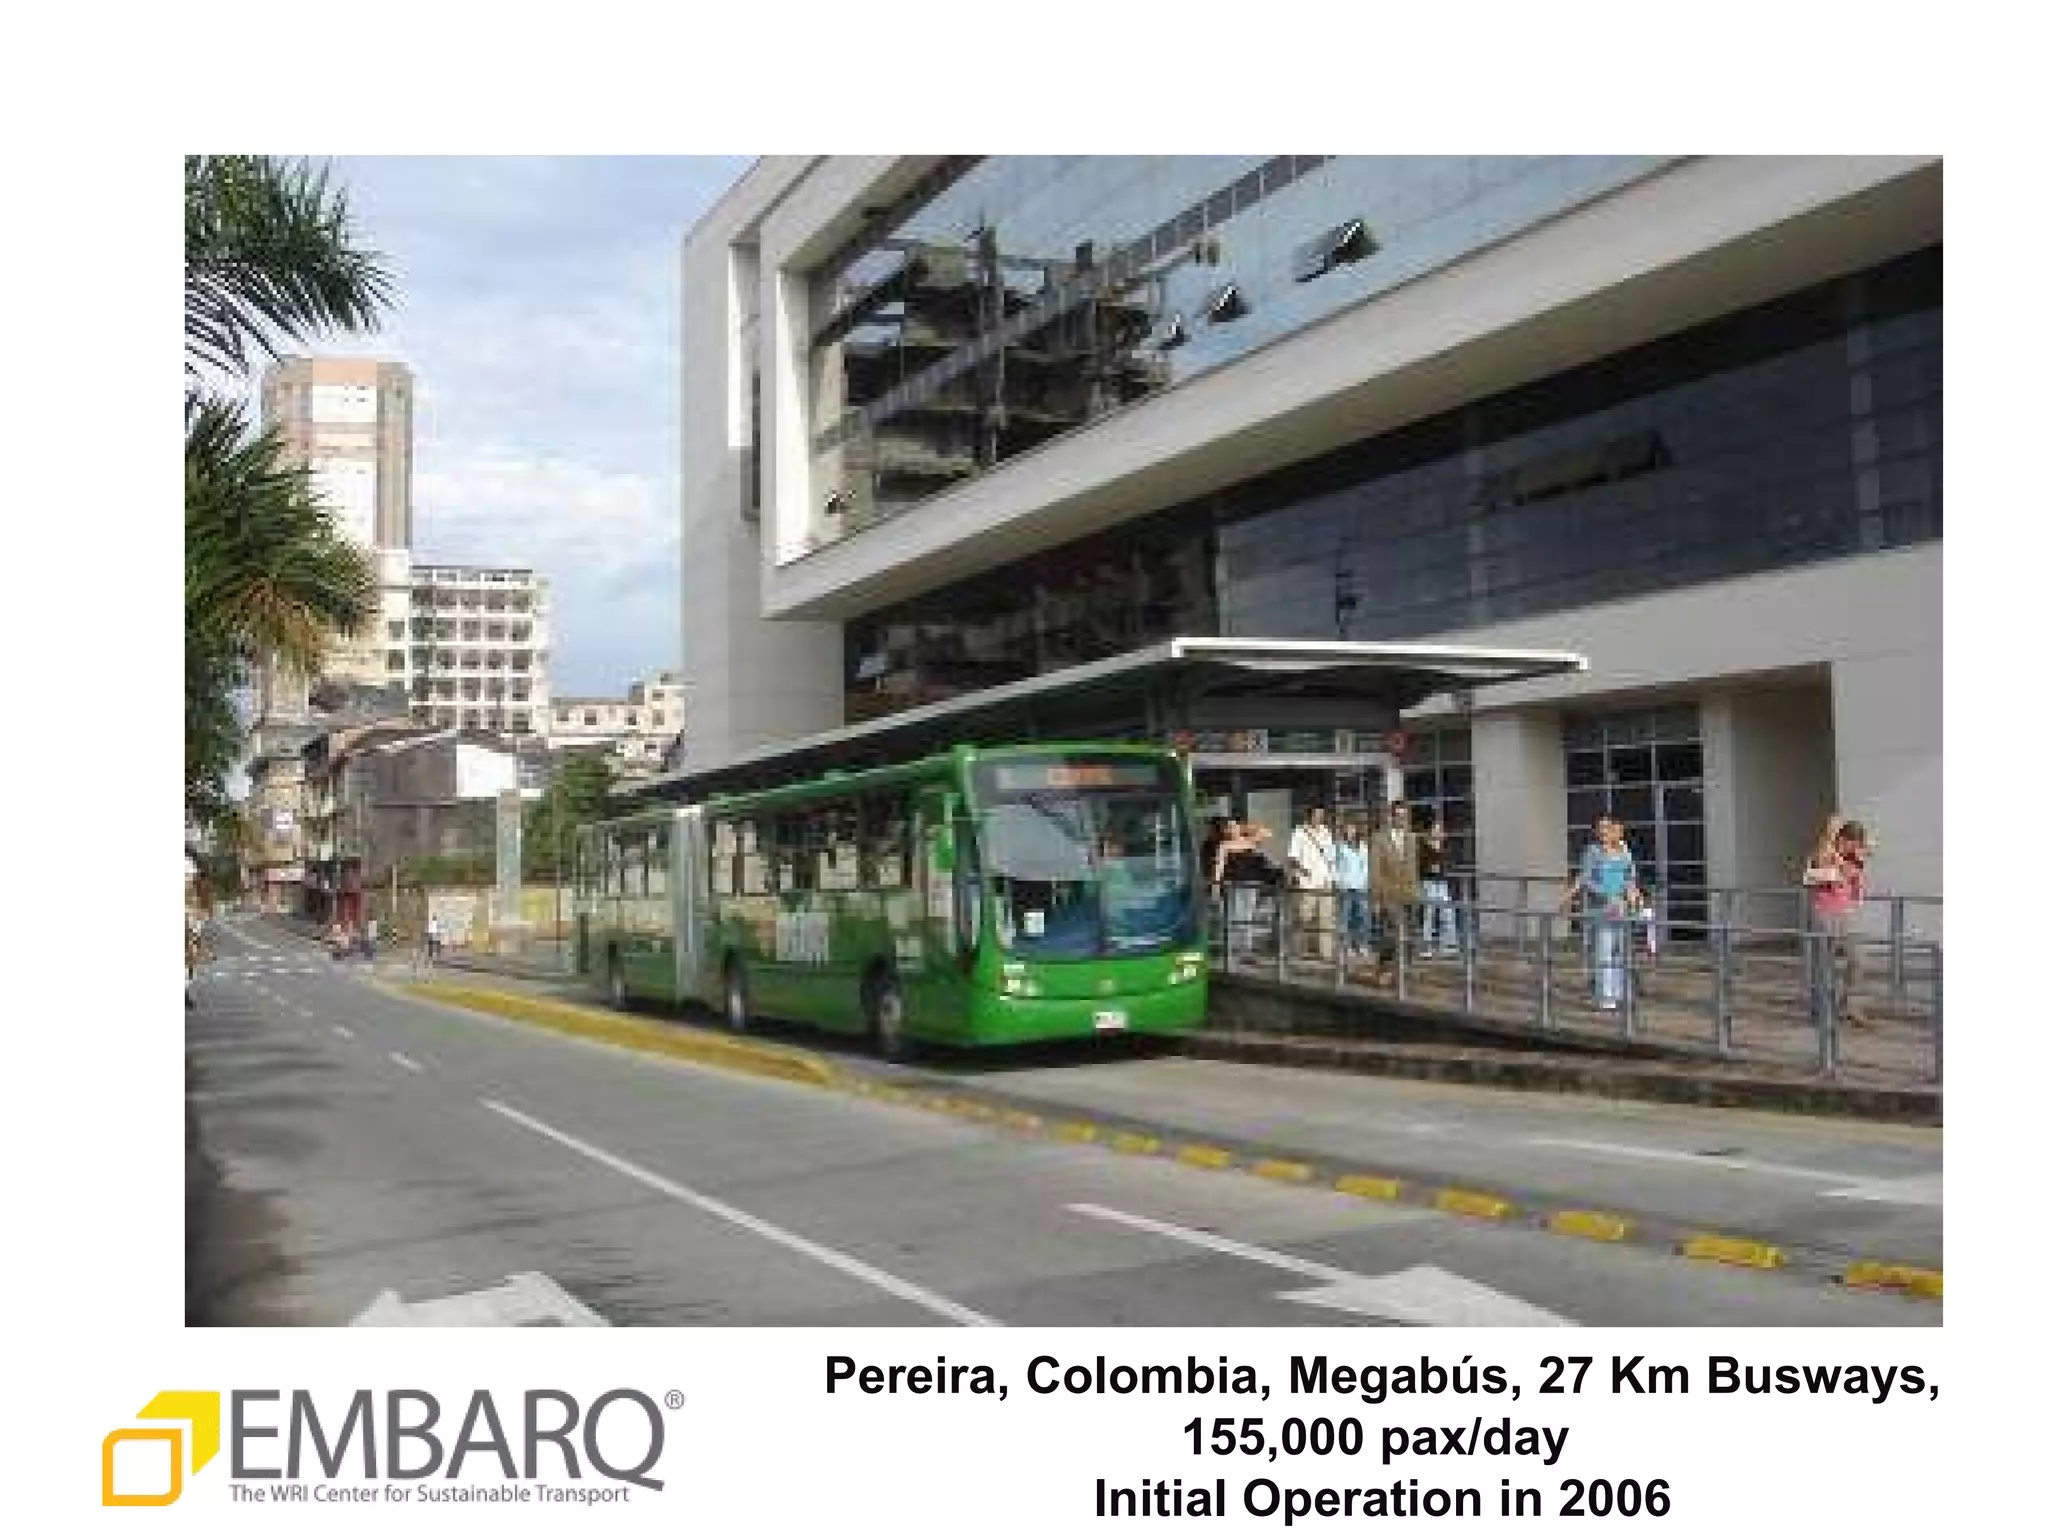
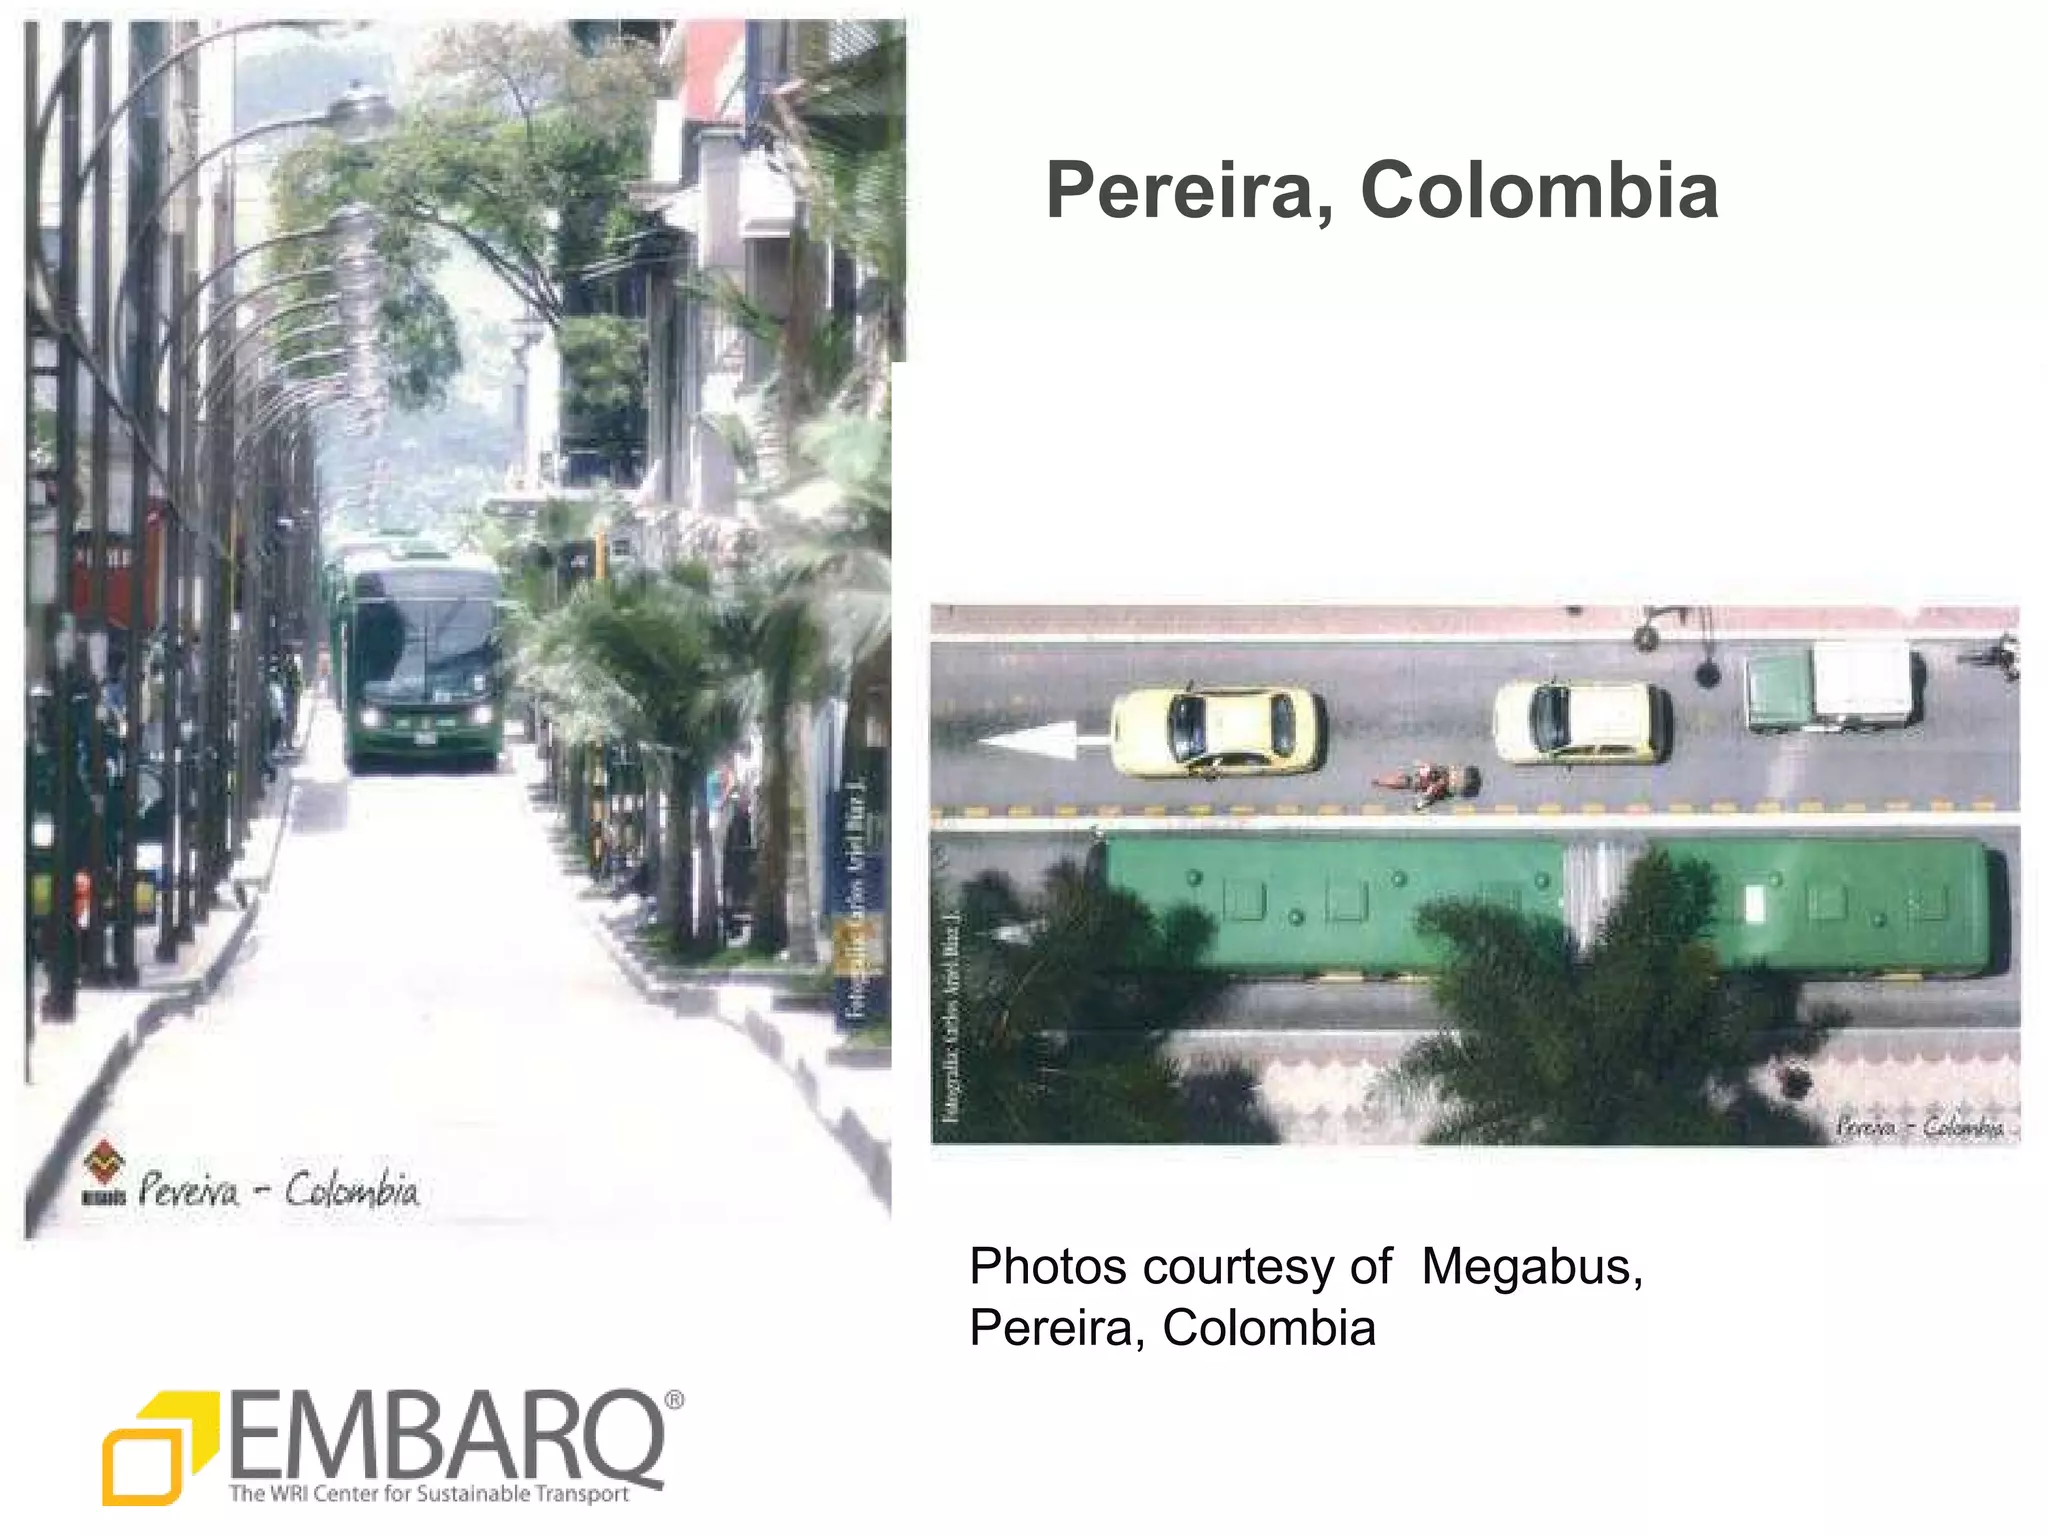

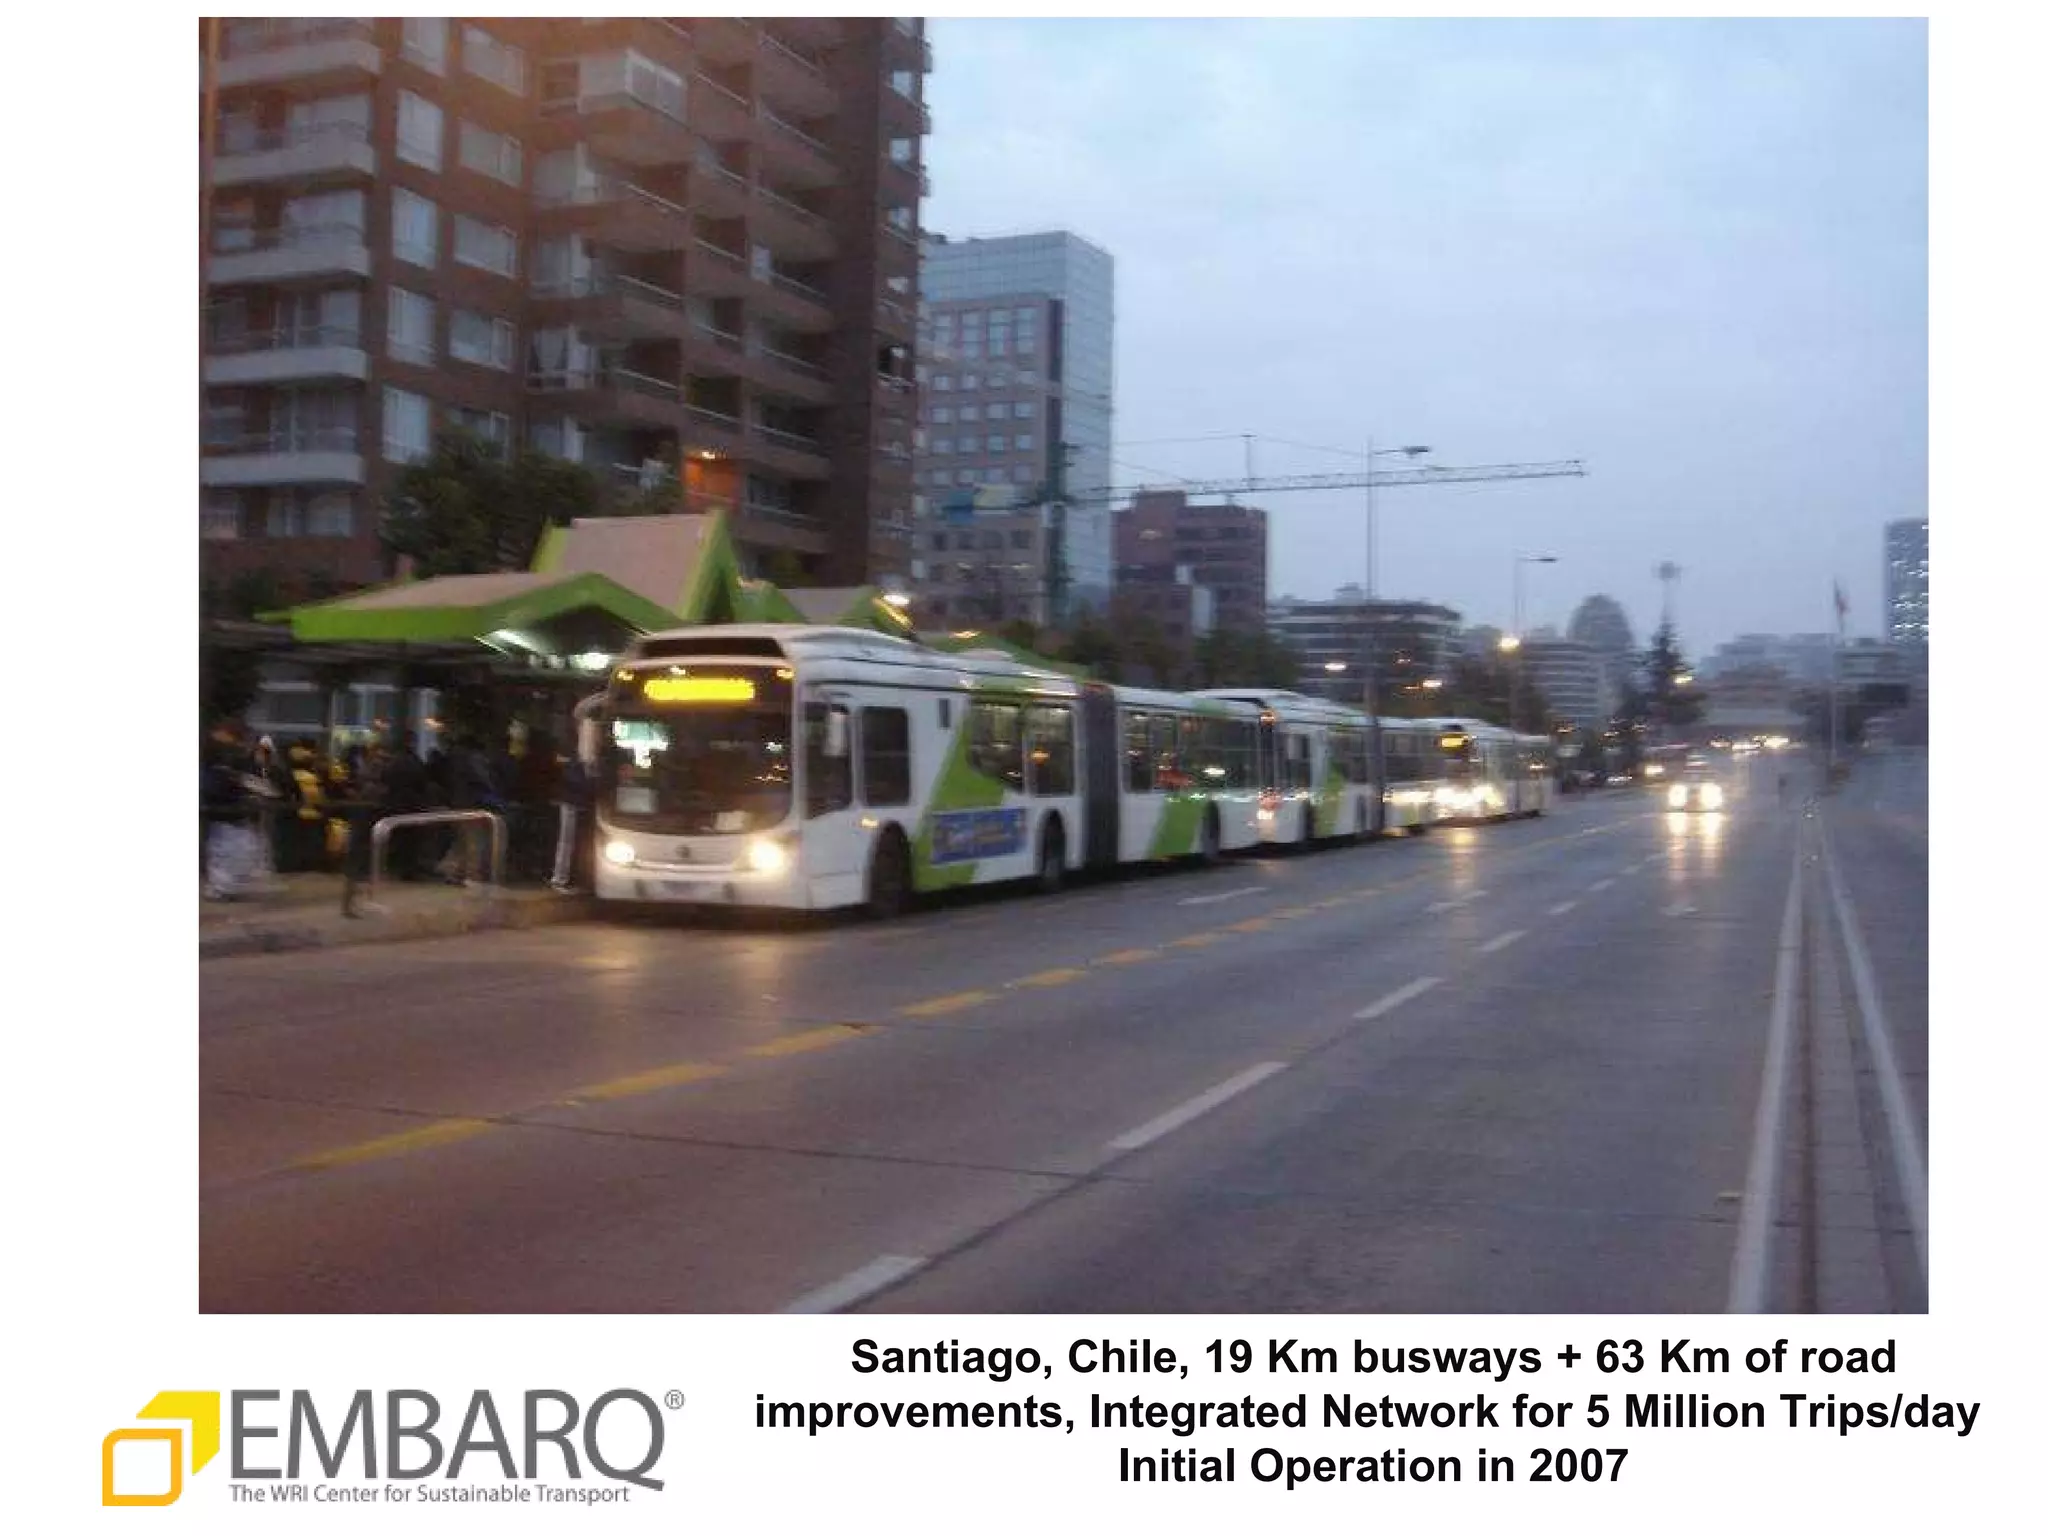


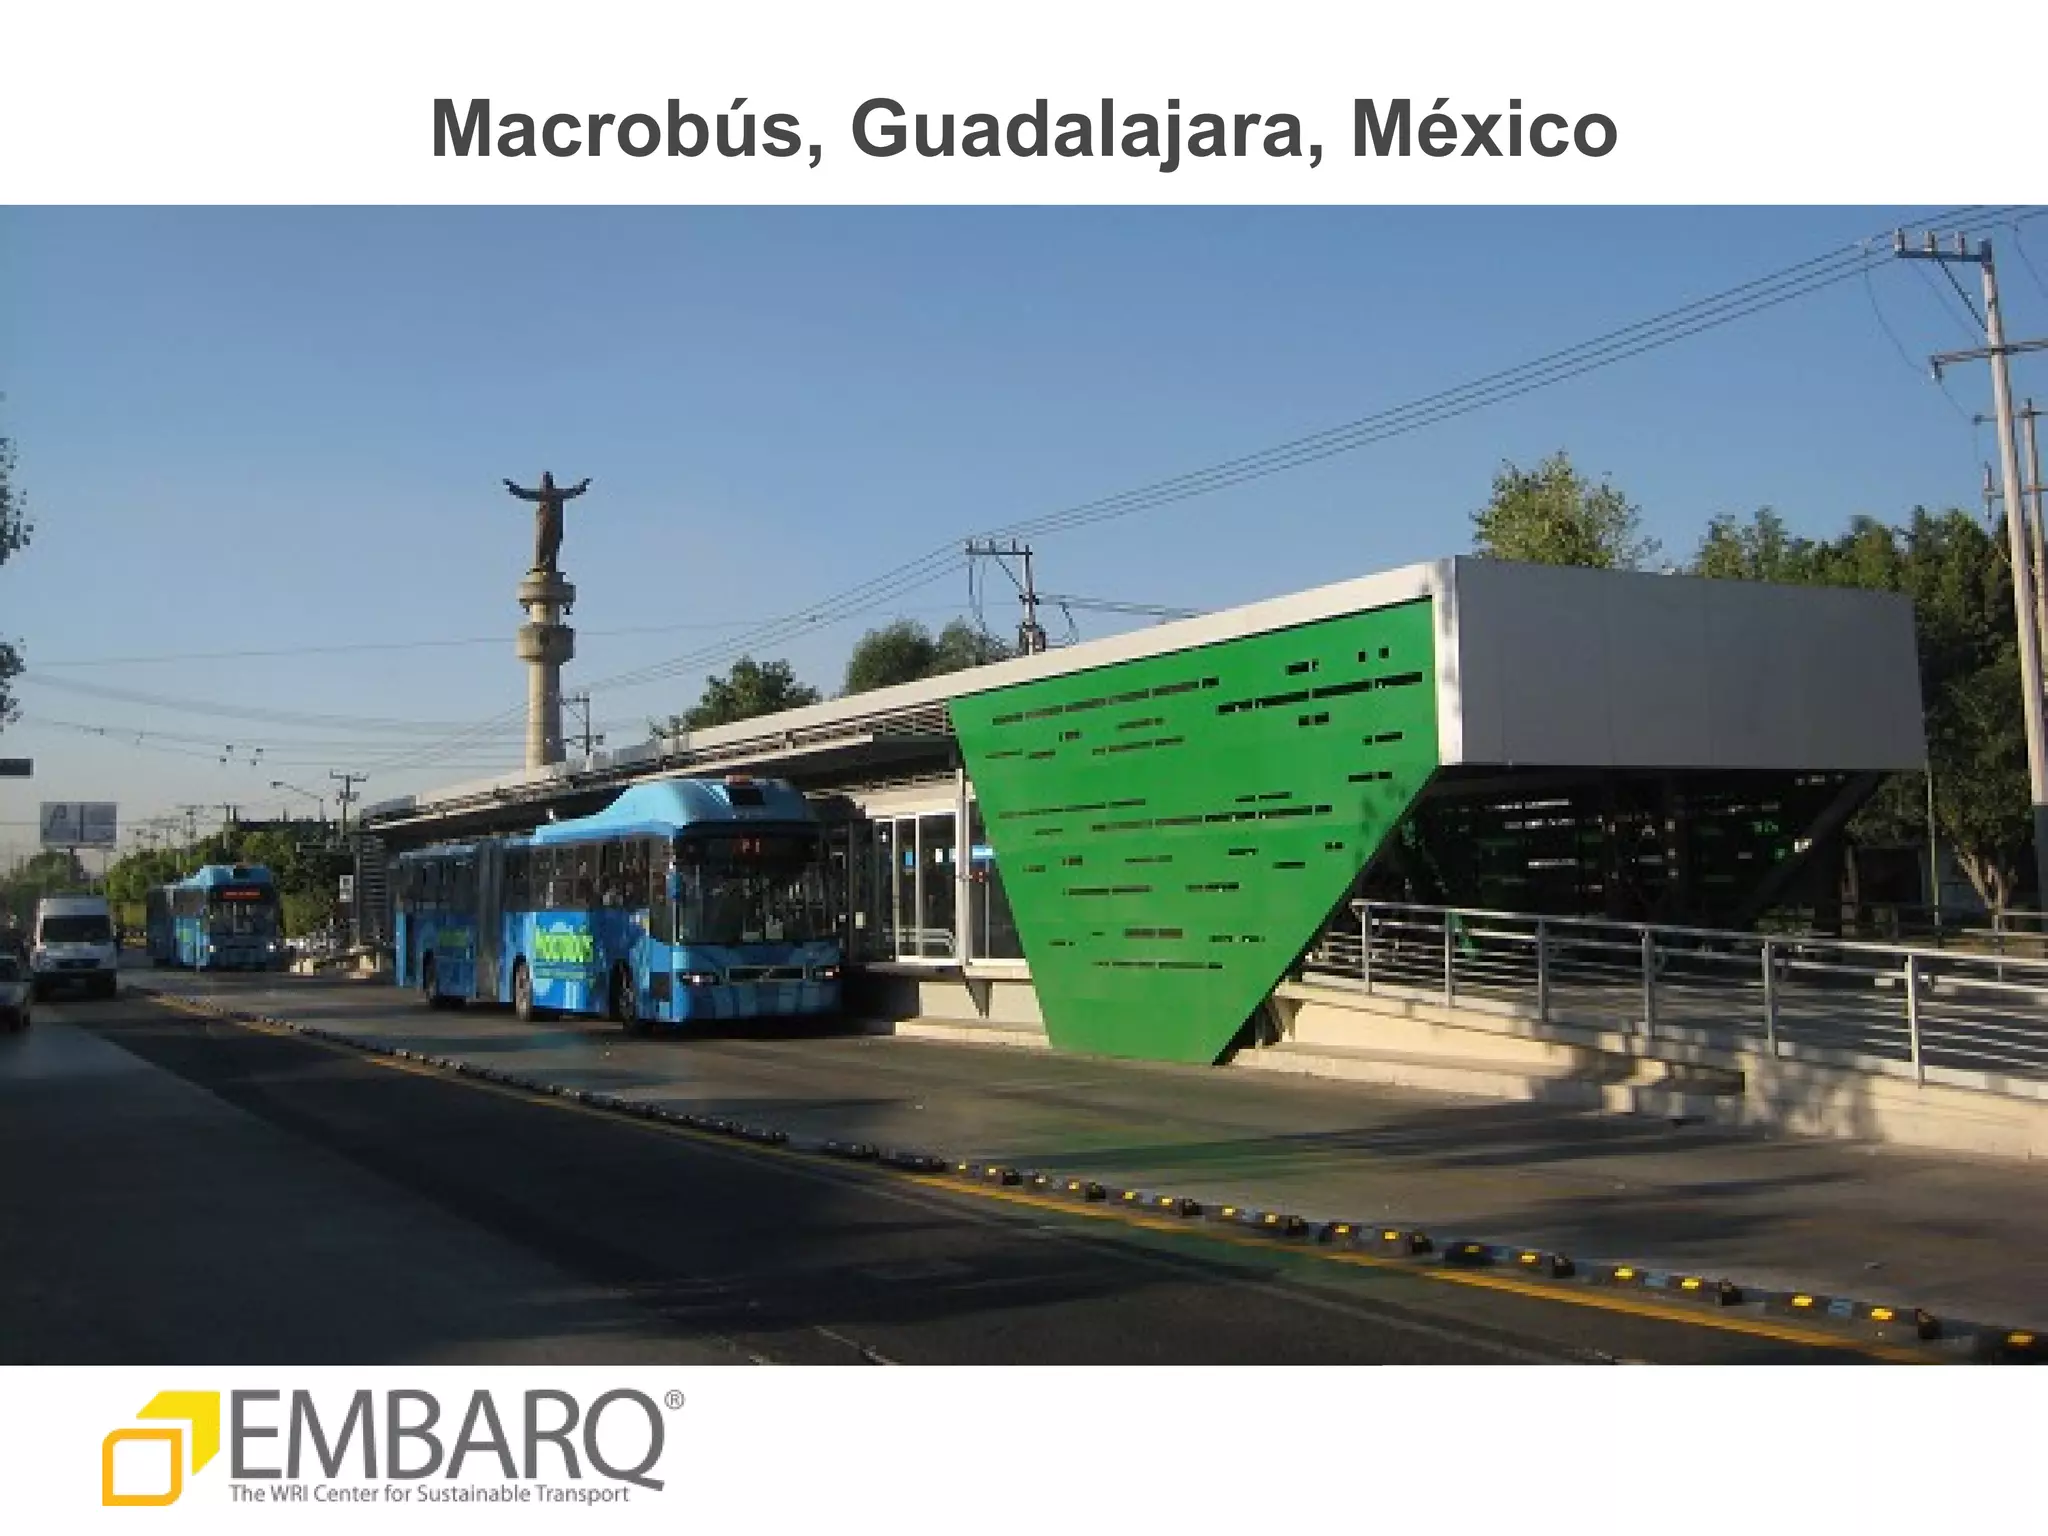
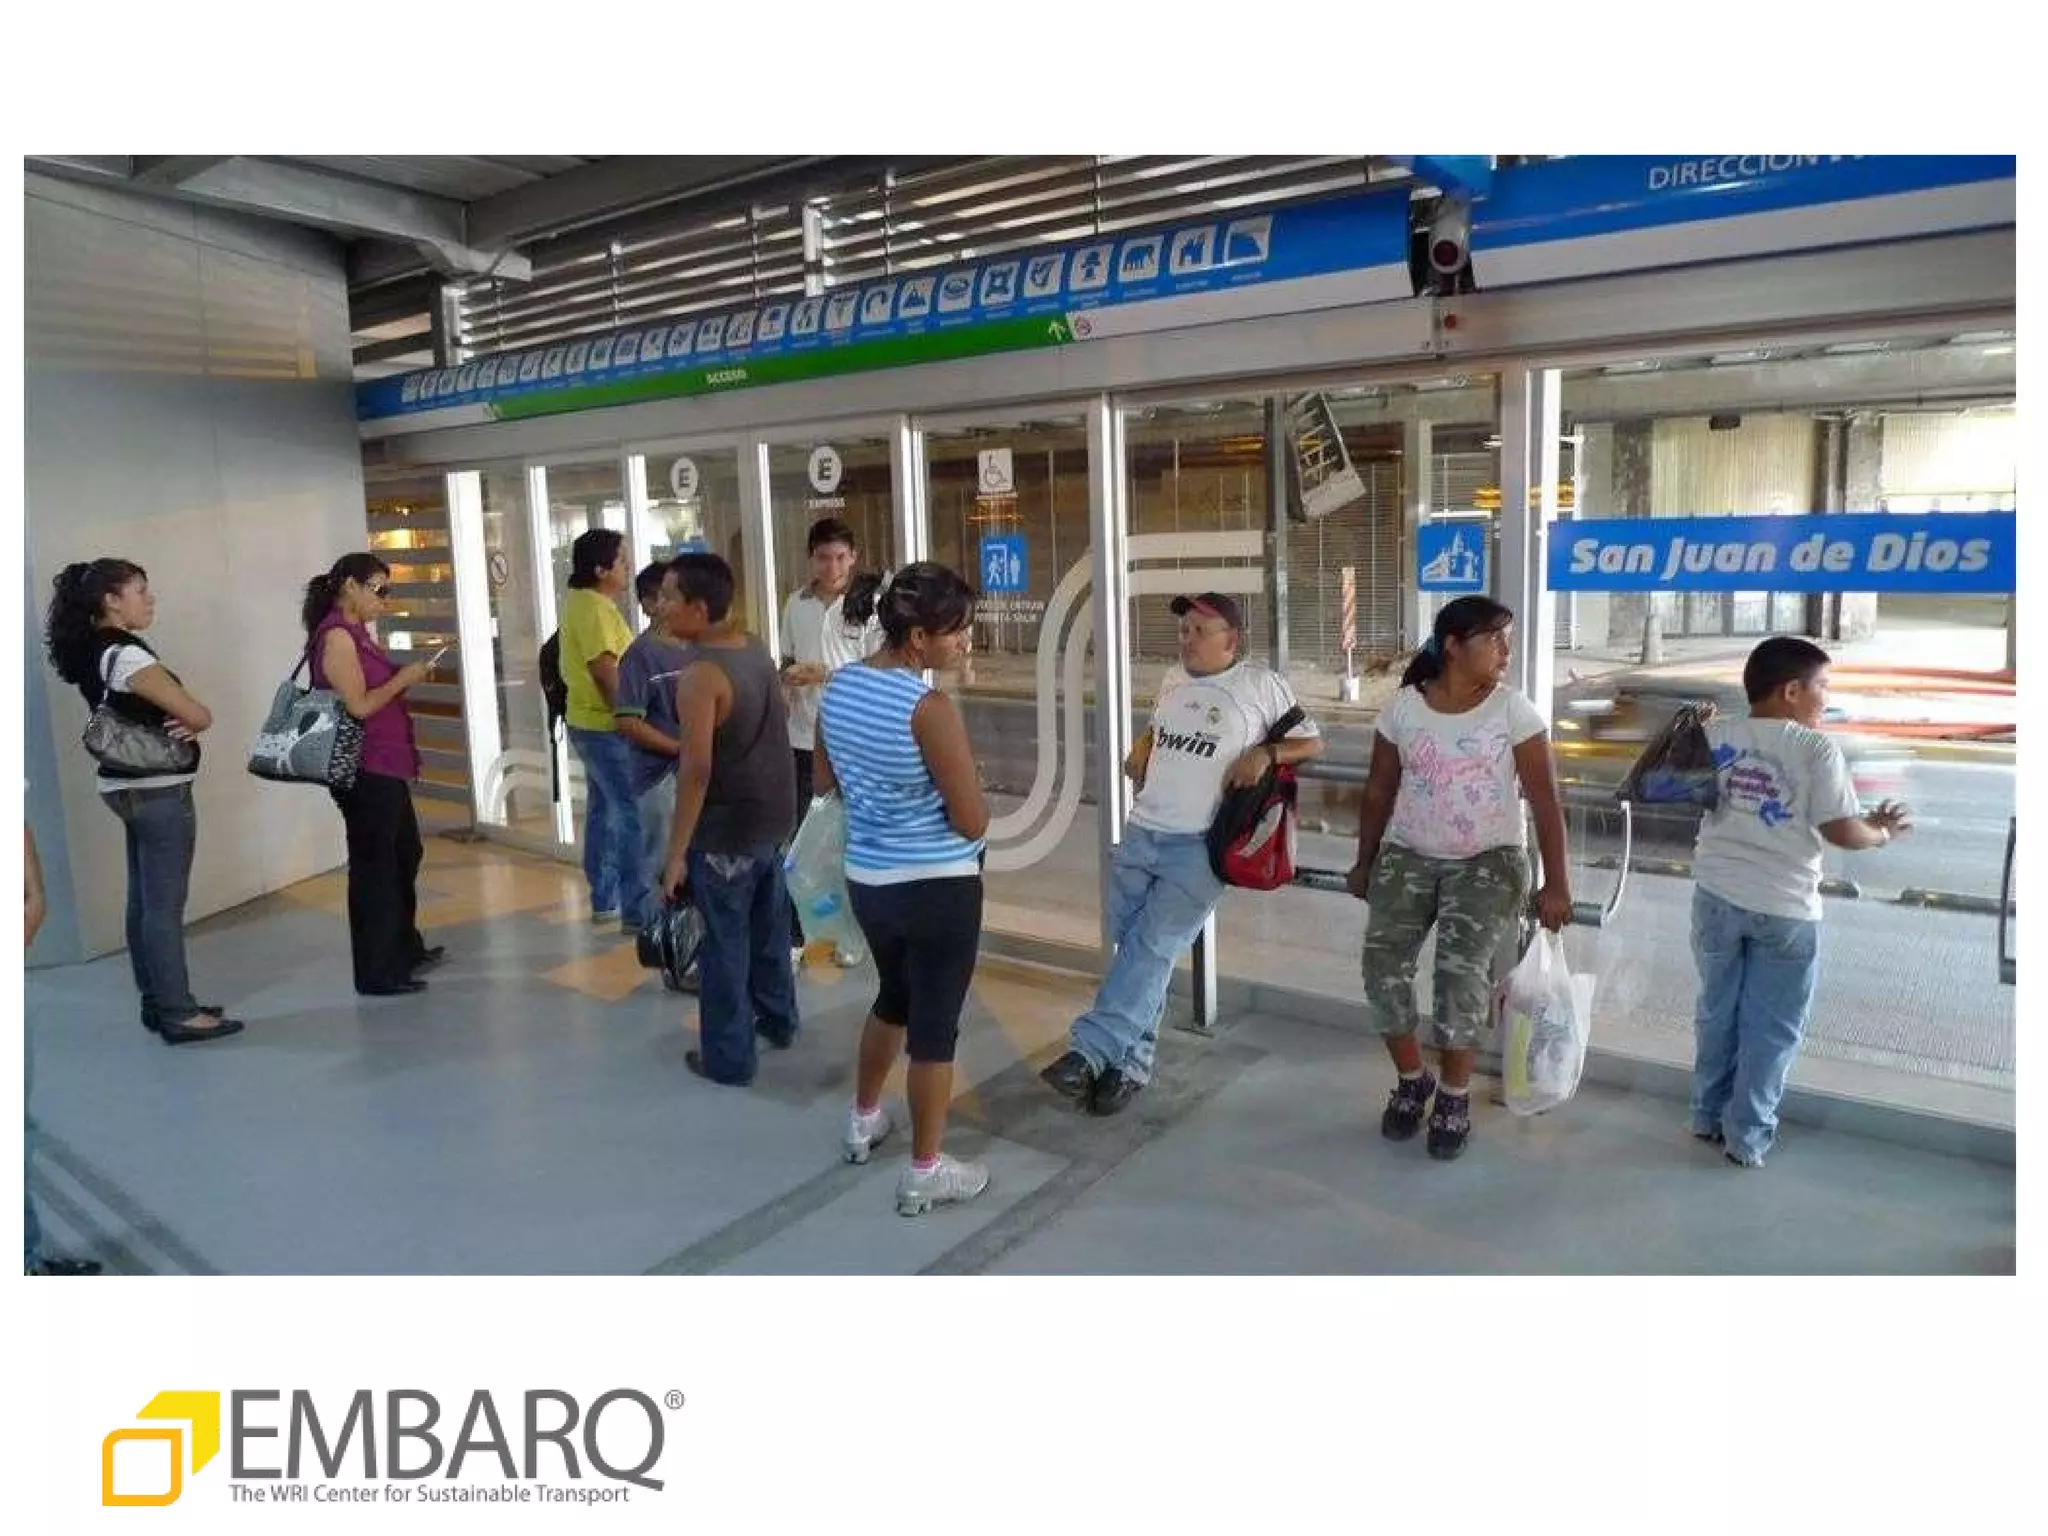


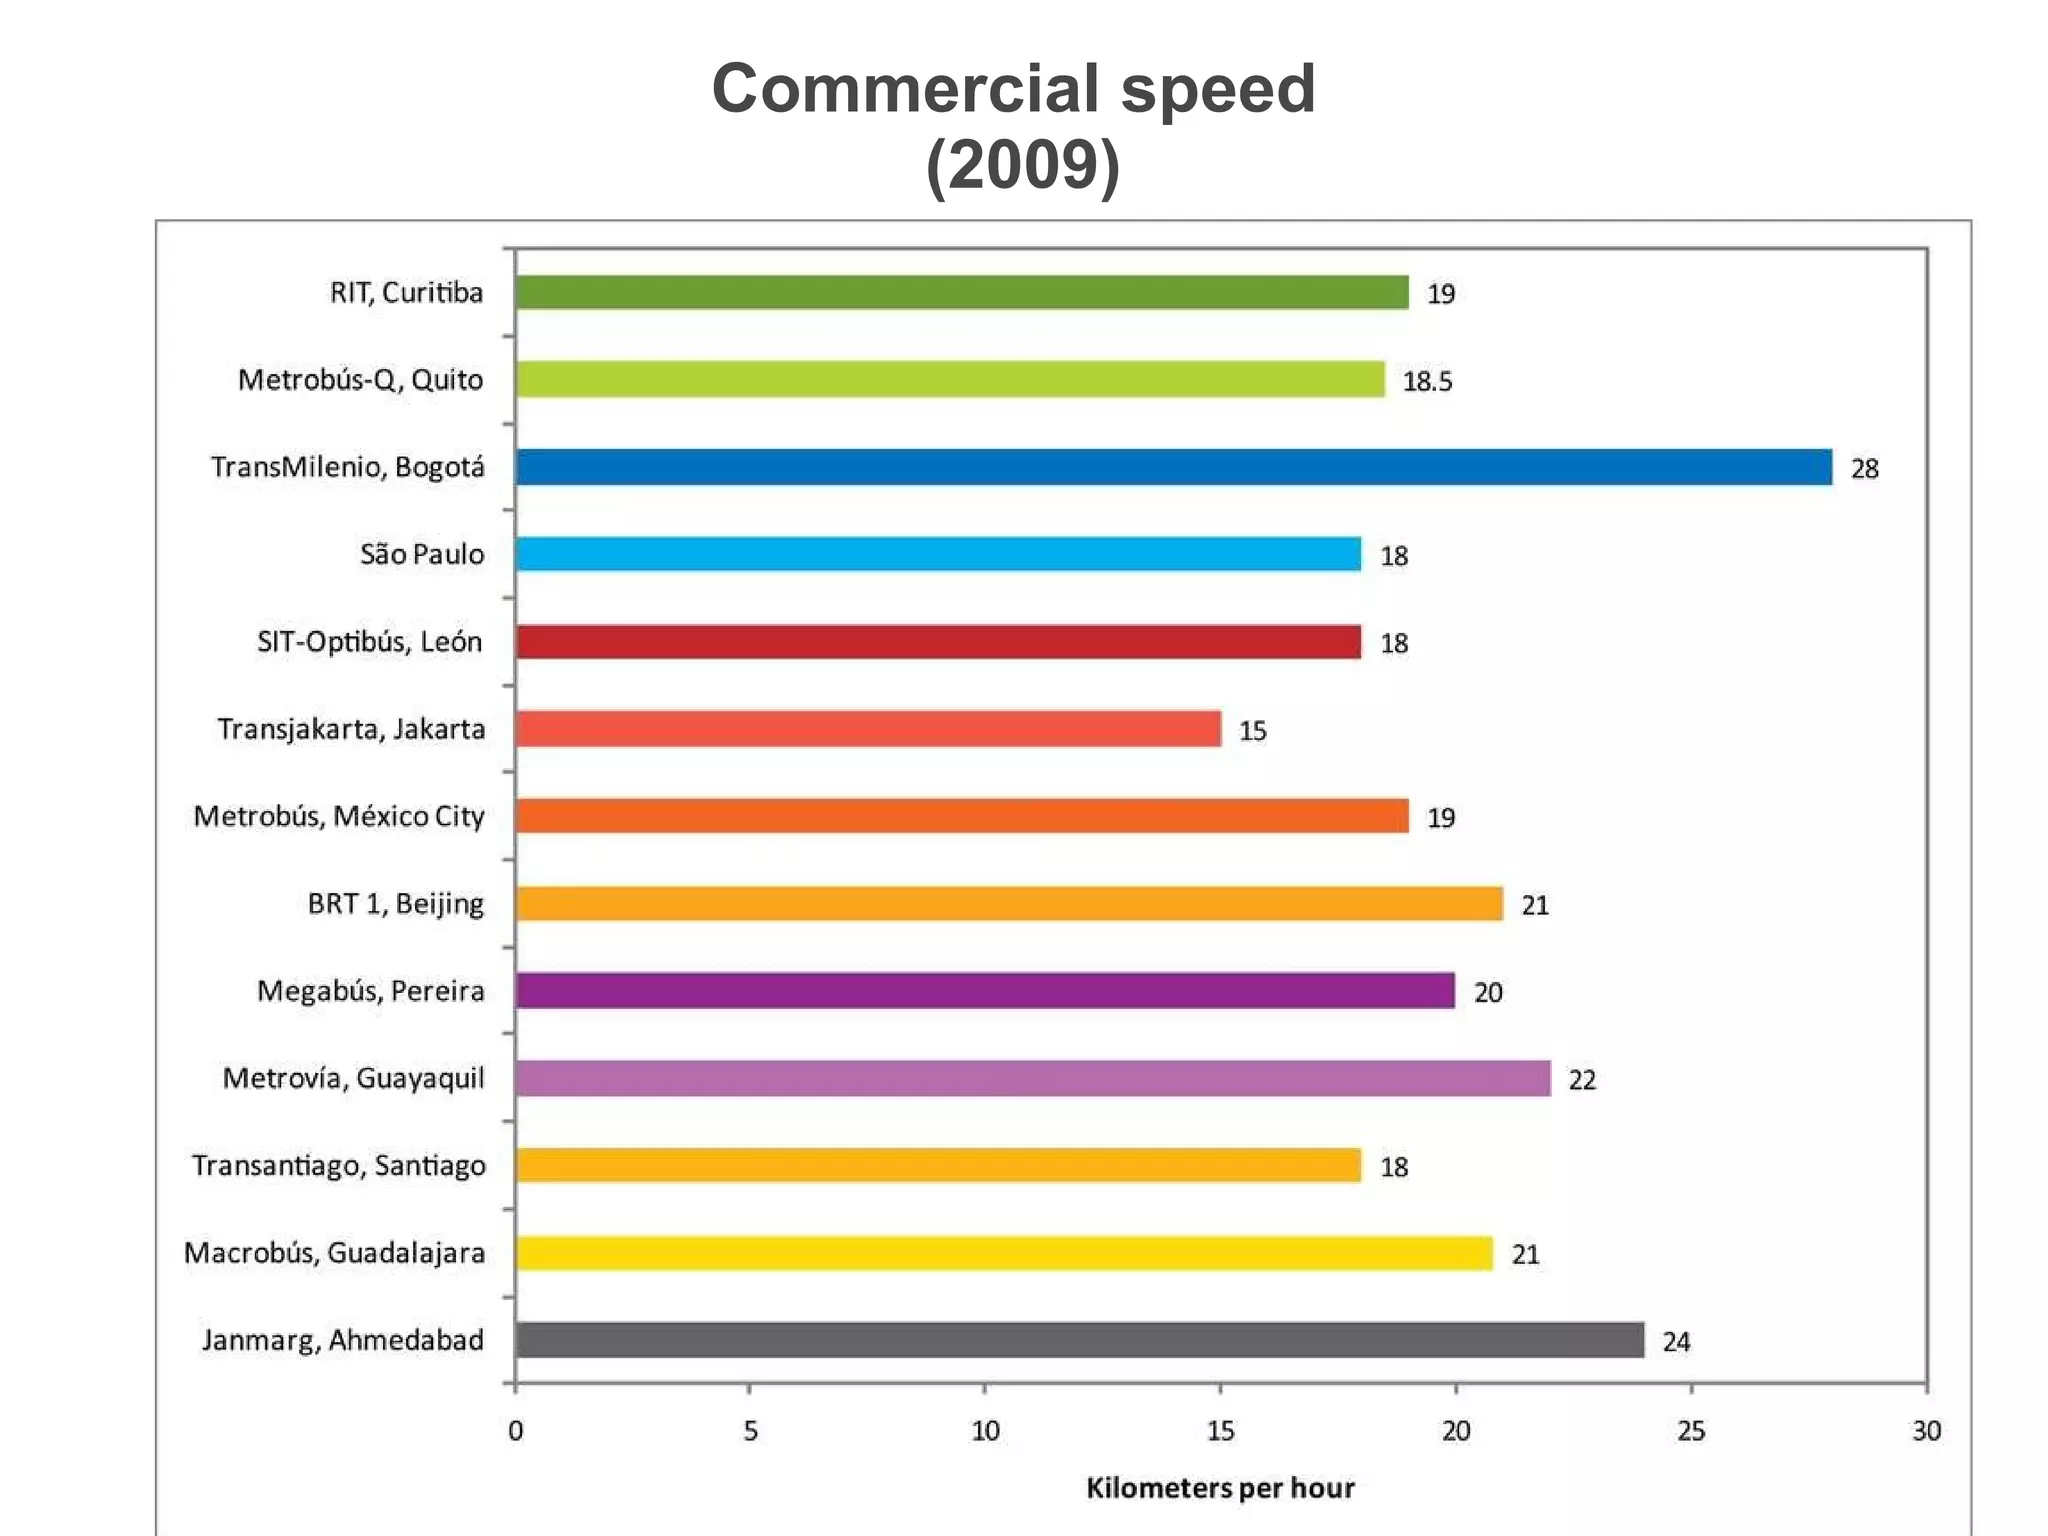
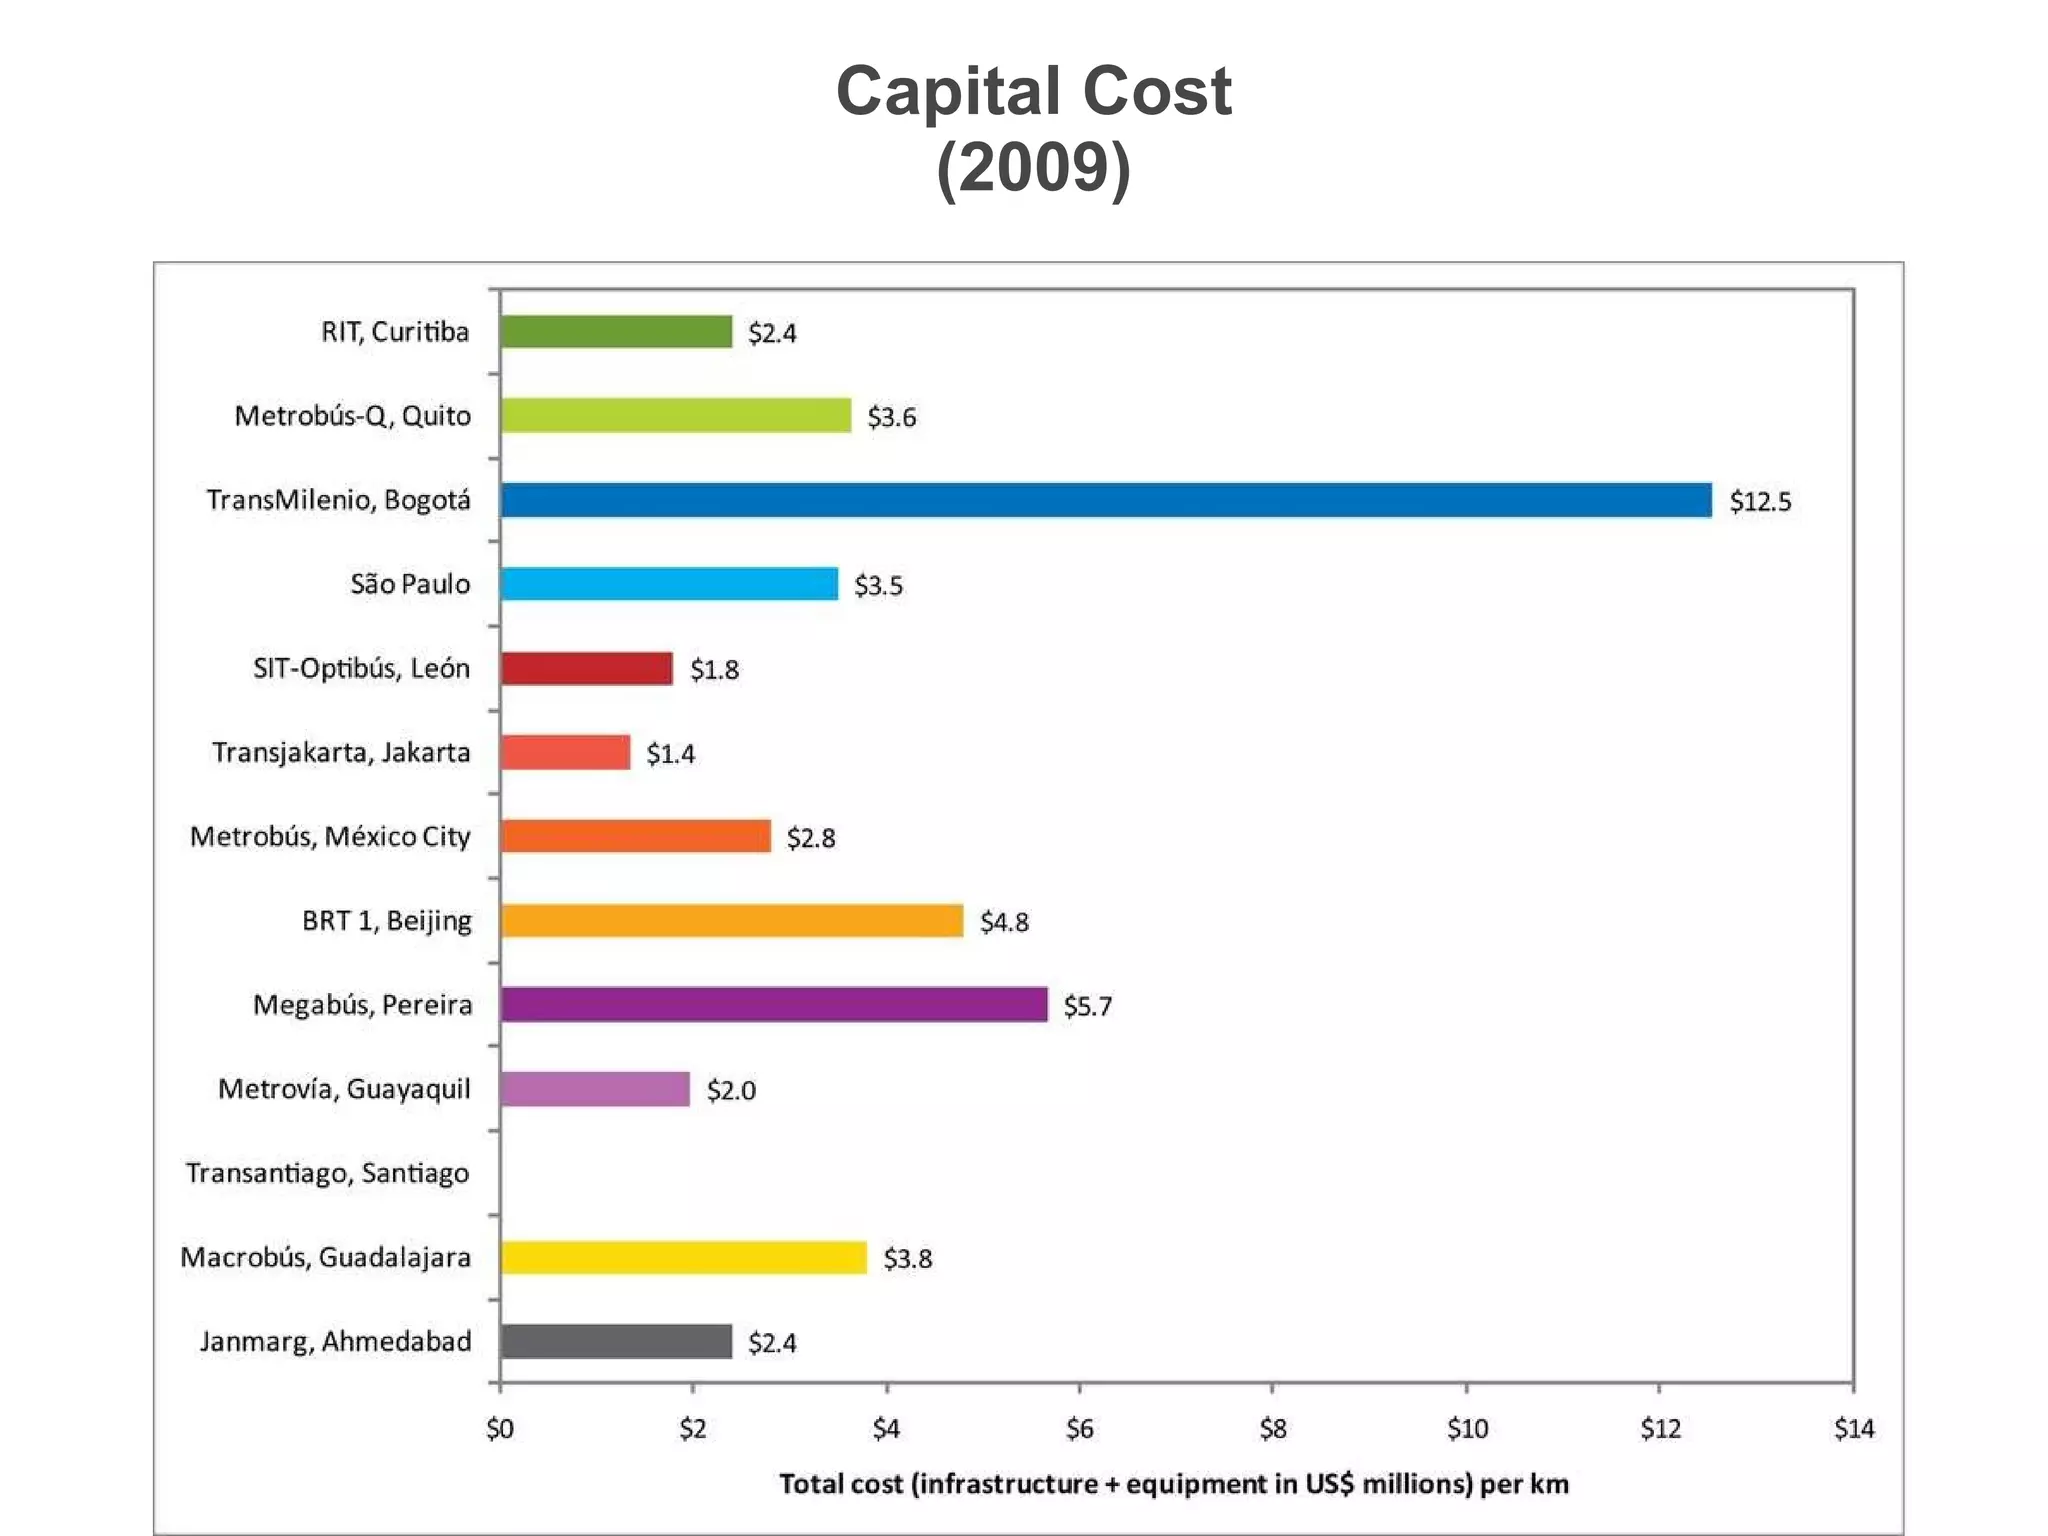


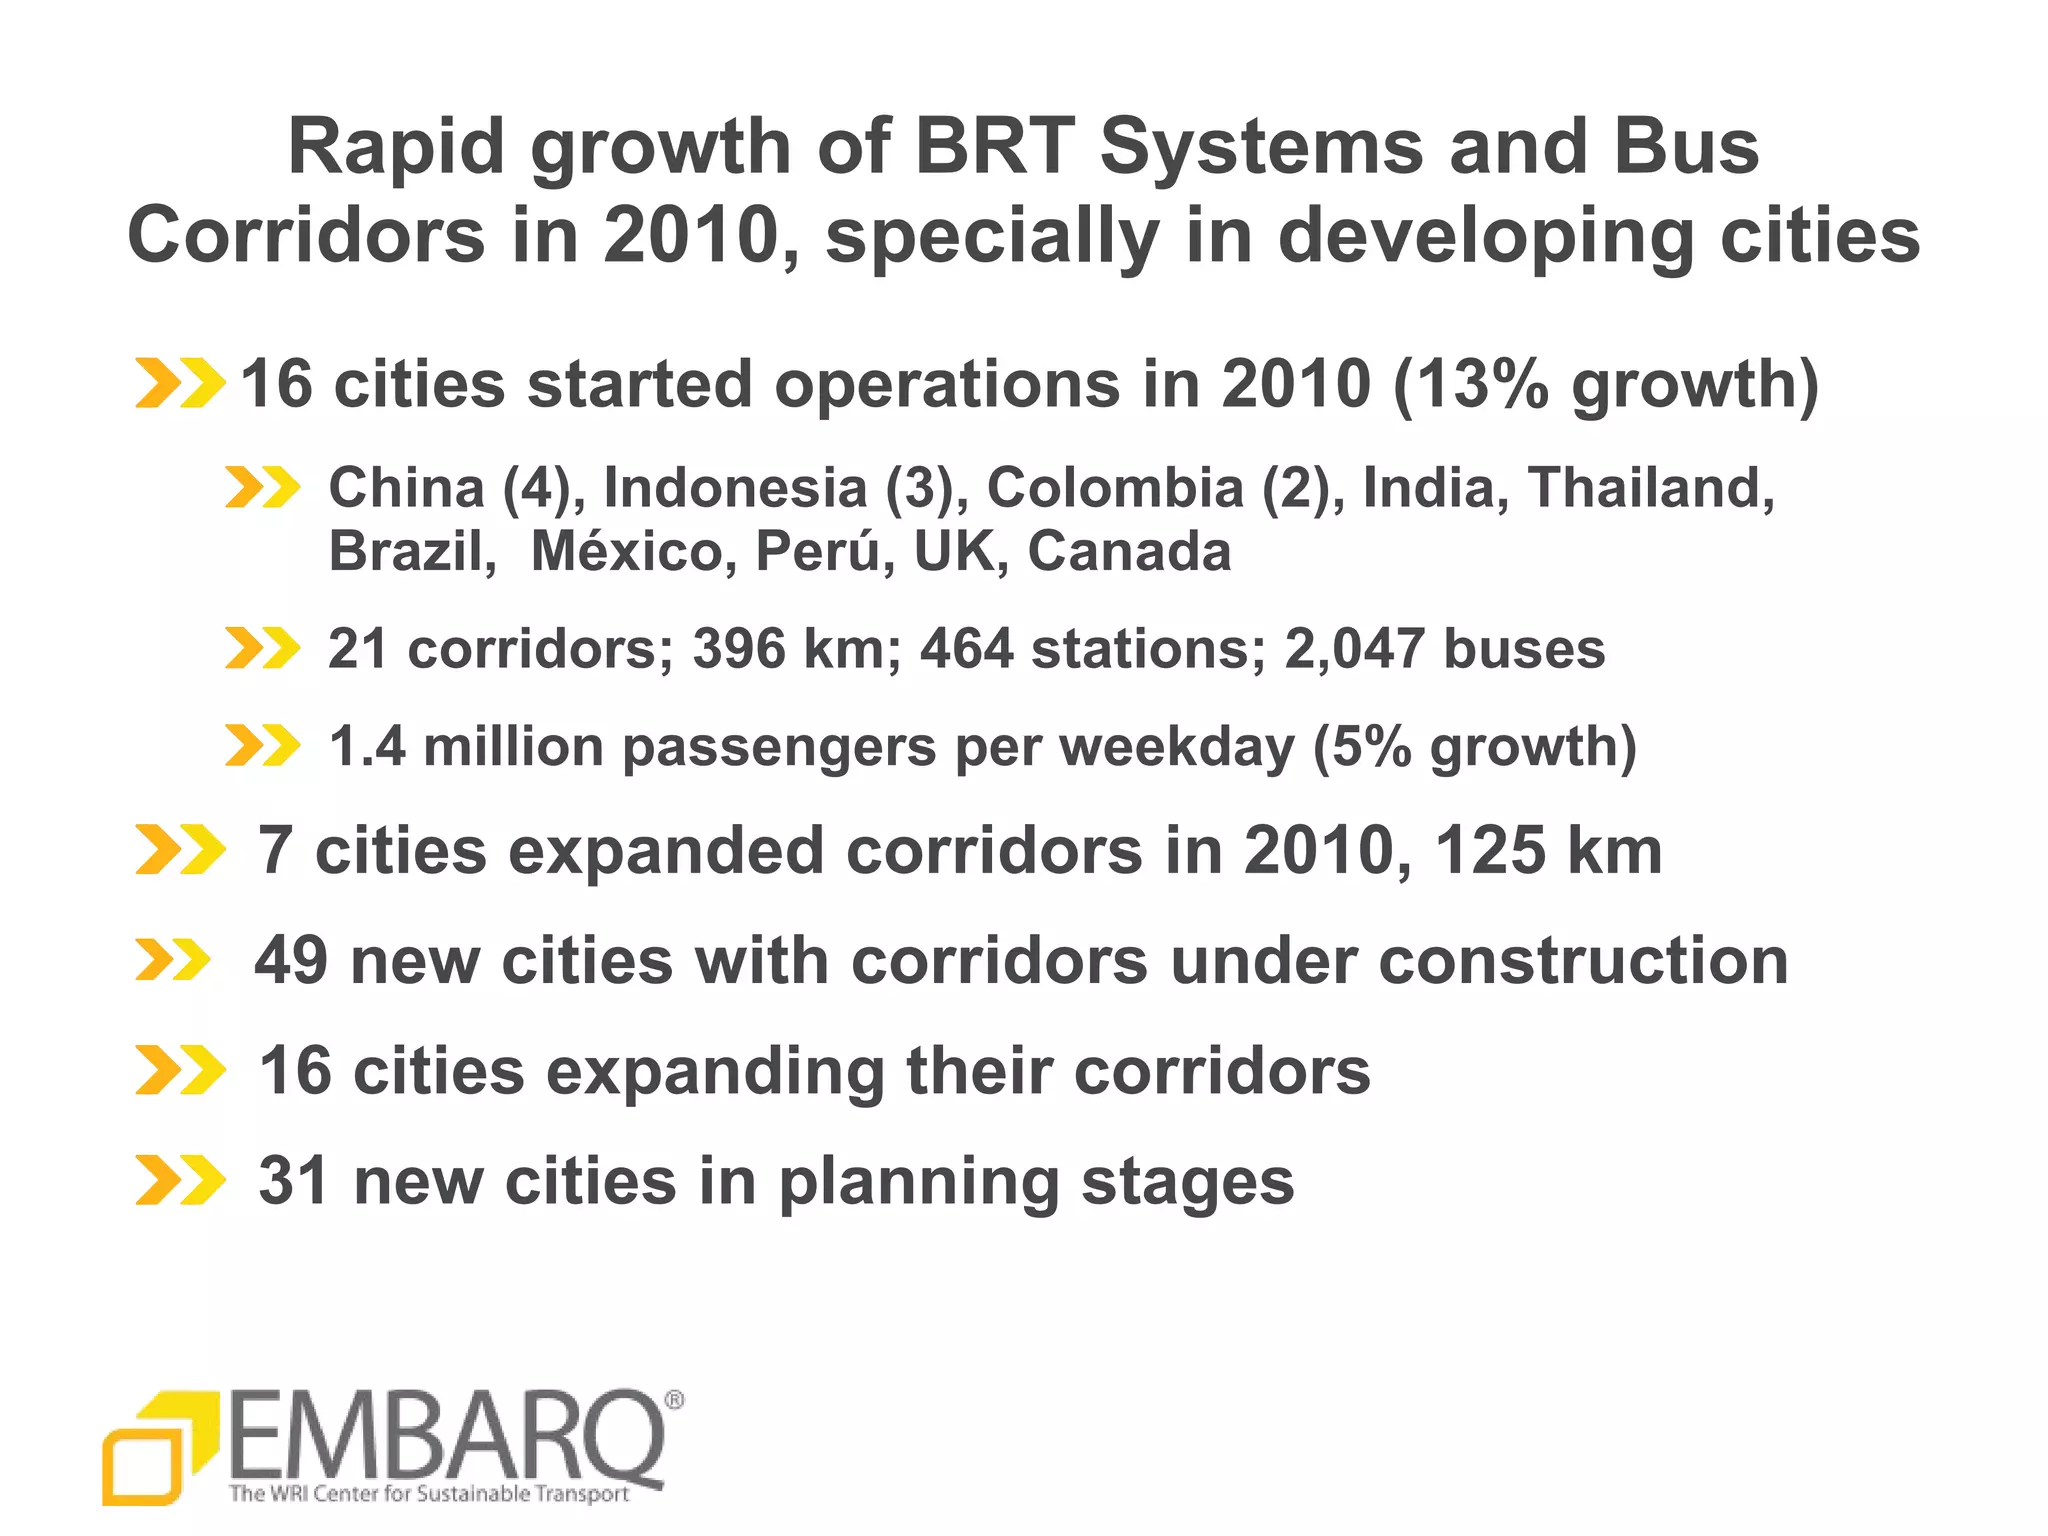


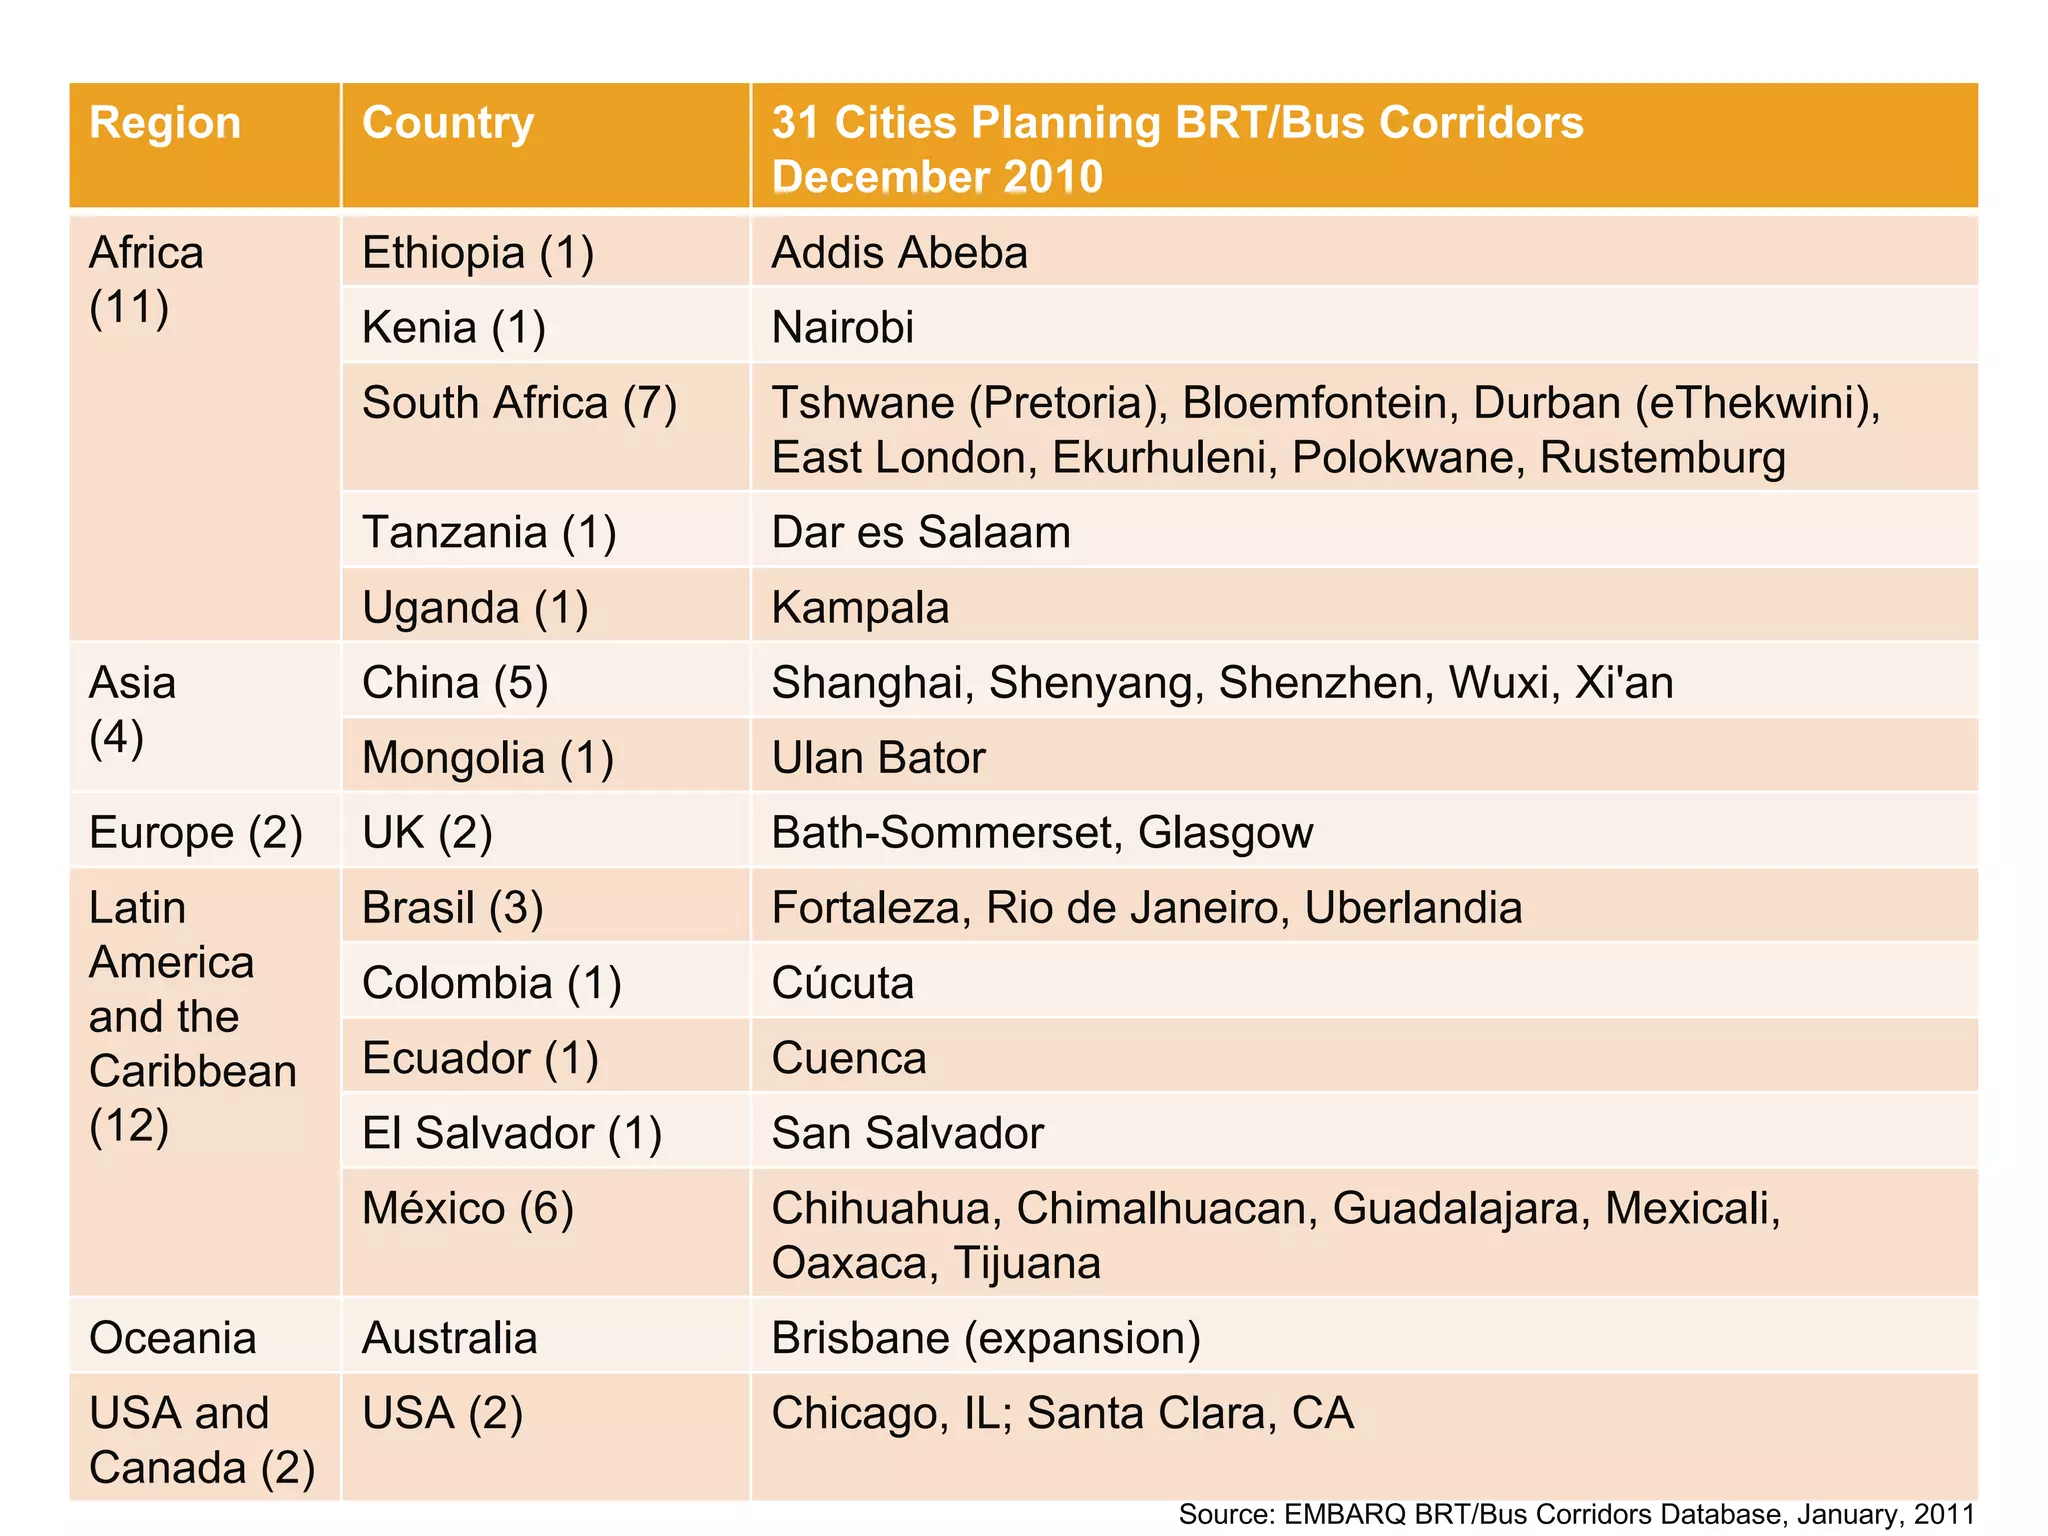

The document discusses the growth and expansion of Bus Rapid Transit (BRT) systems around the world. It notes that as of 2010, there were 120 cities with BRT systems comprising over 4,300 km of routes and over 6,600 stations serving 26.8 million passengers daily. Approximately 1/3 of the world's BRT systems by distance, stations, vehicles, and ridership are located in Latin America and the Caribbean. The document outlines several successful BRT systems in Latin America and notes many cities that have recently launched, expanded, or are planning BRT corridors.


