Download to read offline


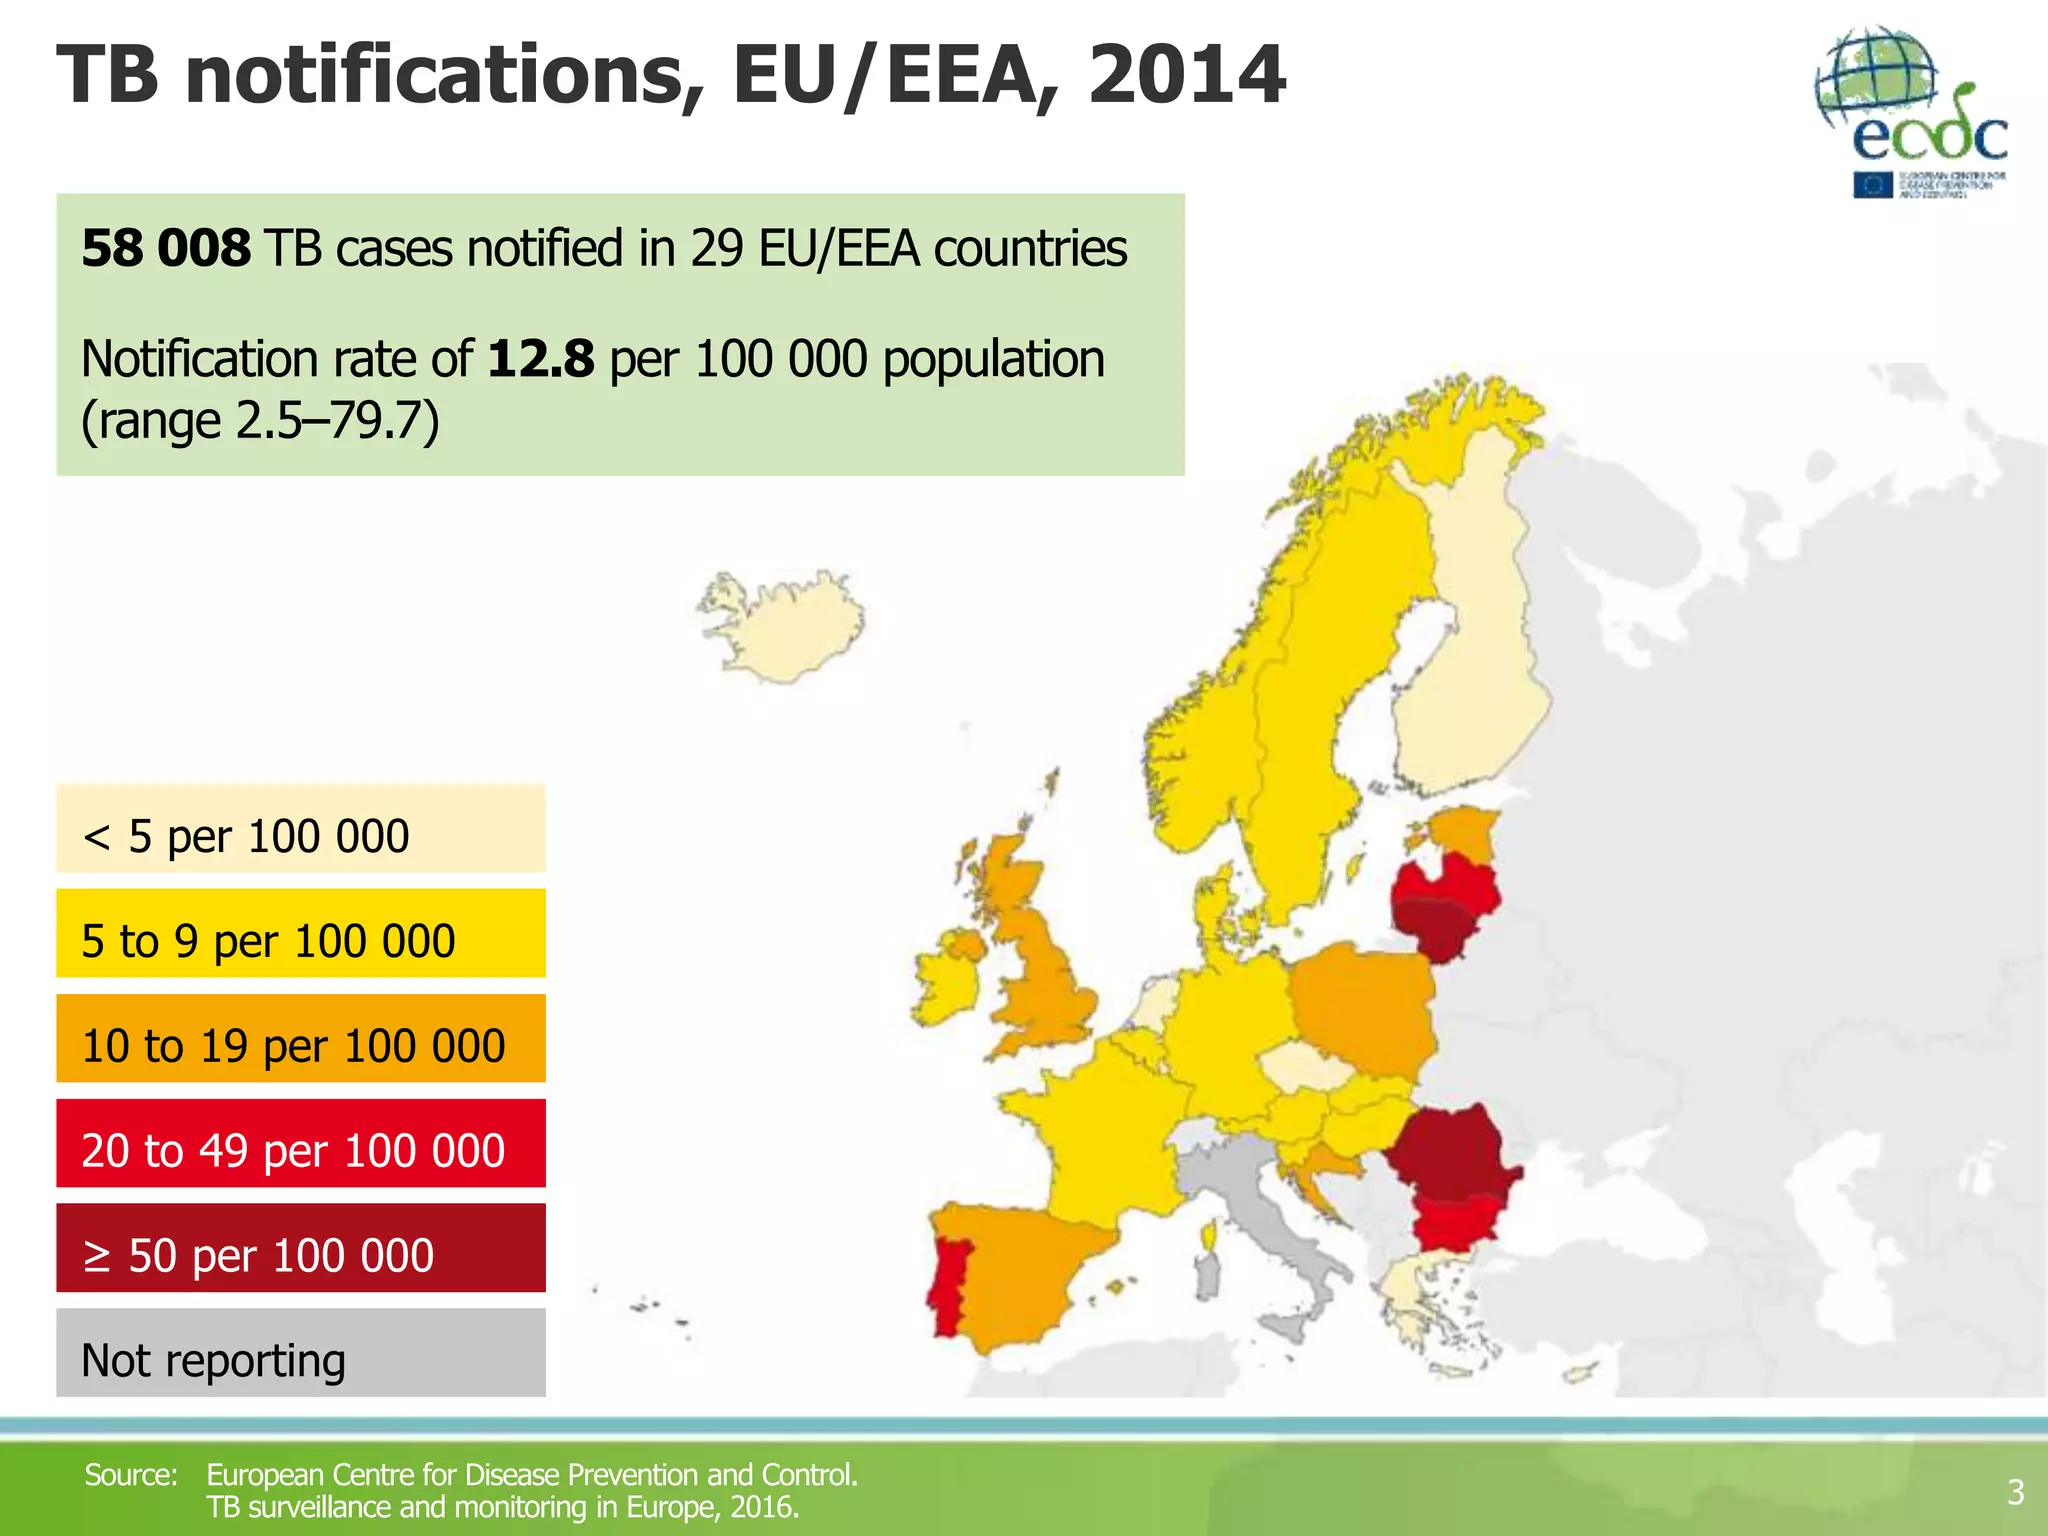

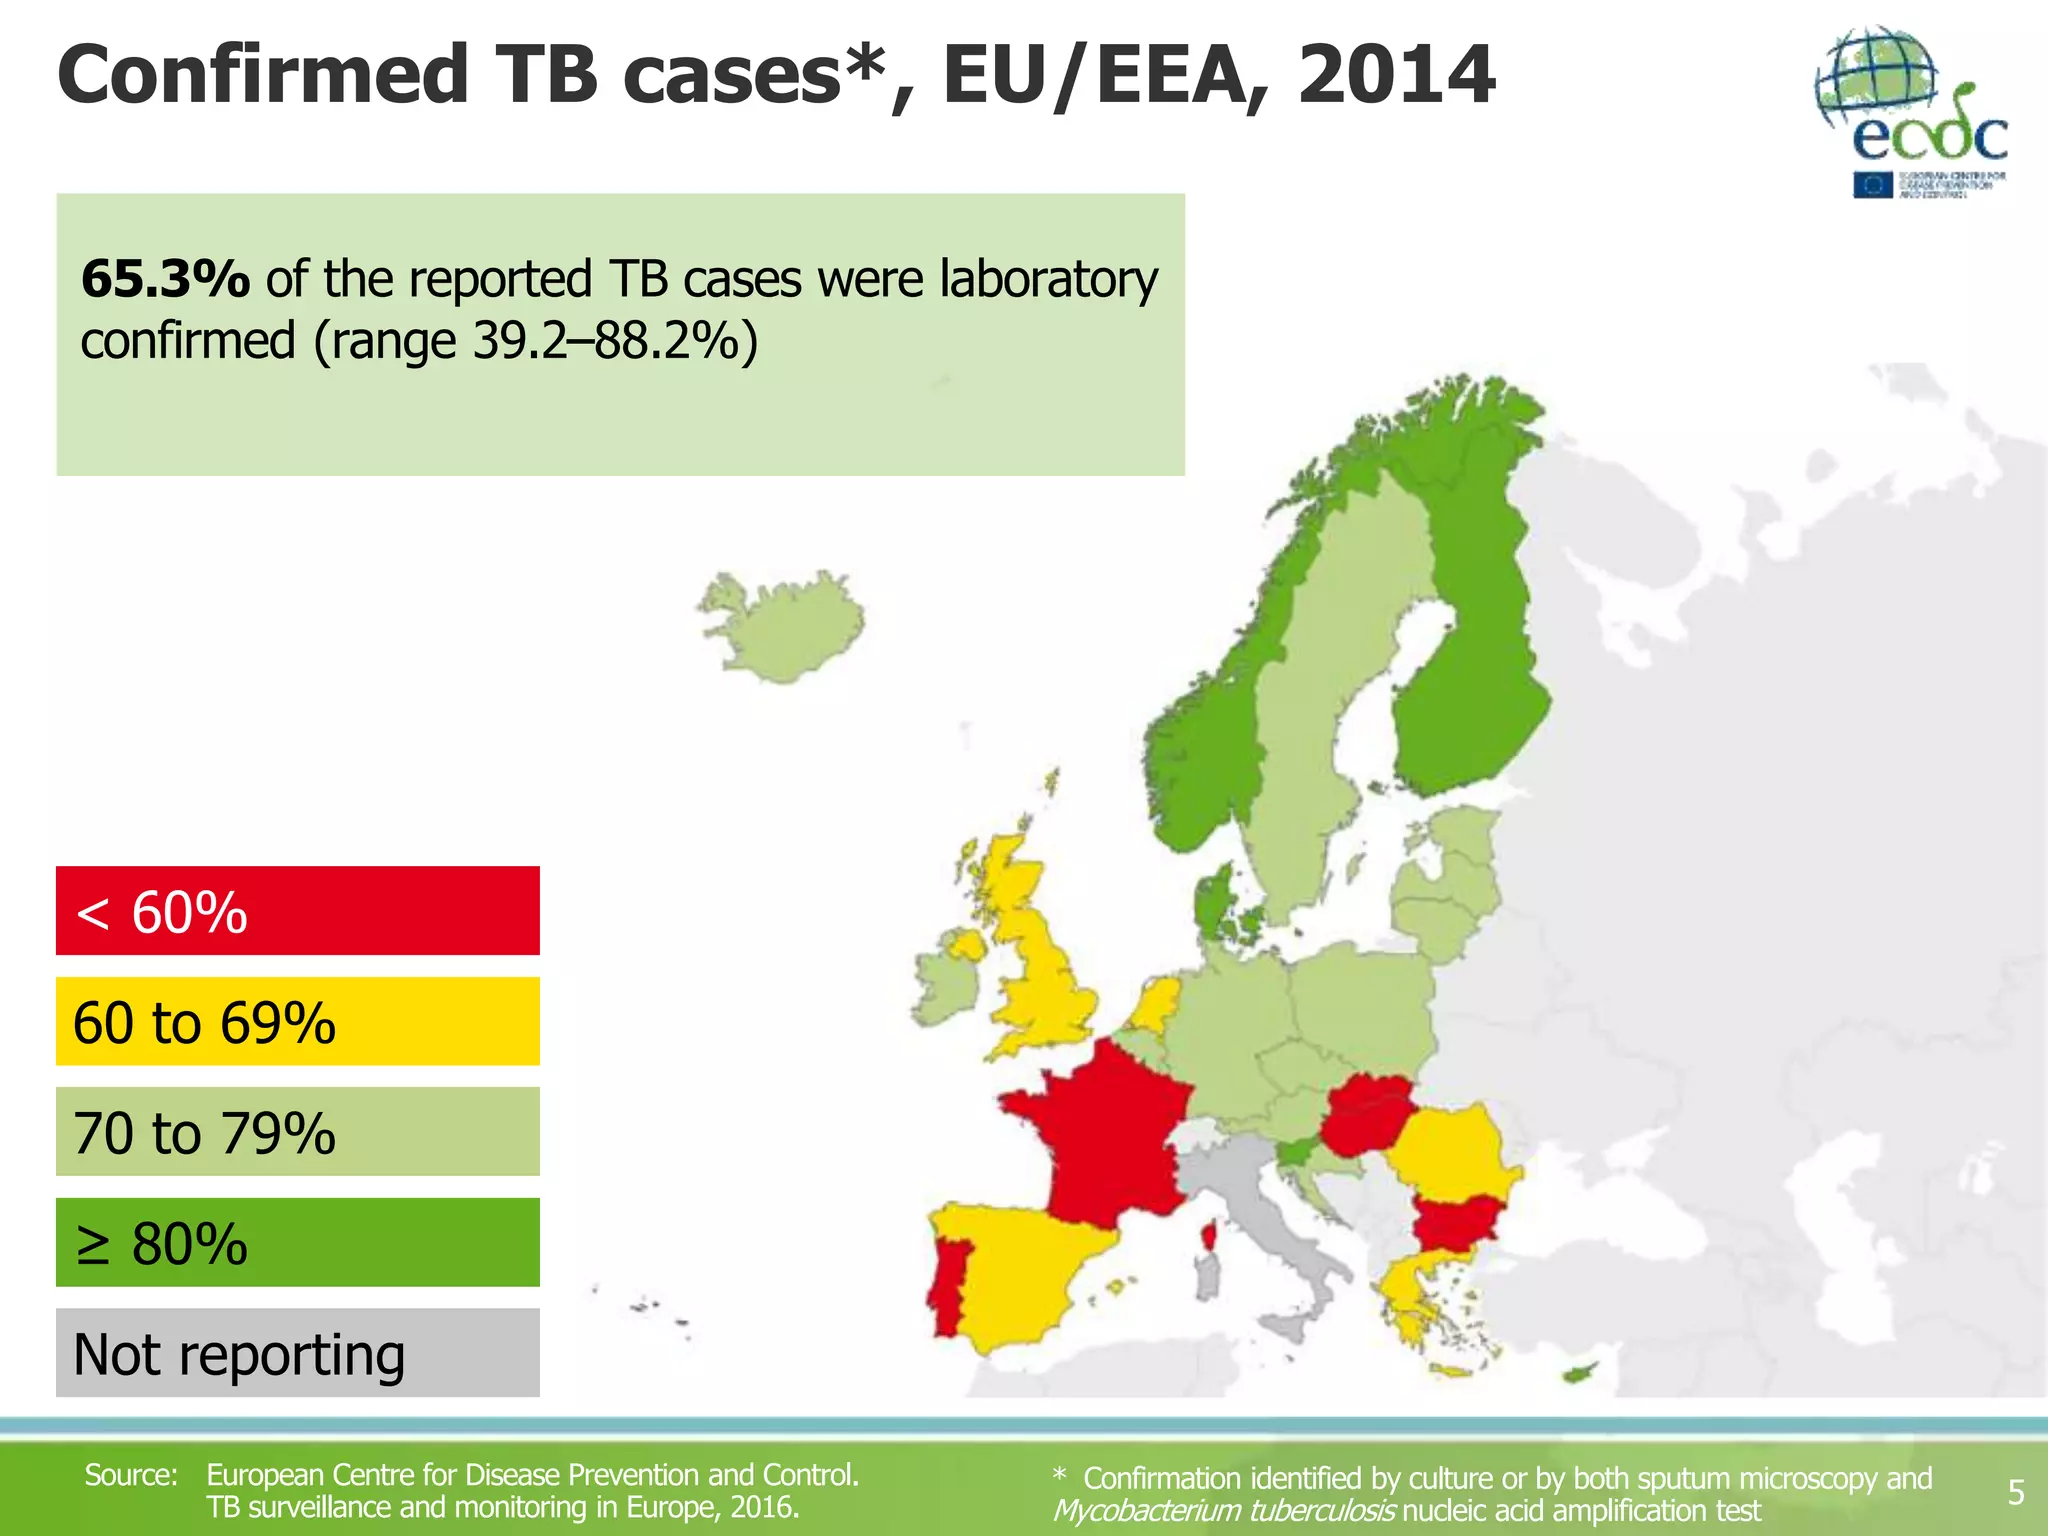


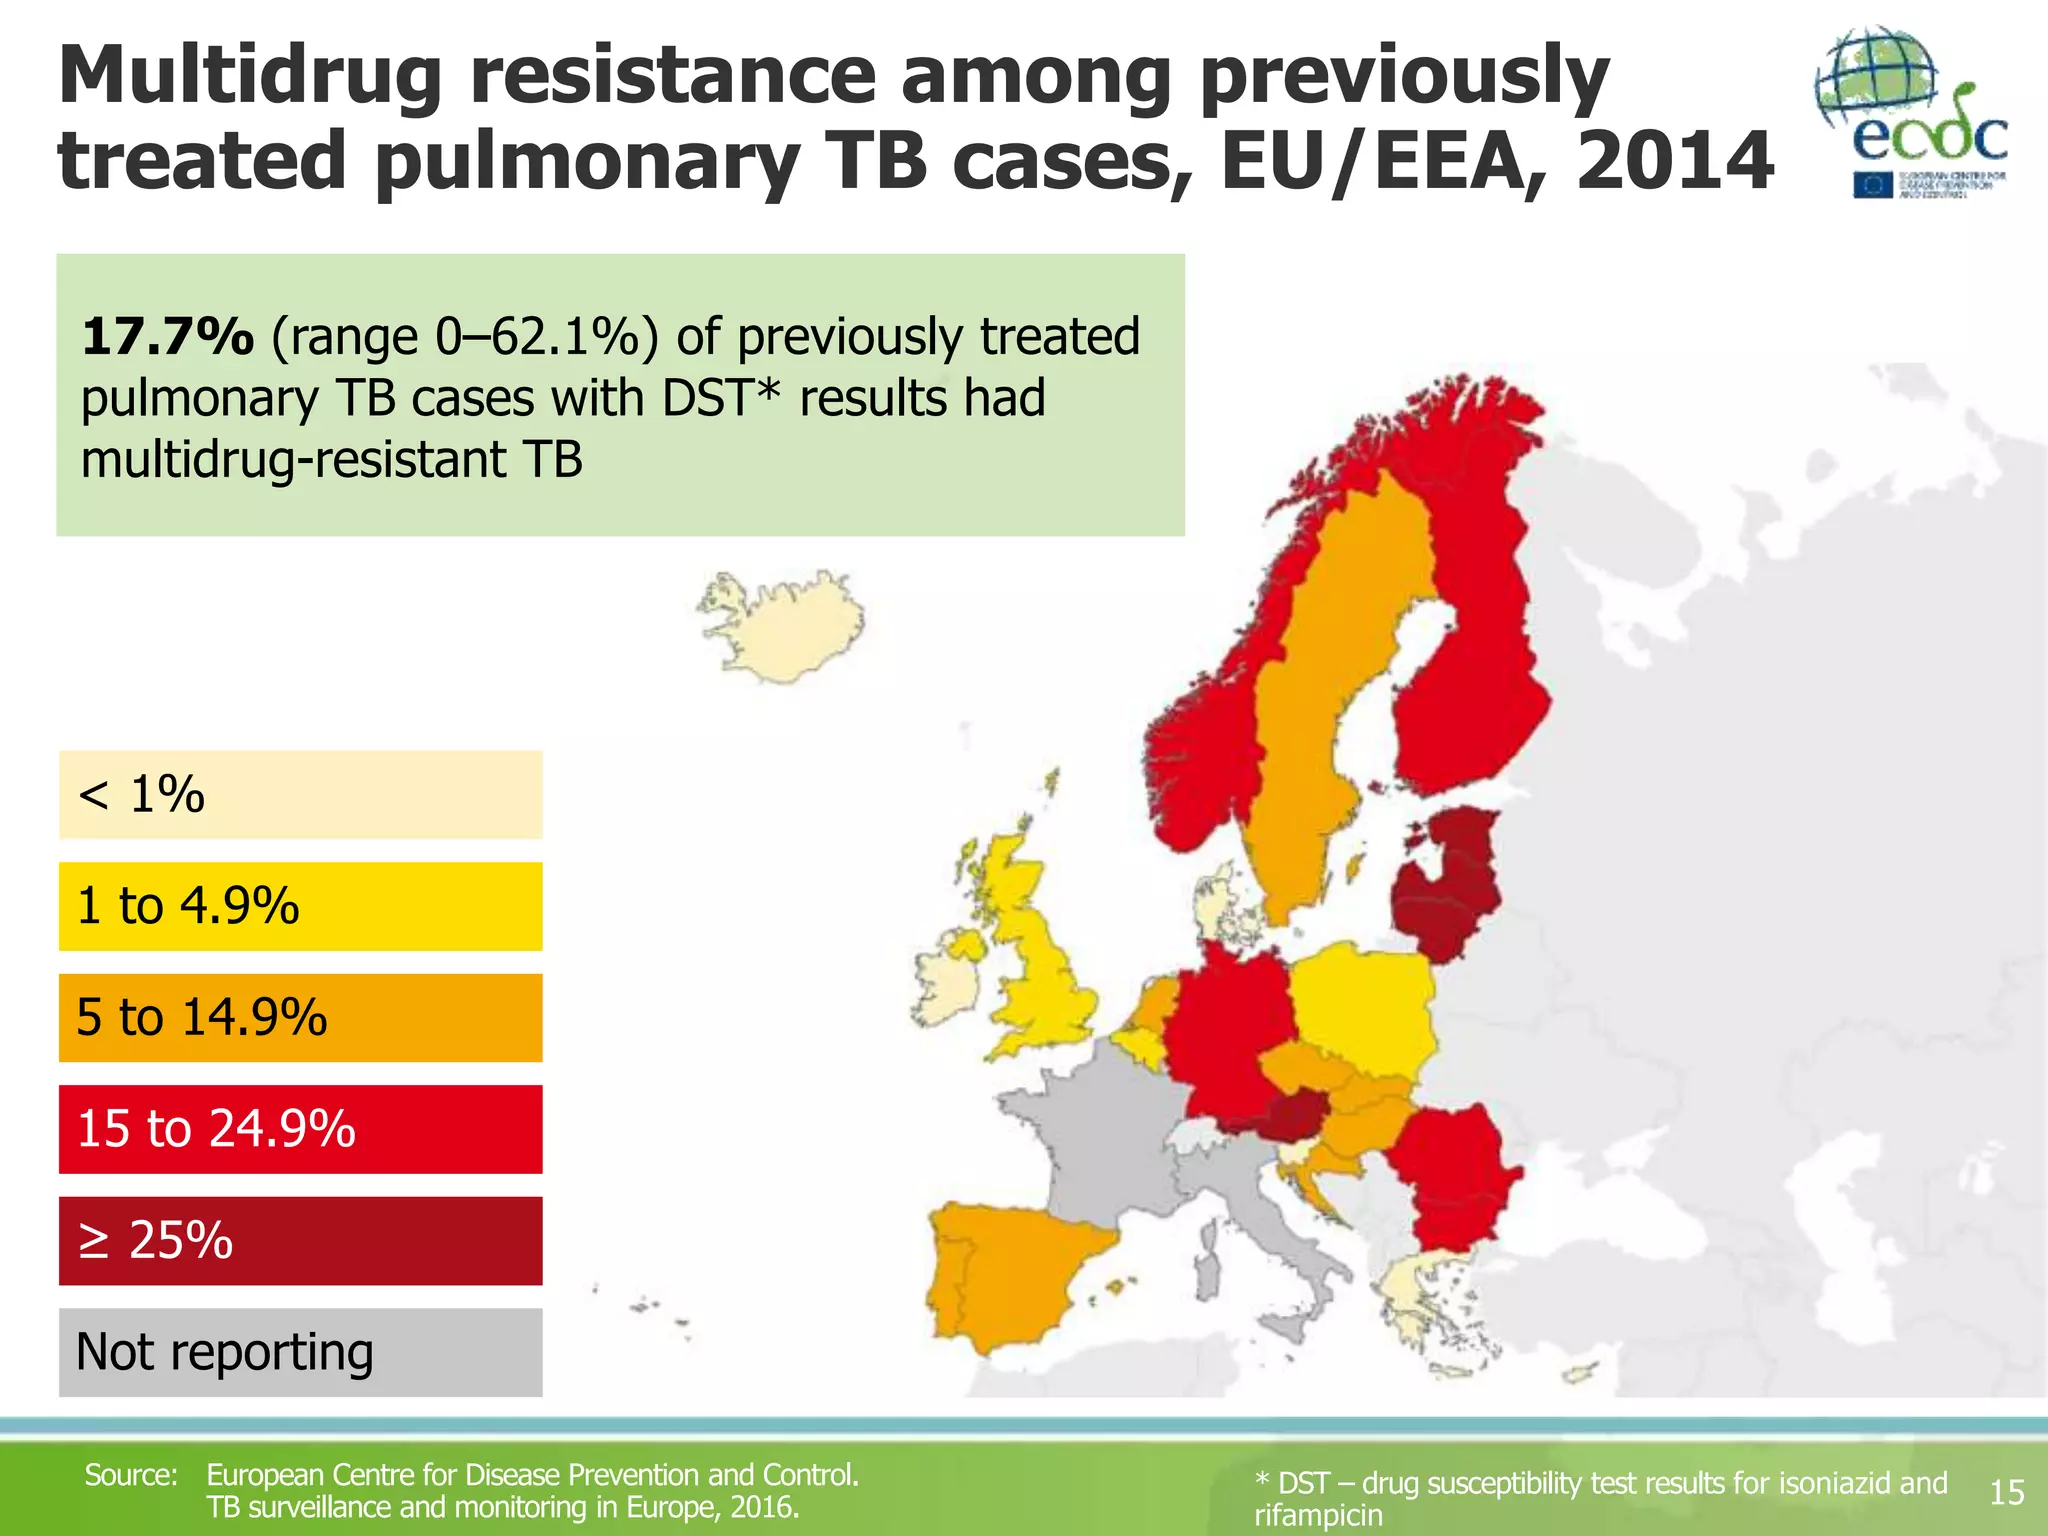


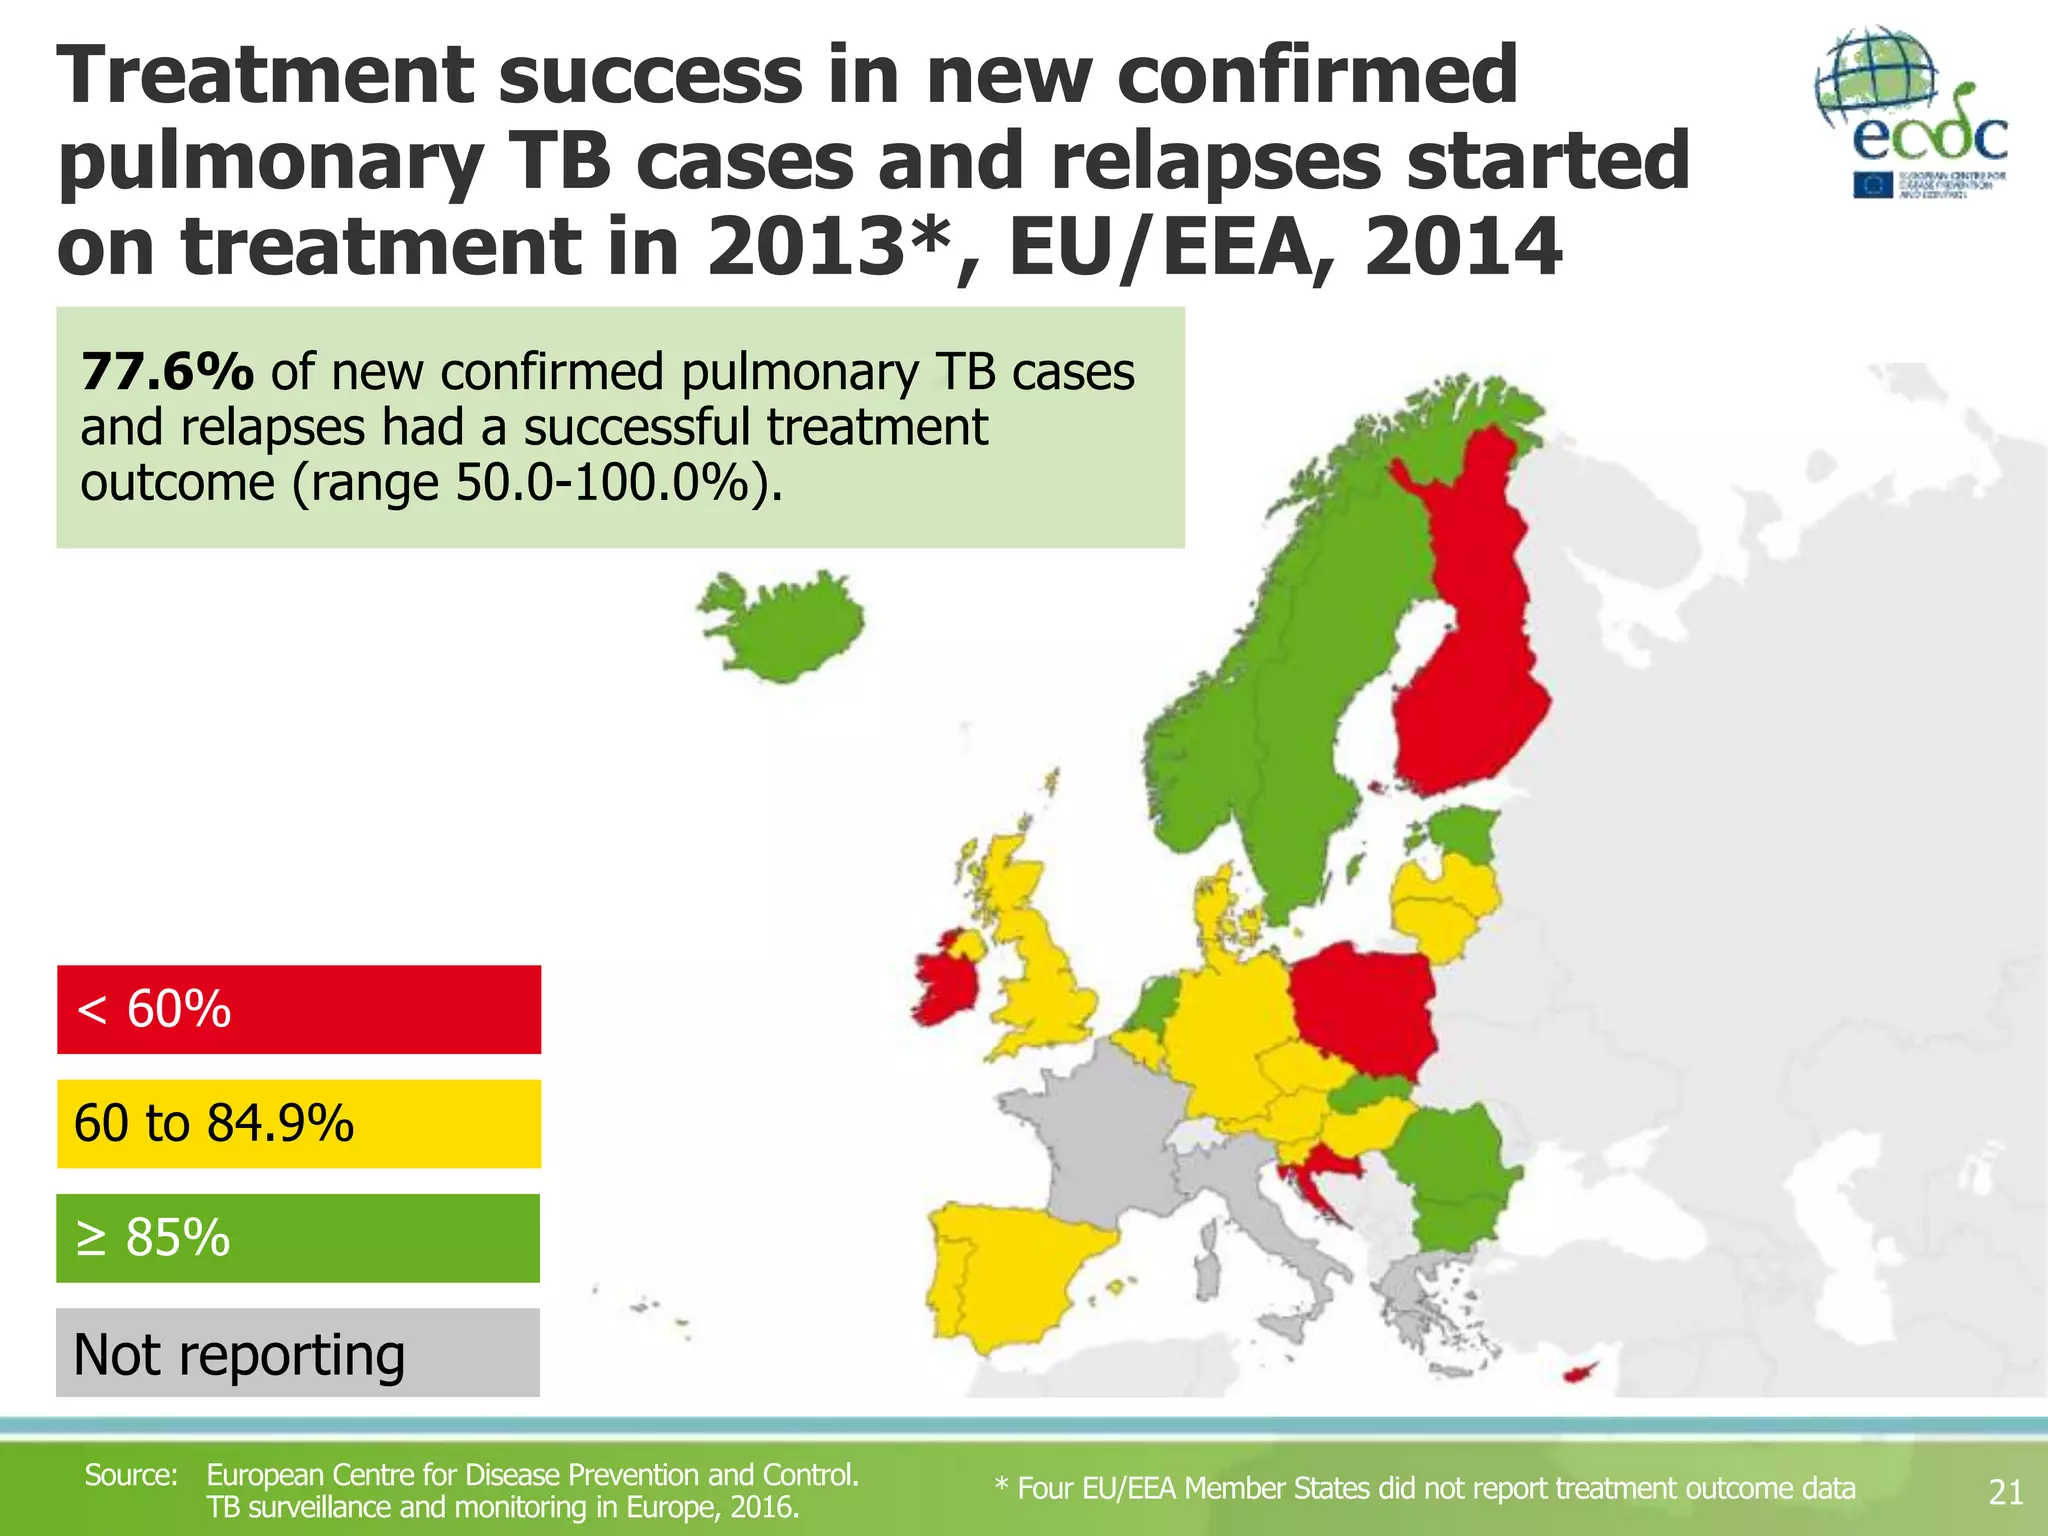


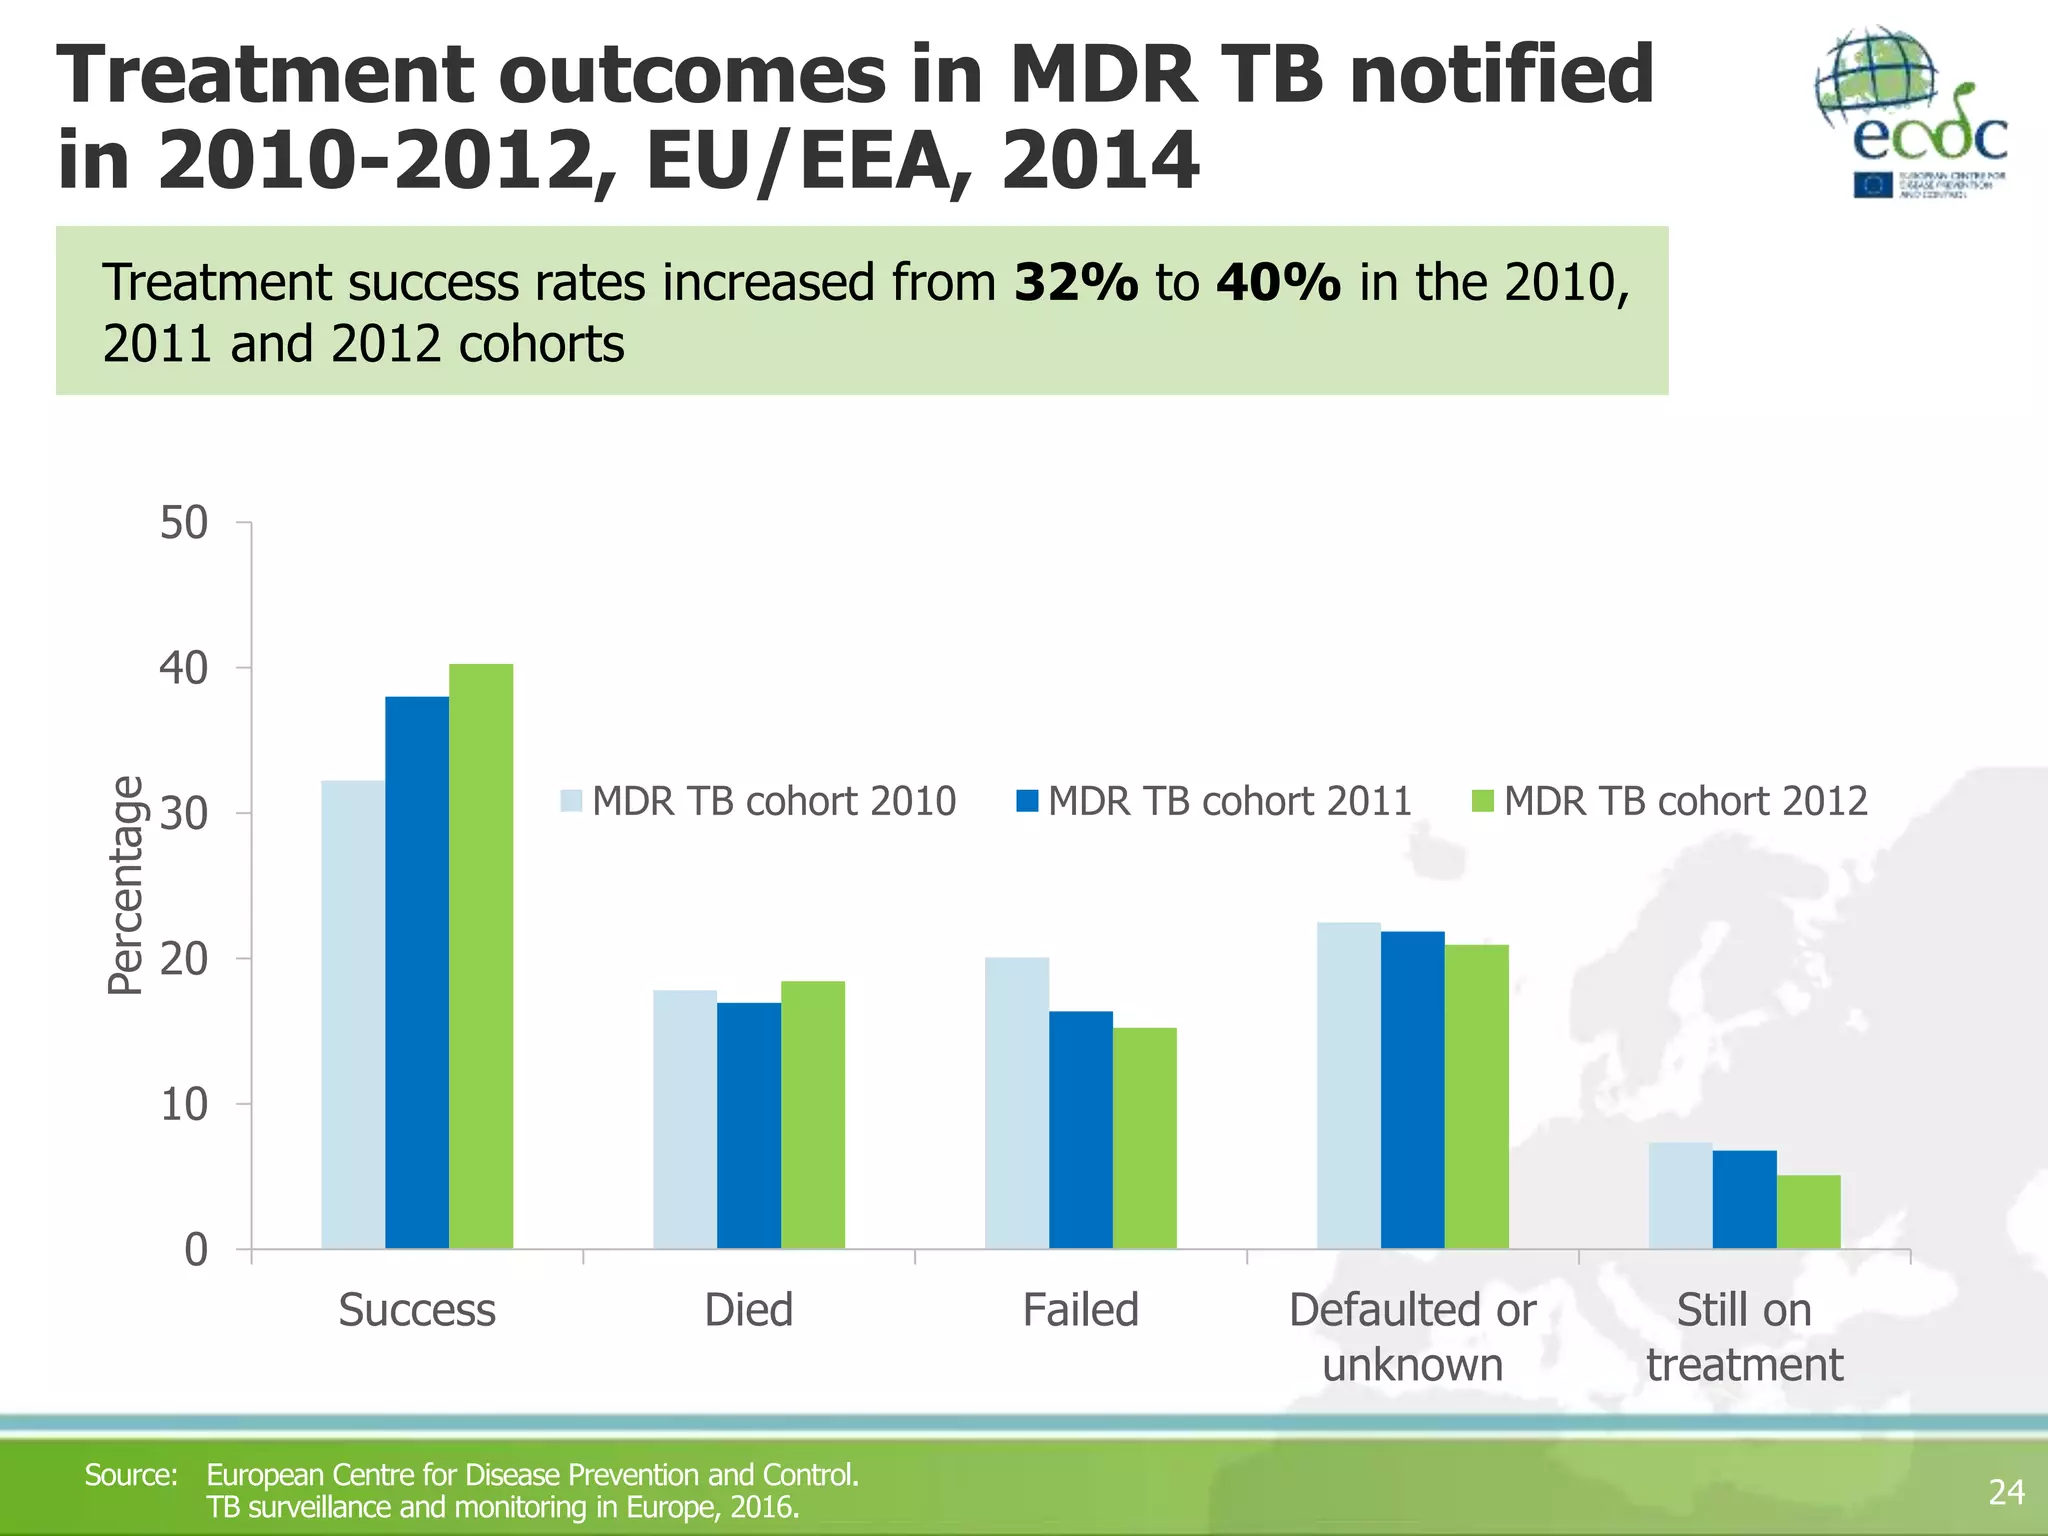

In 2014, there were 58,008 notified tuberculosis cases in 29 EU/EEA countries, marking a 35% decrease in the number of cases and a 36% decrease in the notification rate from 2005 to 2014. Approximately 65.3% of cases were laboratory confirmed, and 74% of all cases had a successful treatment outcome after 12 months. Multidrug-resistant TB cases represented 4% of tested cases, with a treatment success rate of 40.3% for multidrug-resistant cases notified in 2012.