Download to read offline
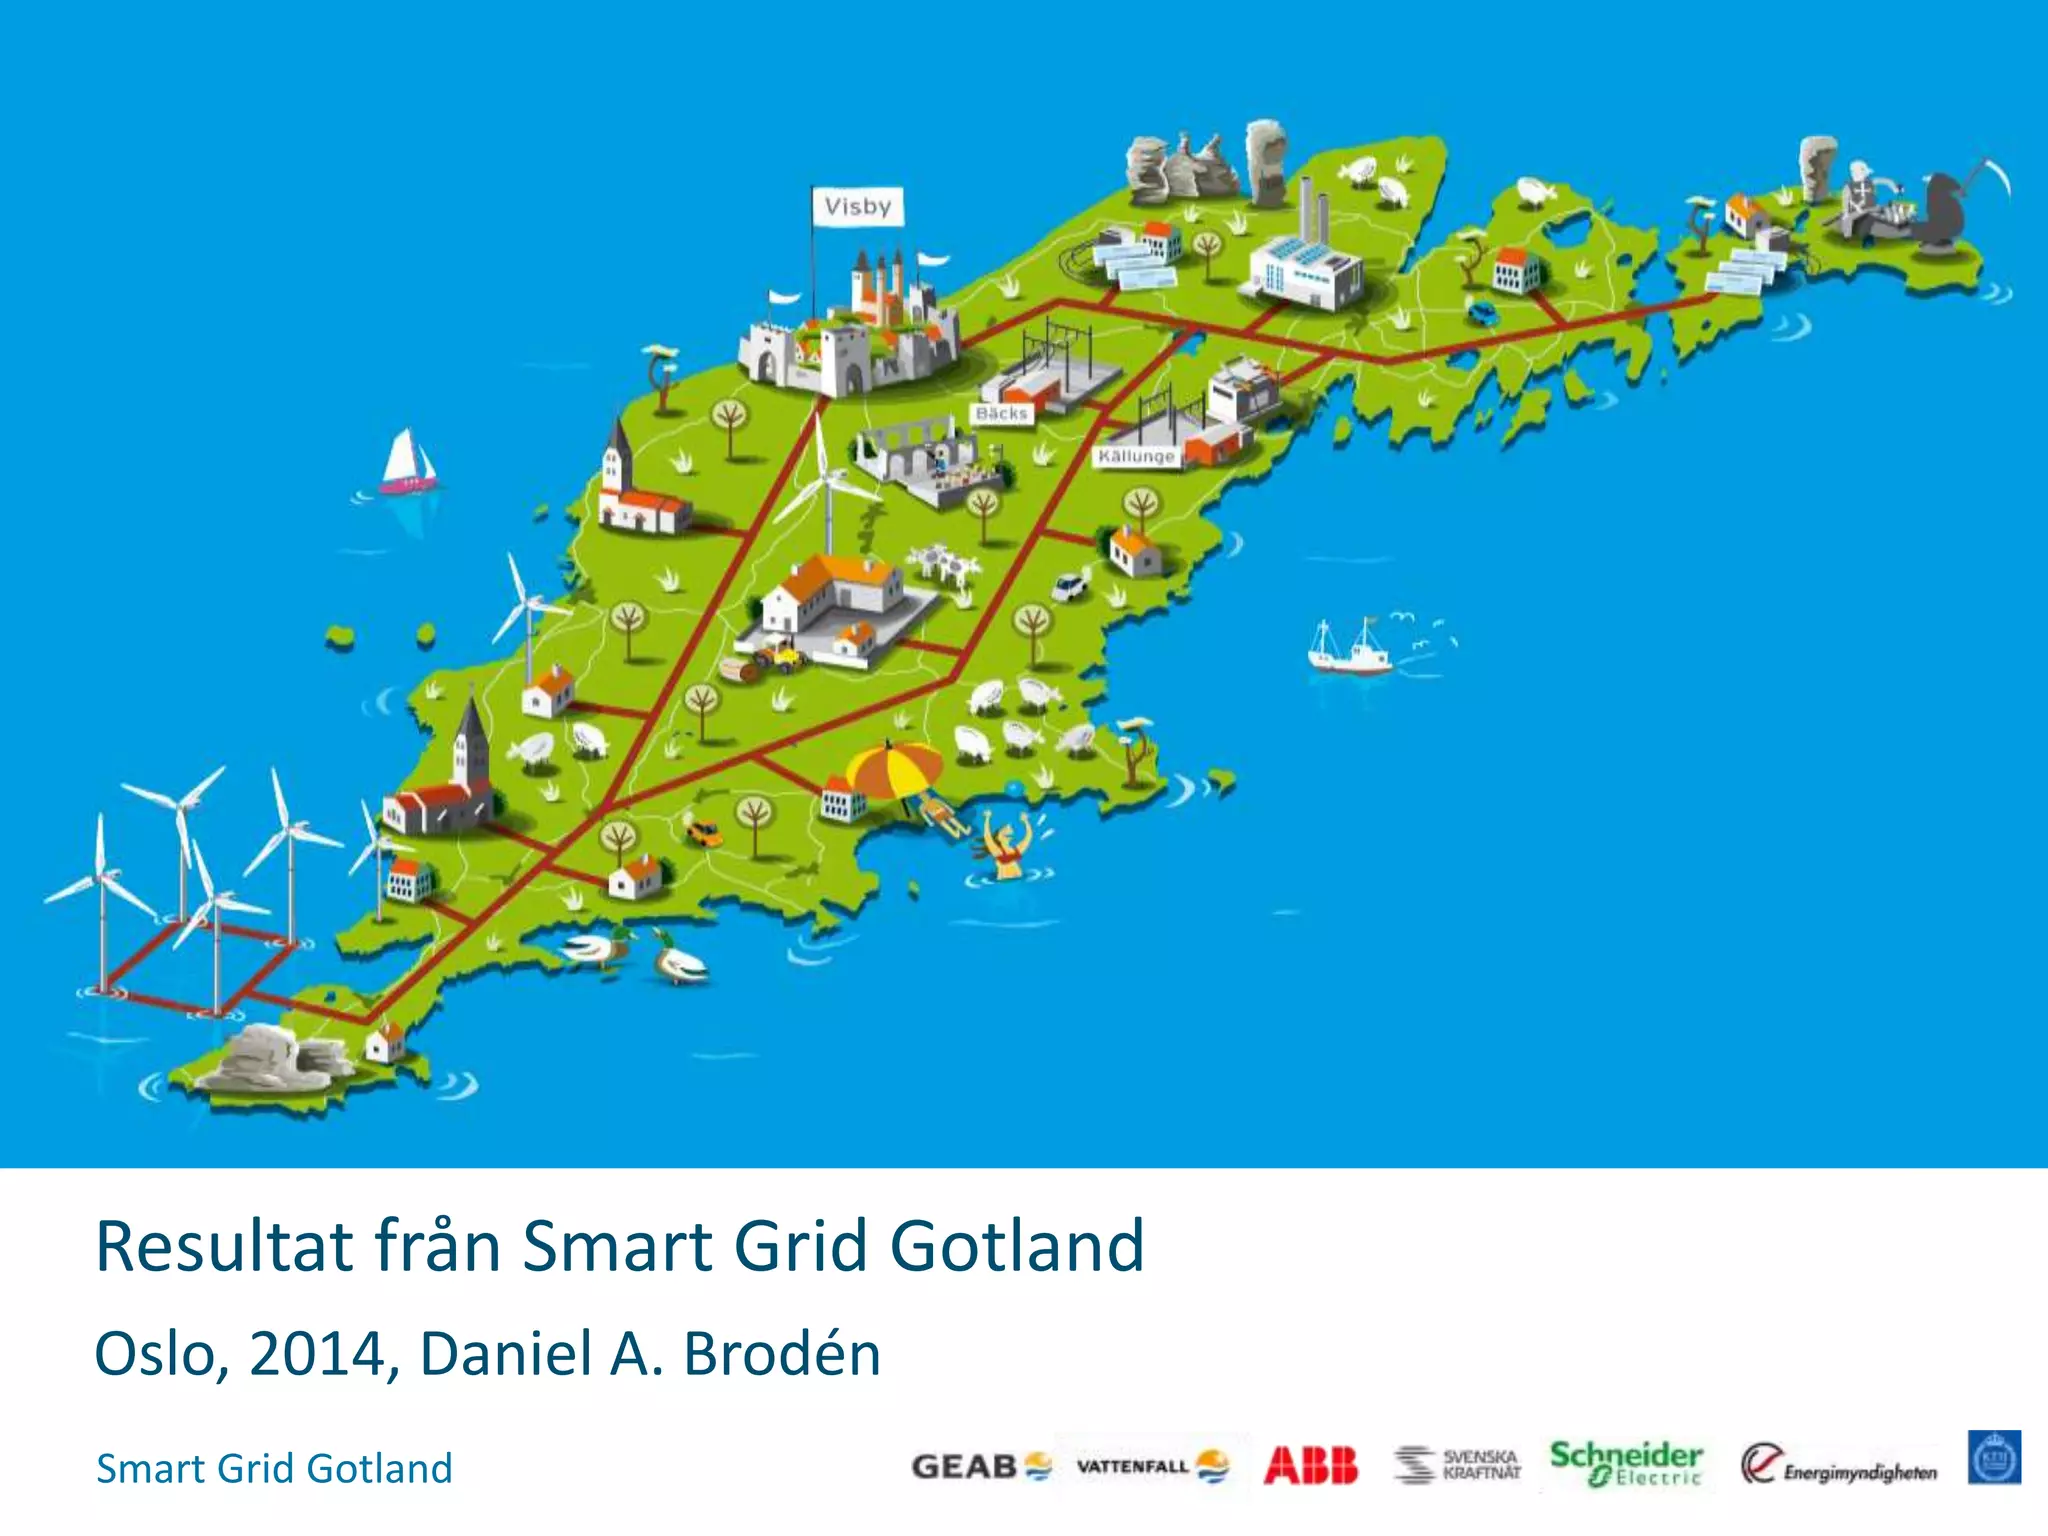
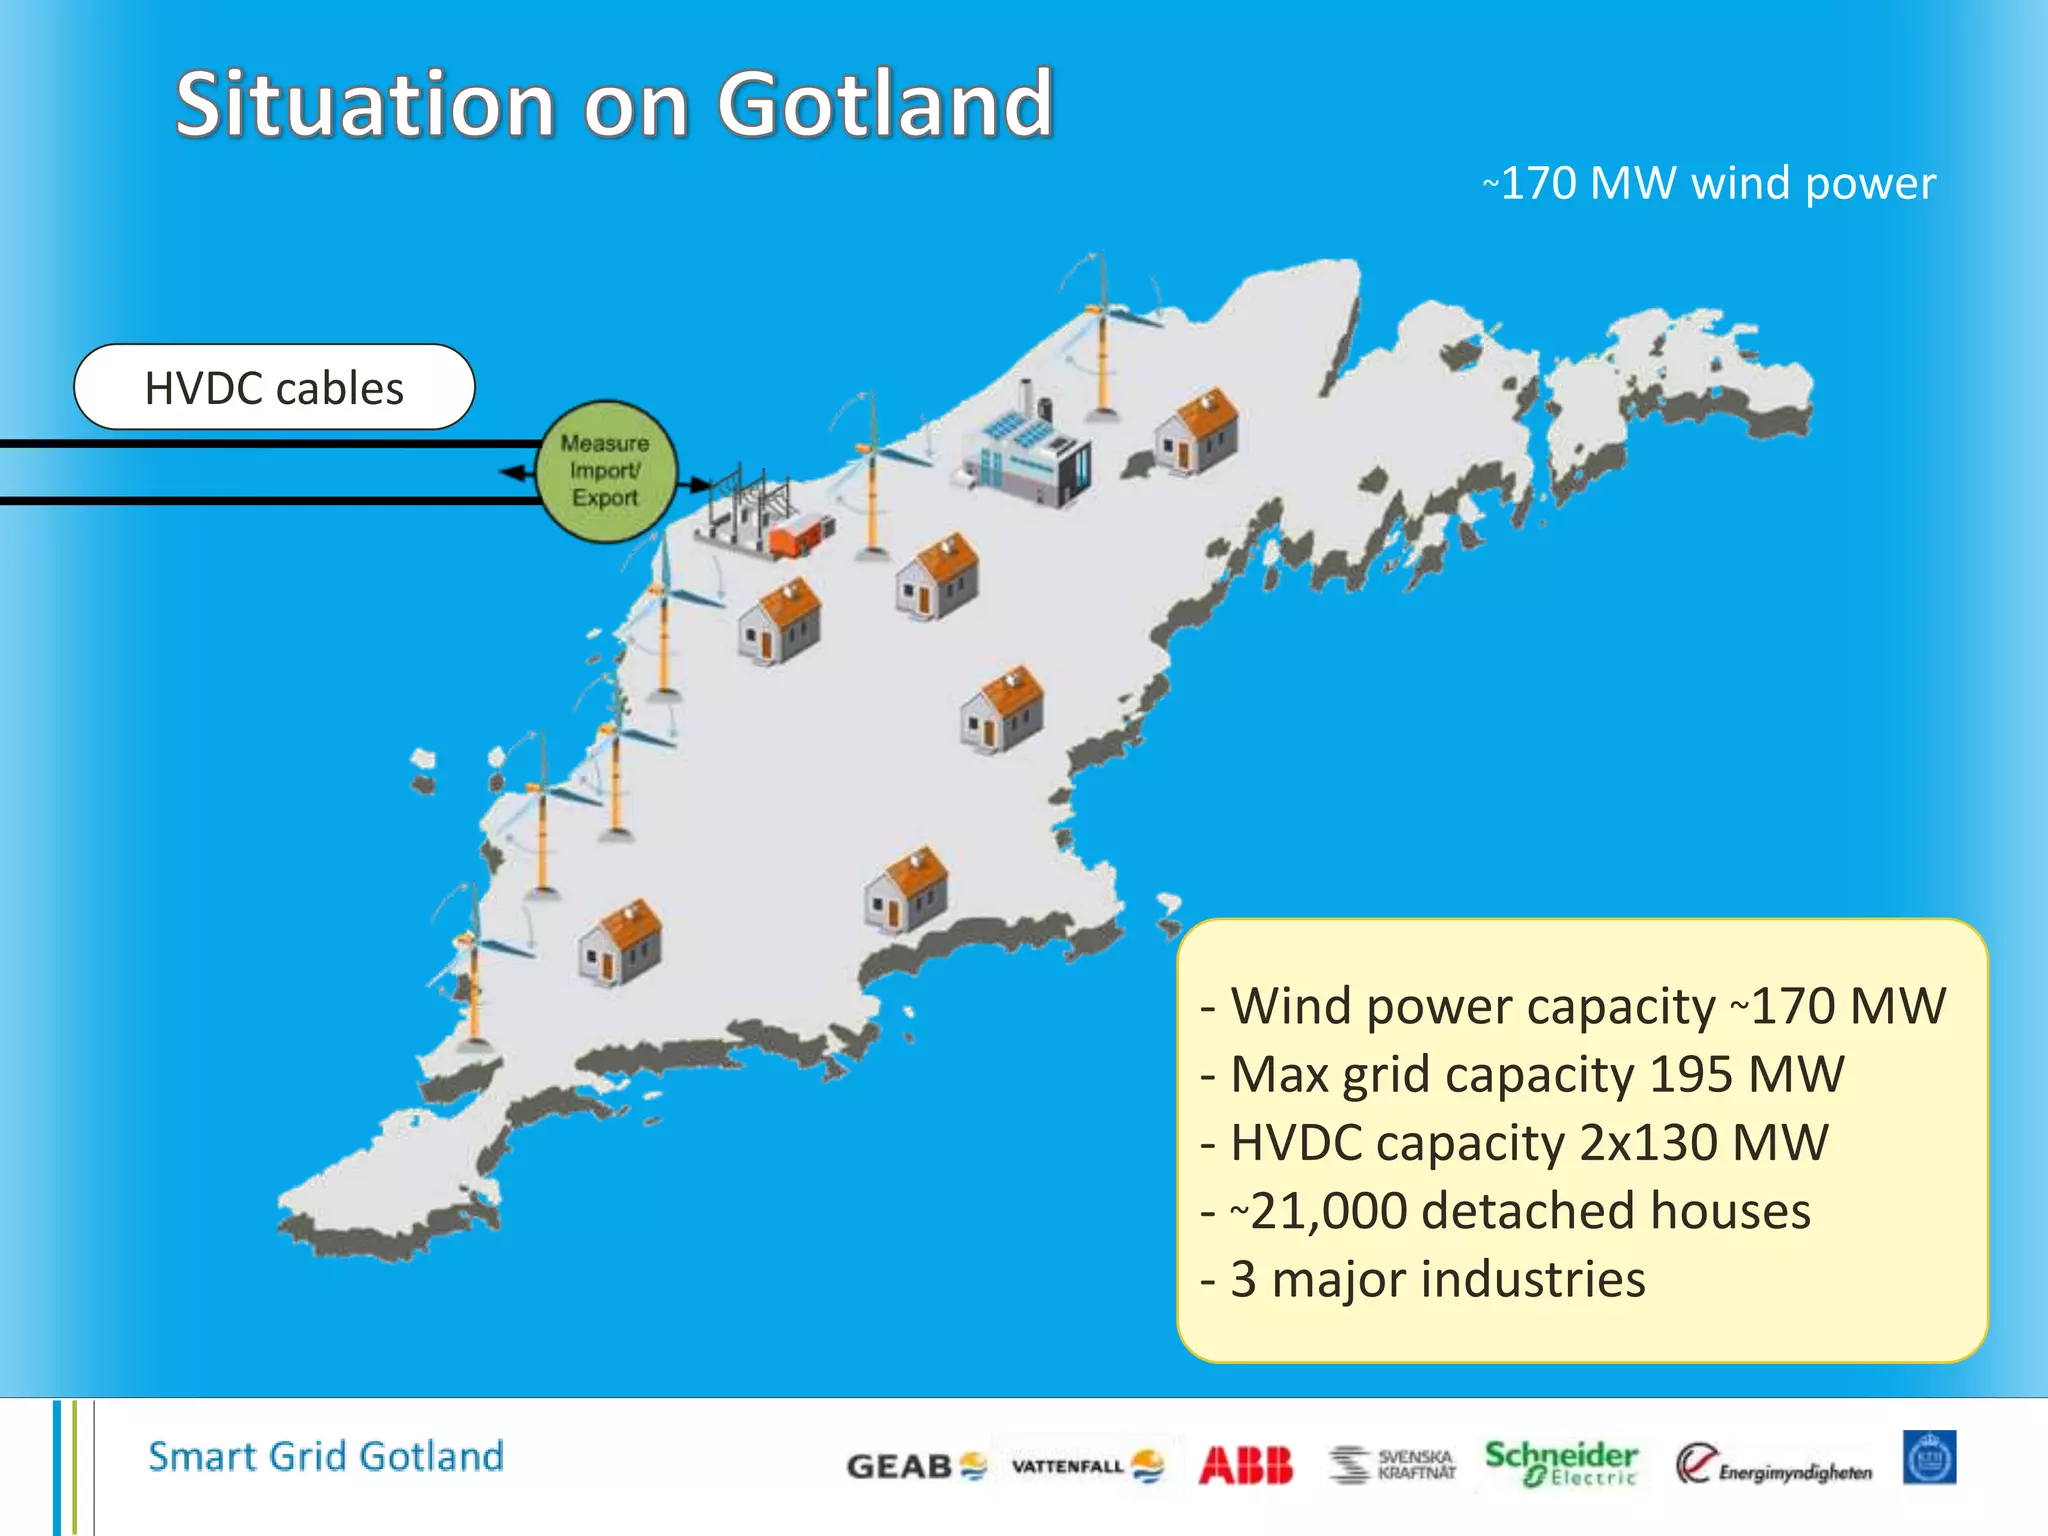
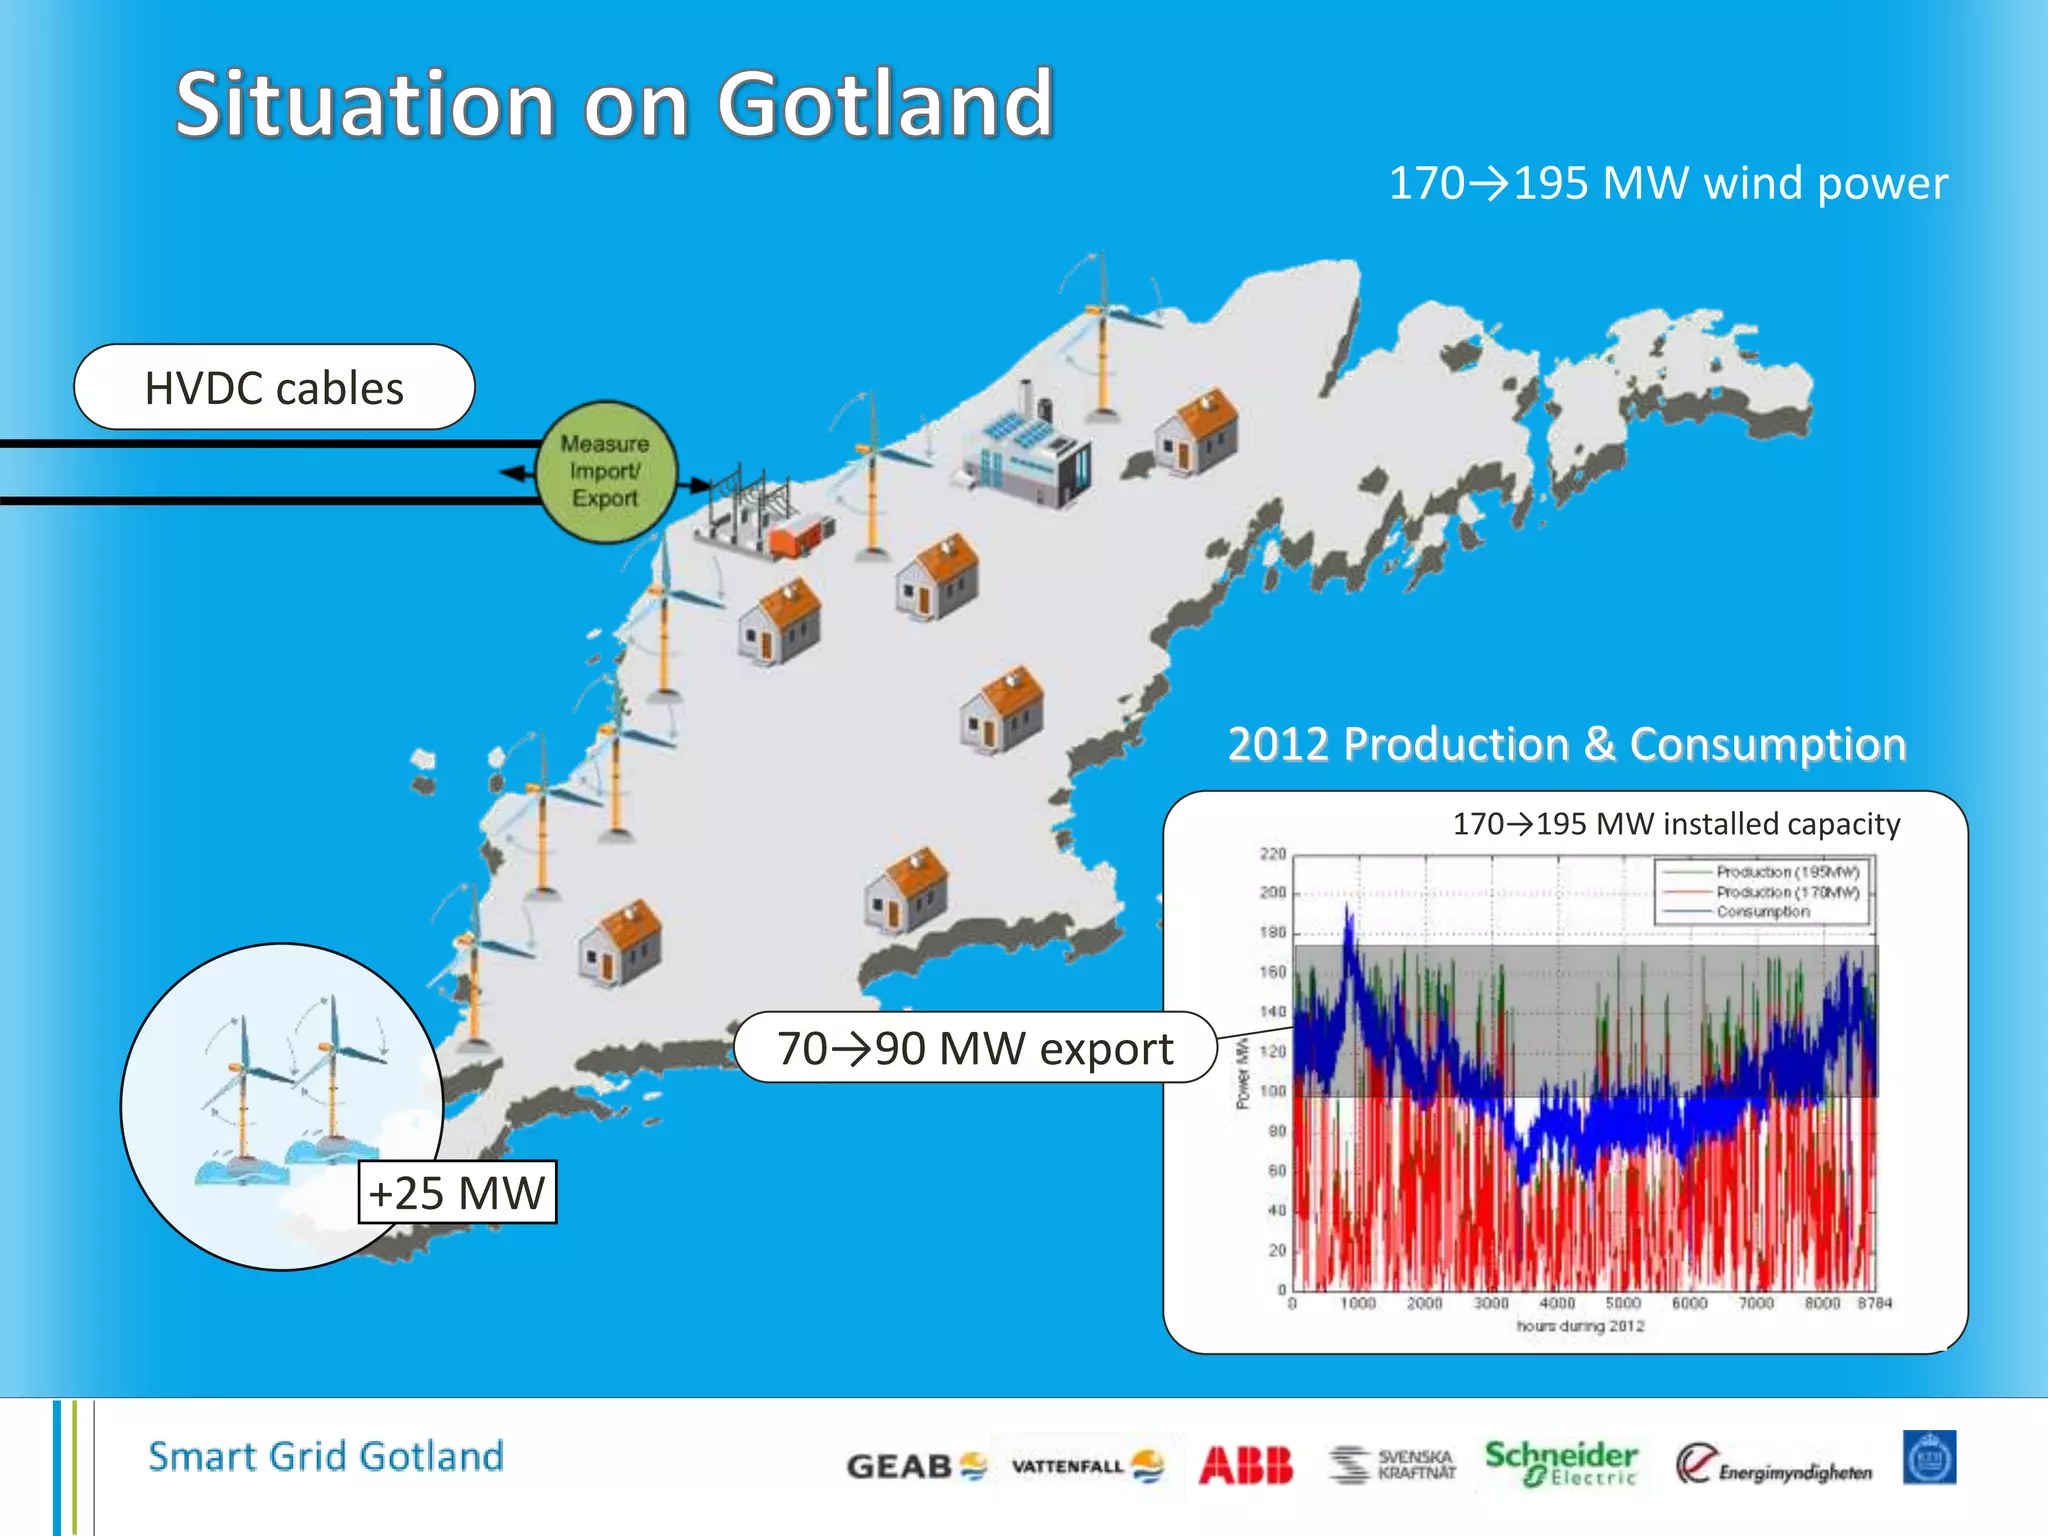
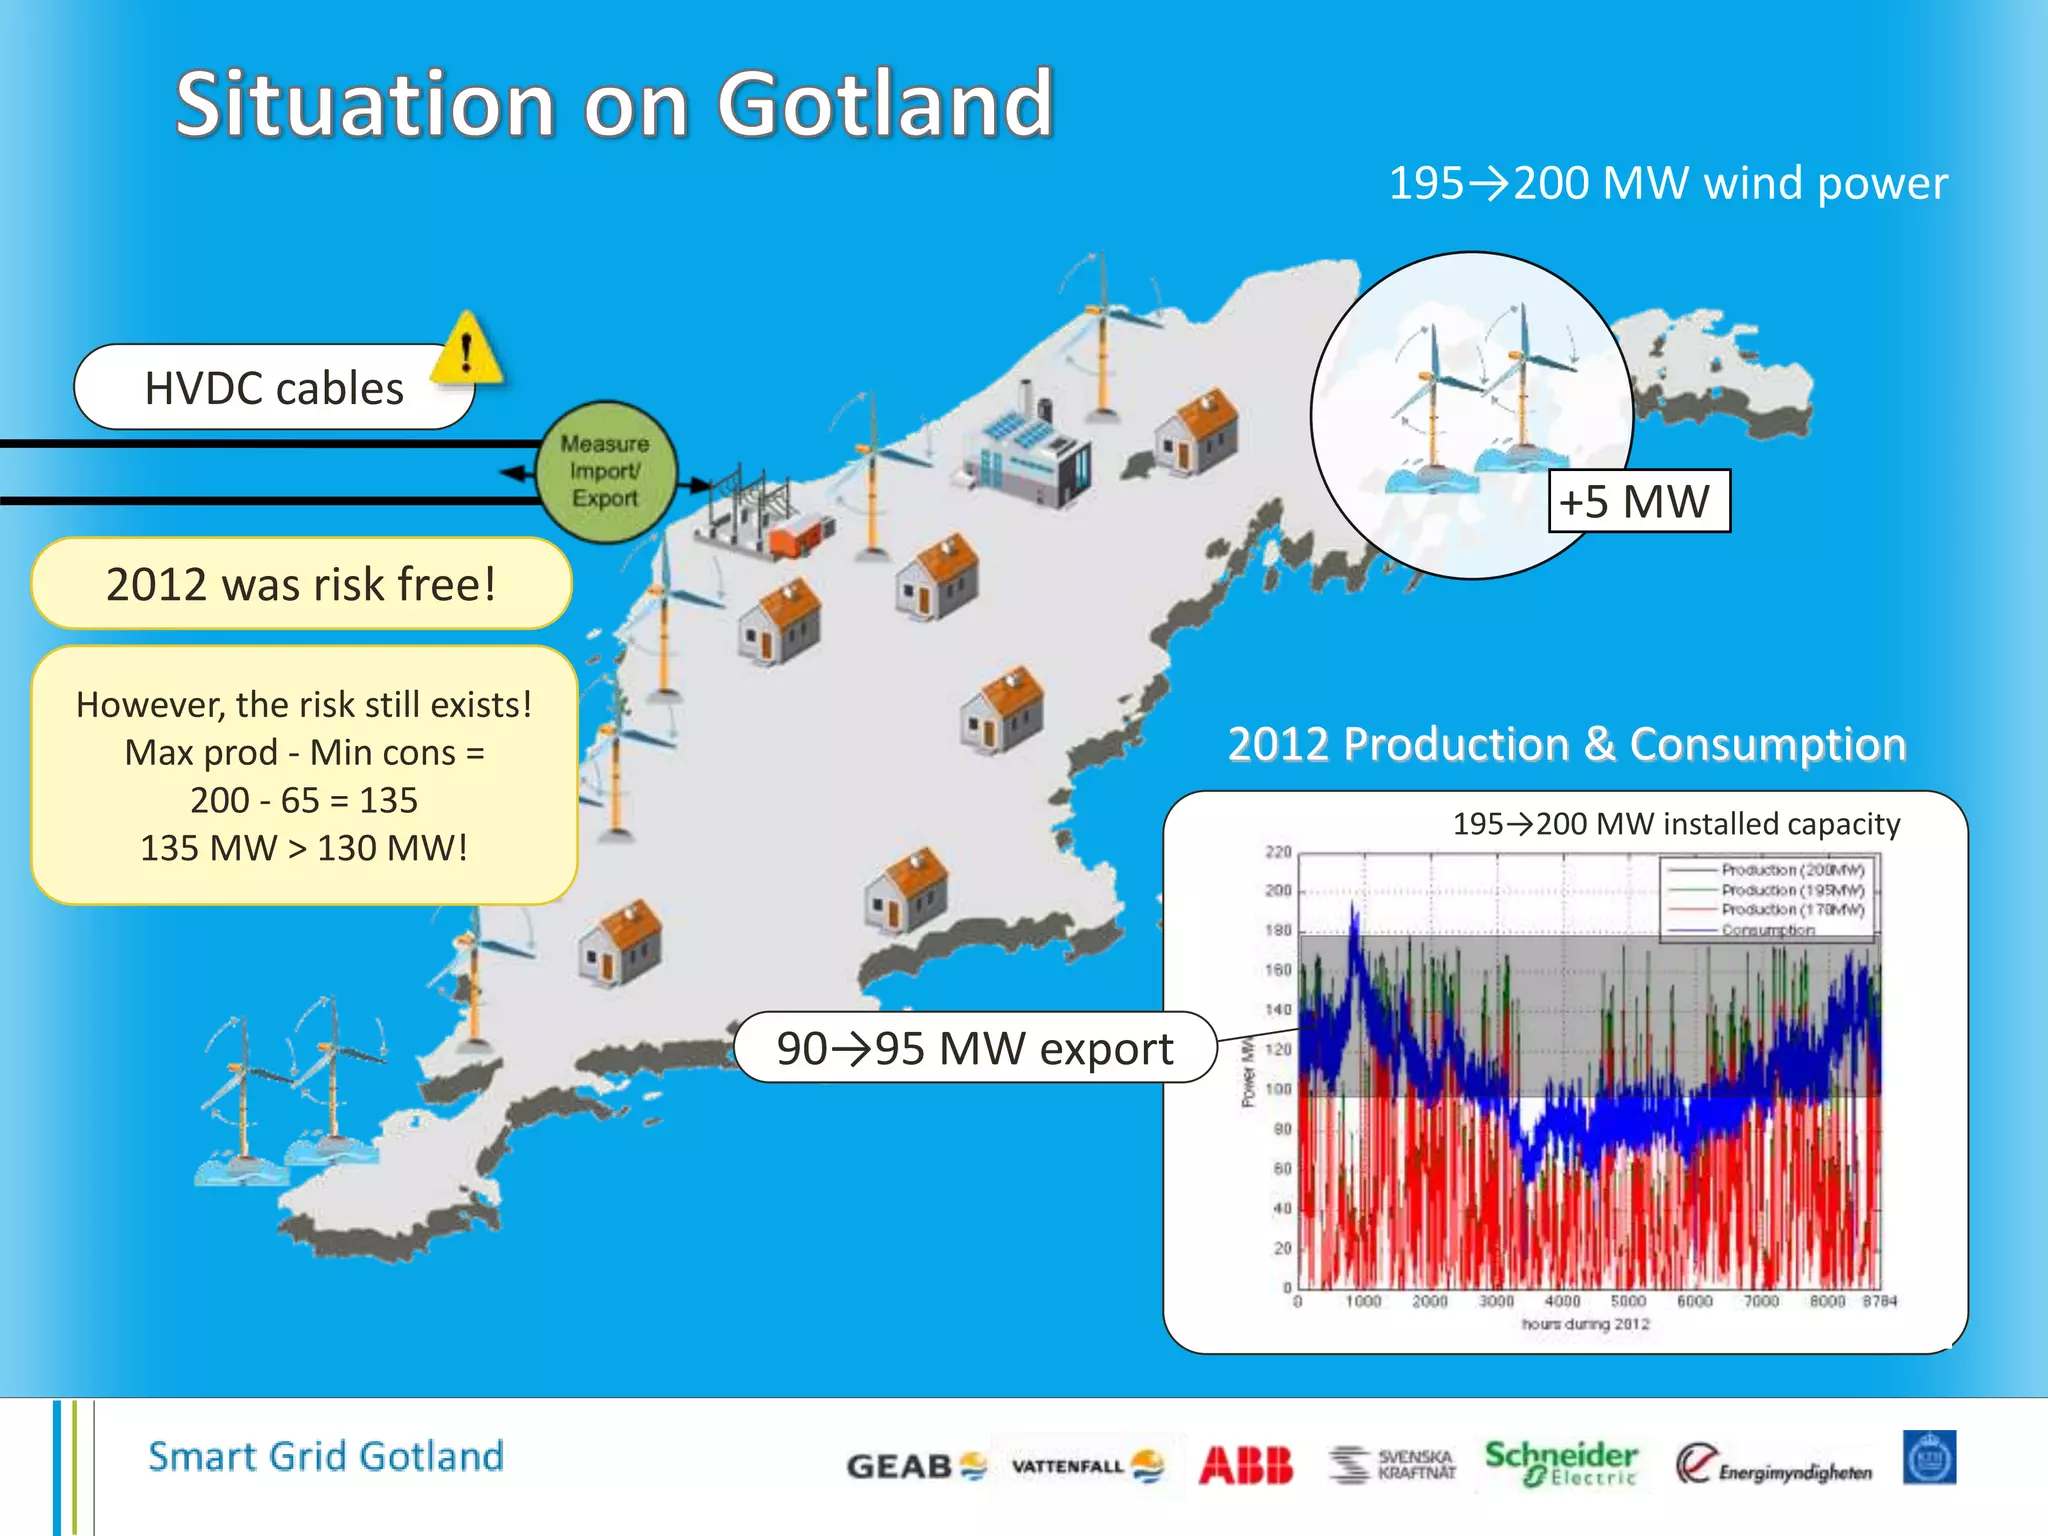
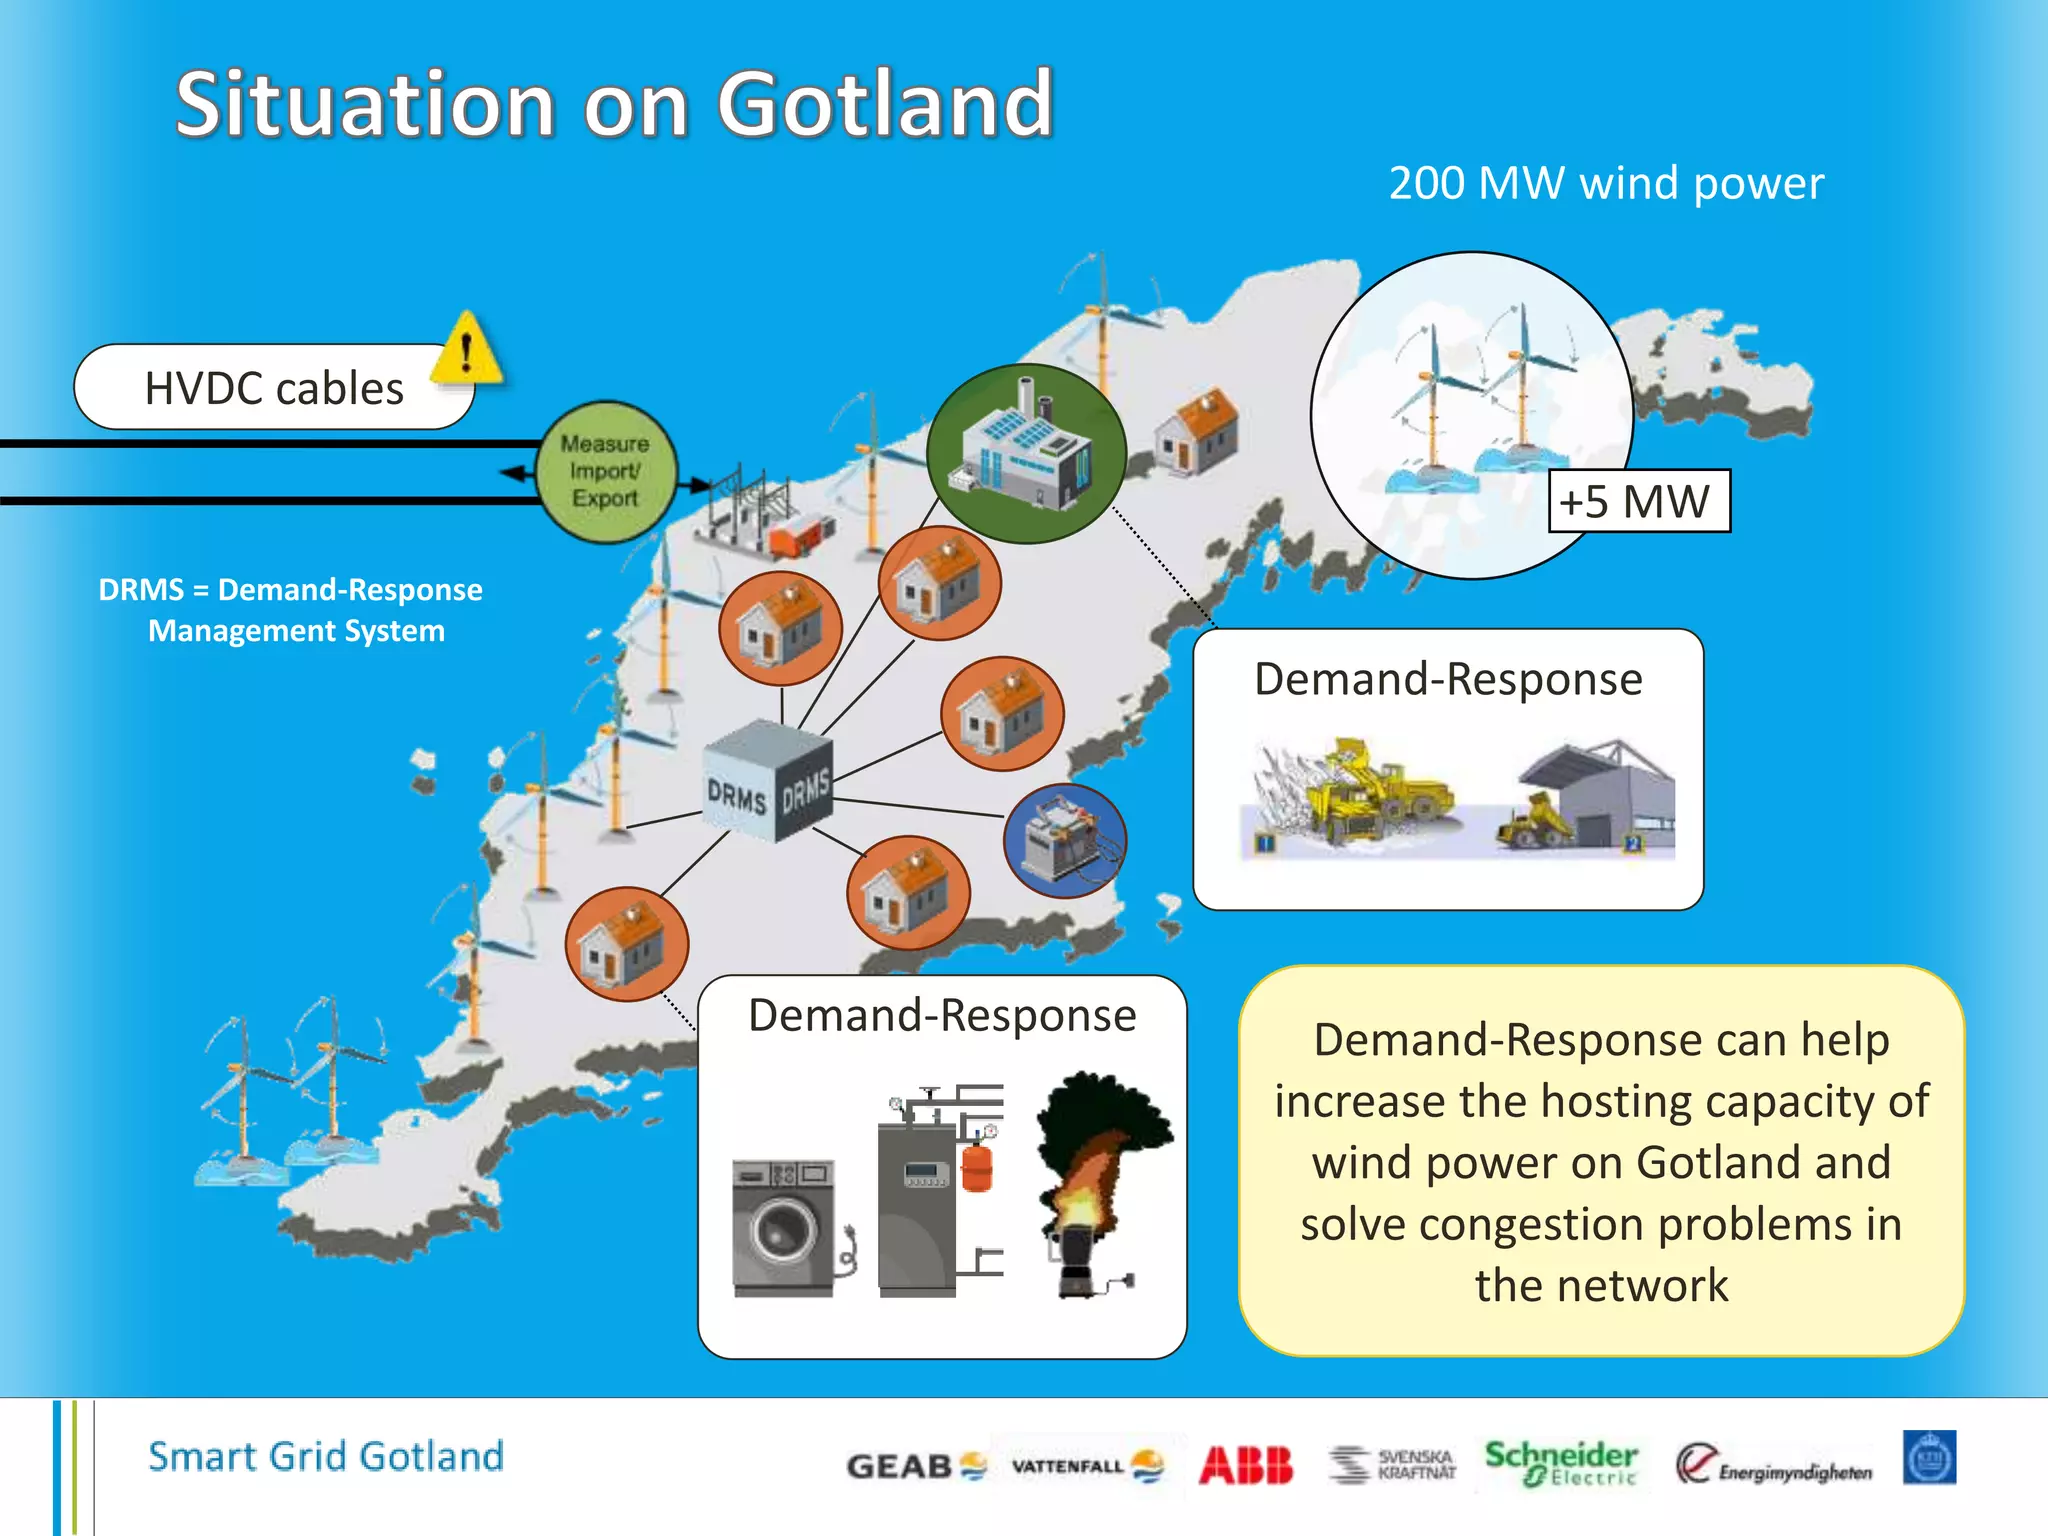
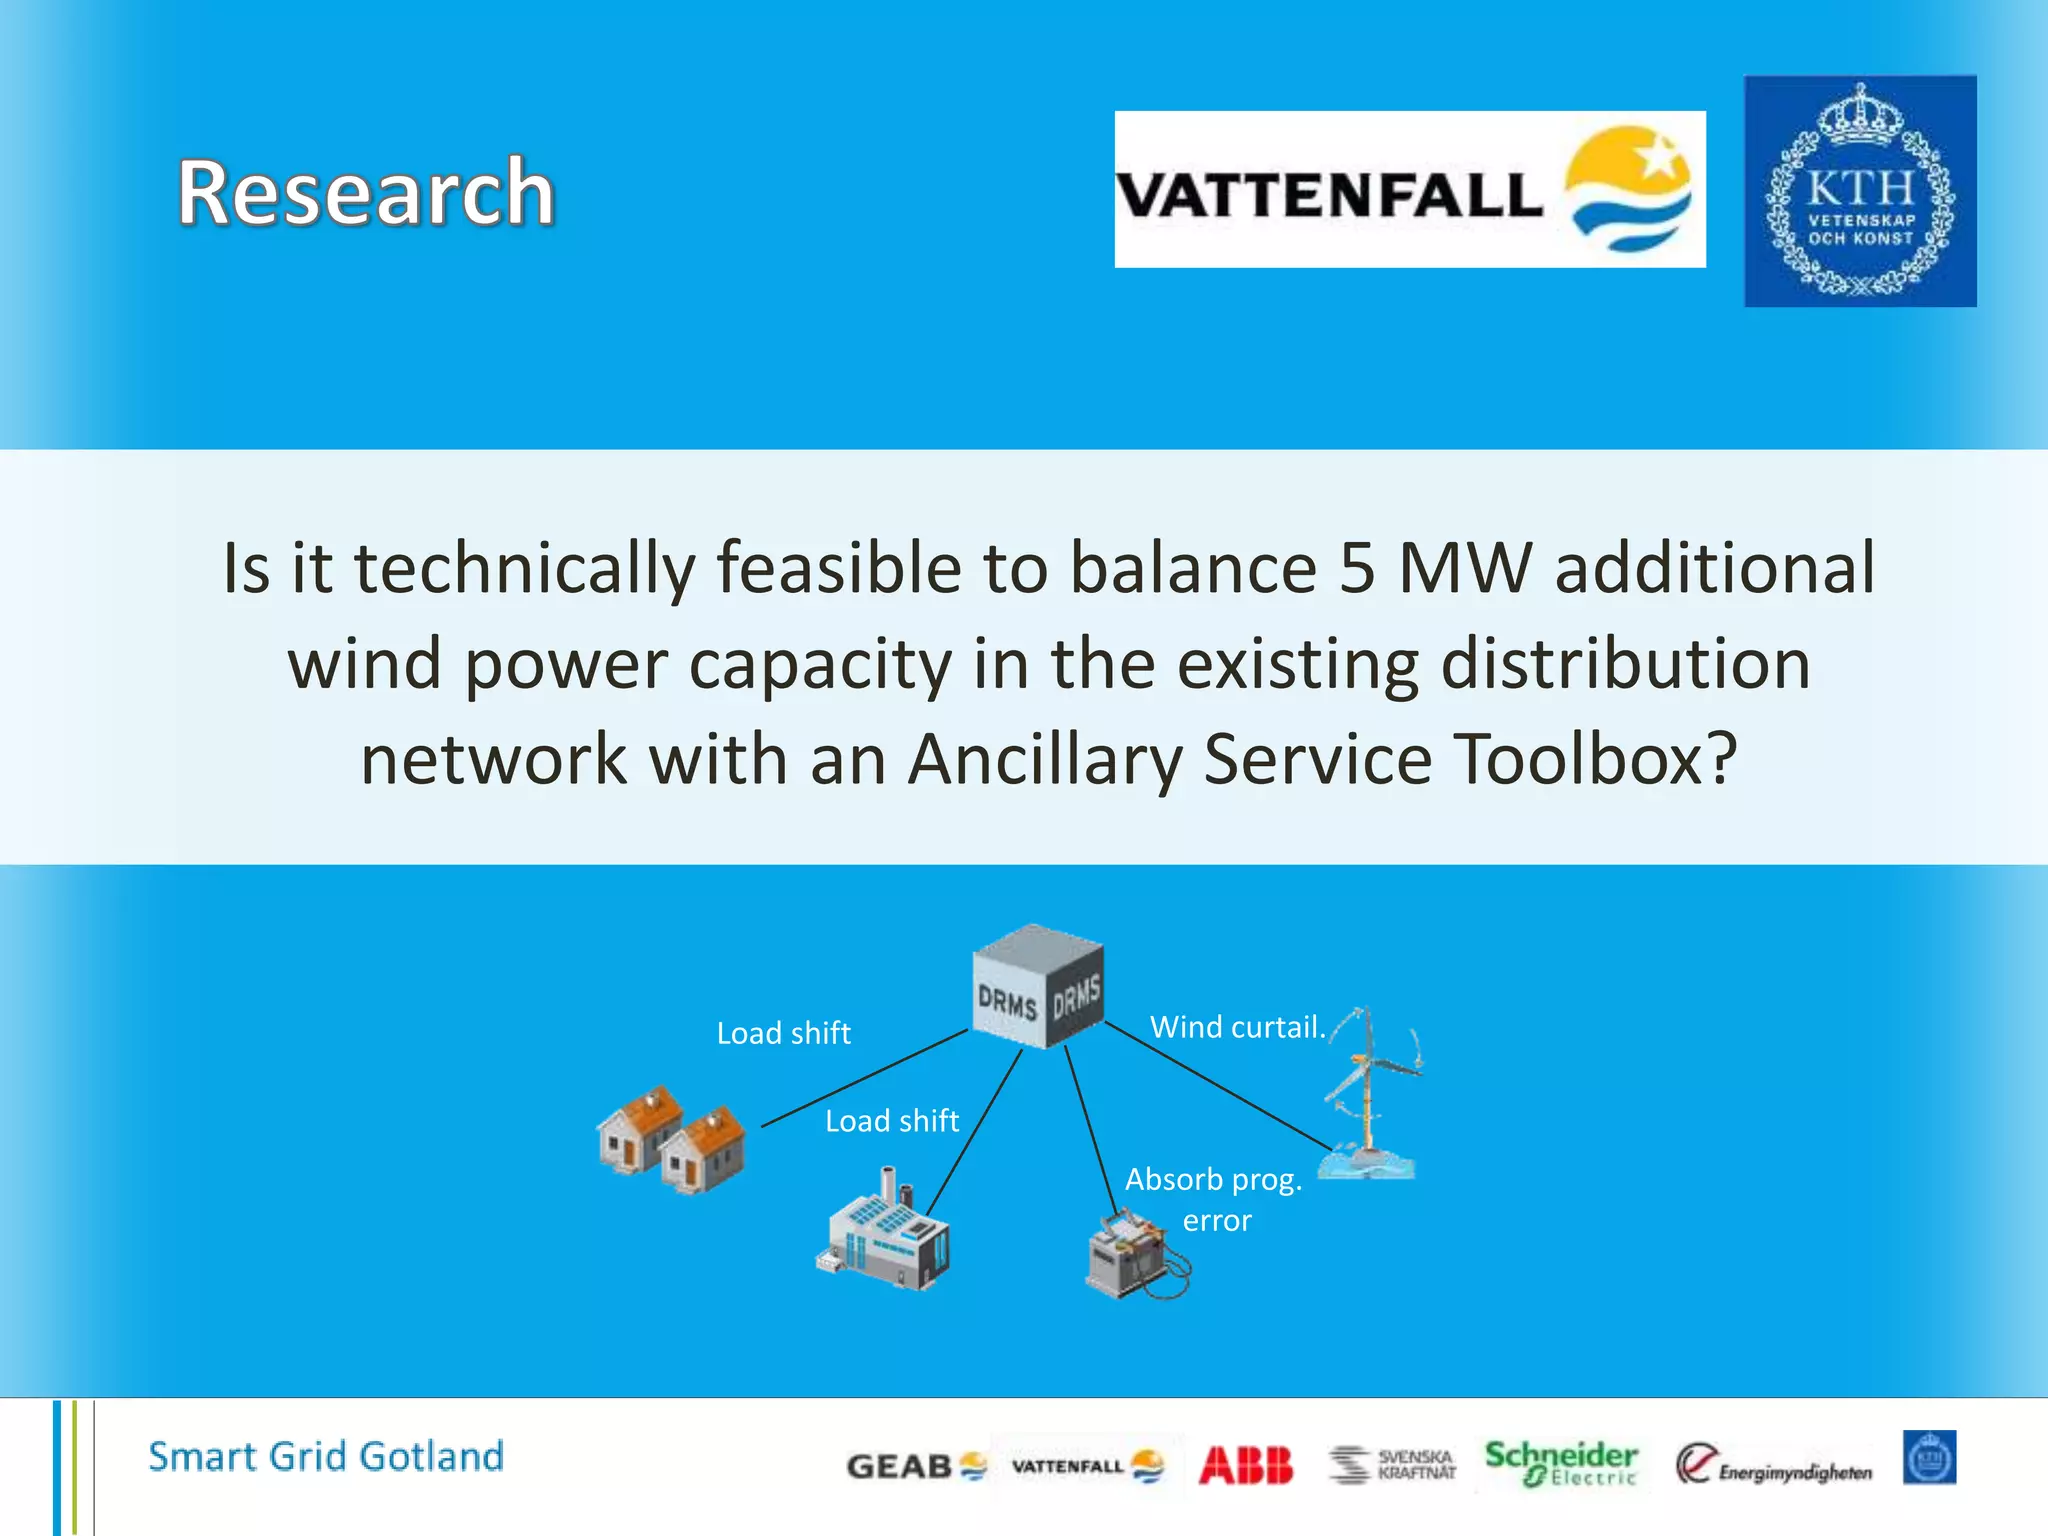
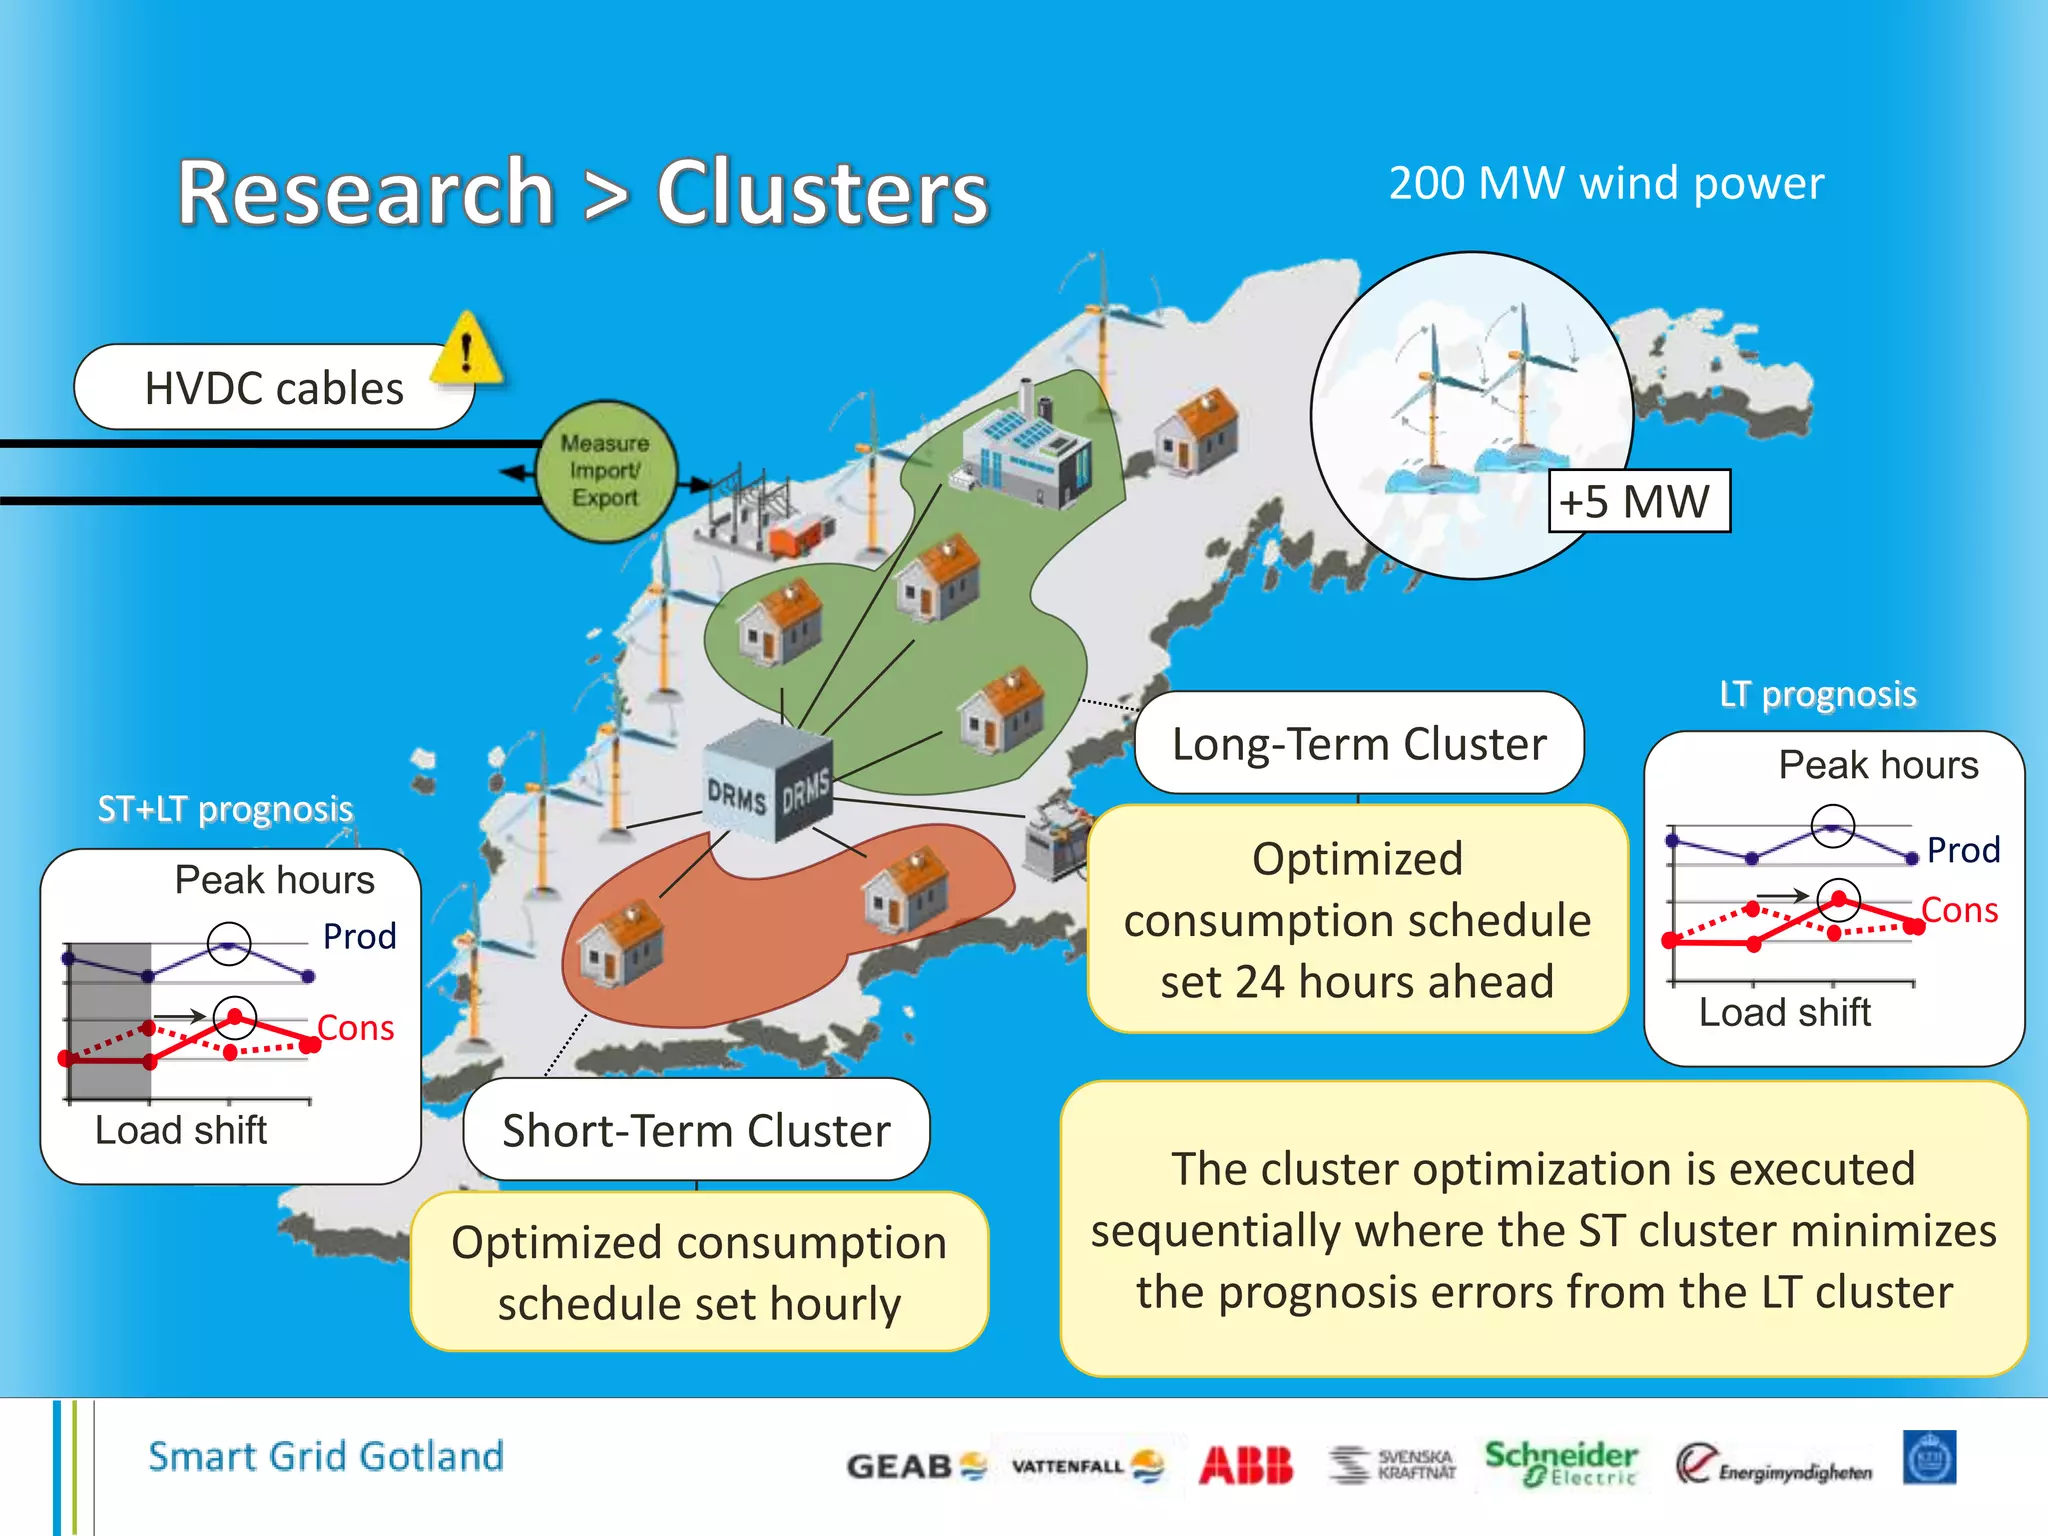
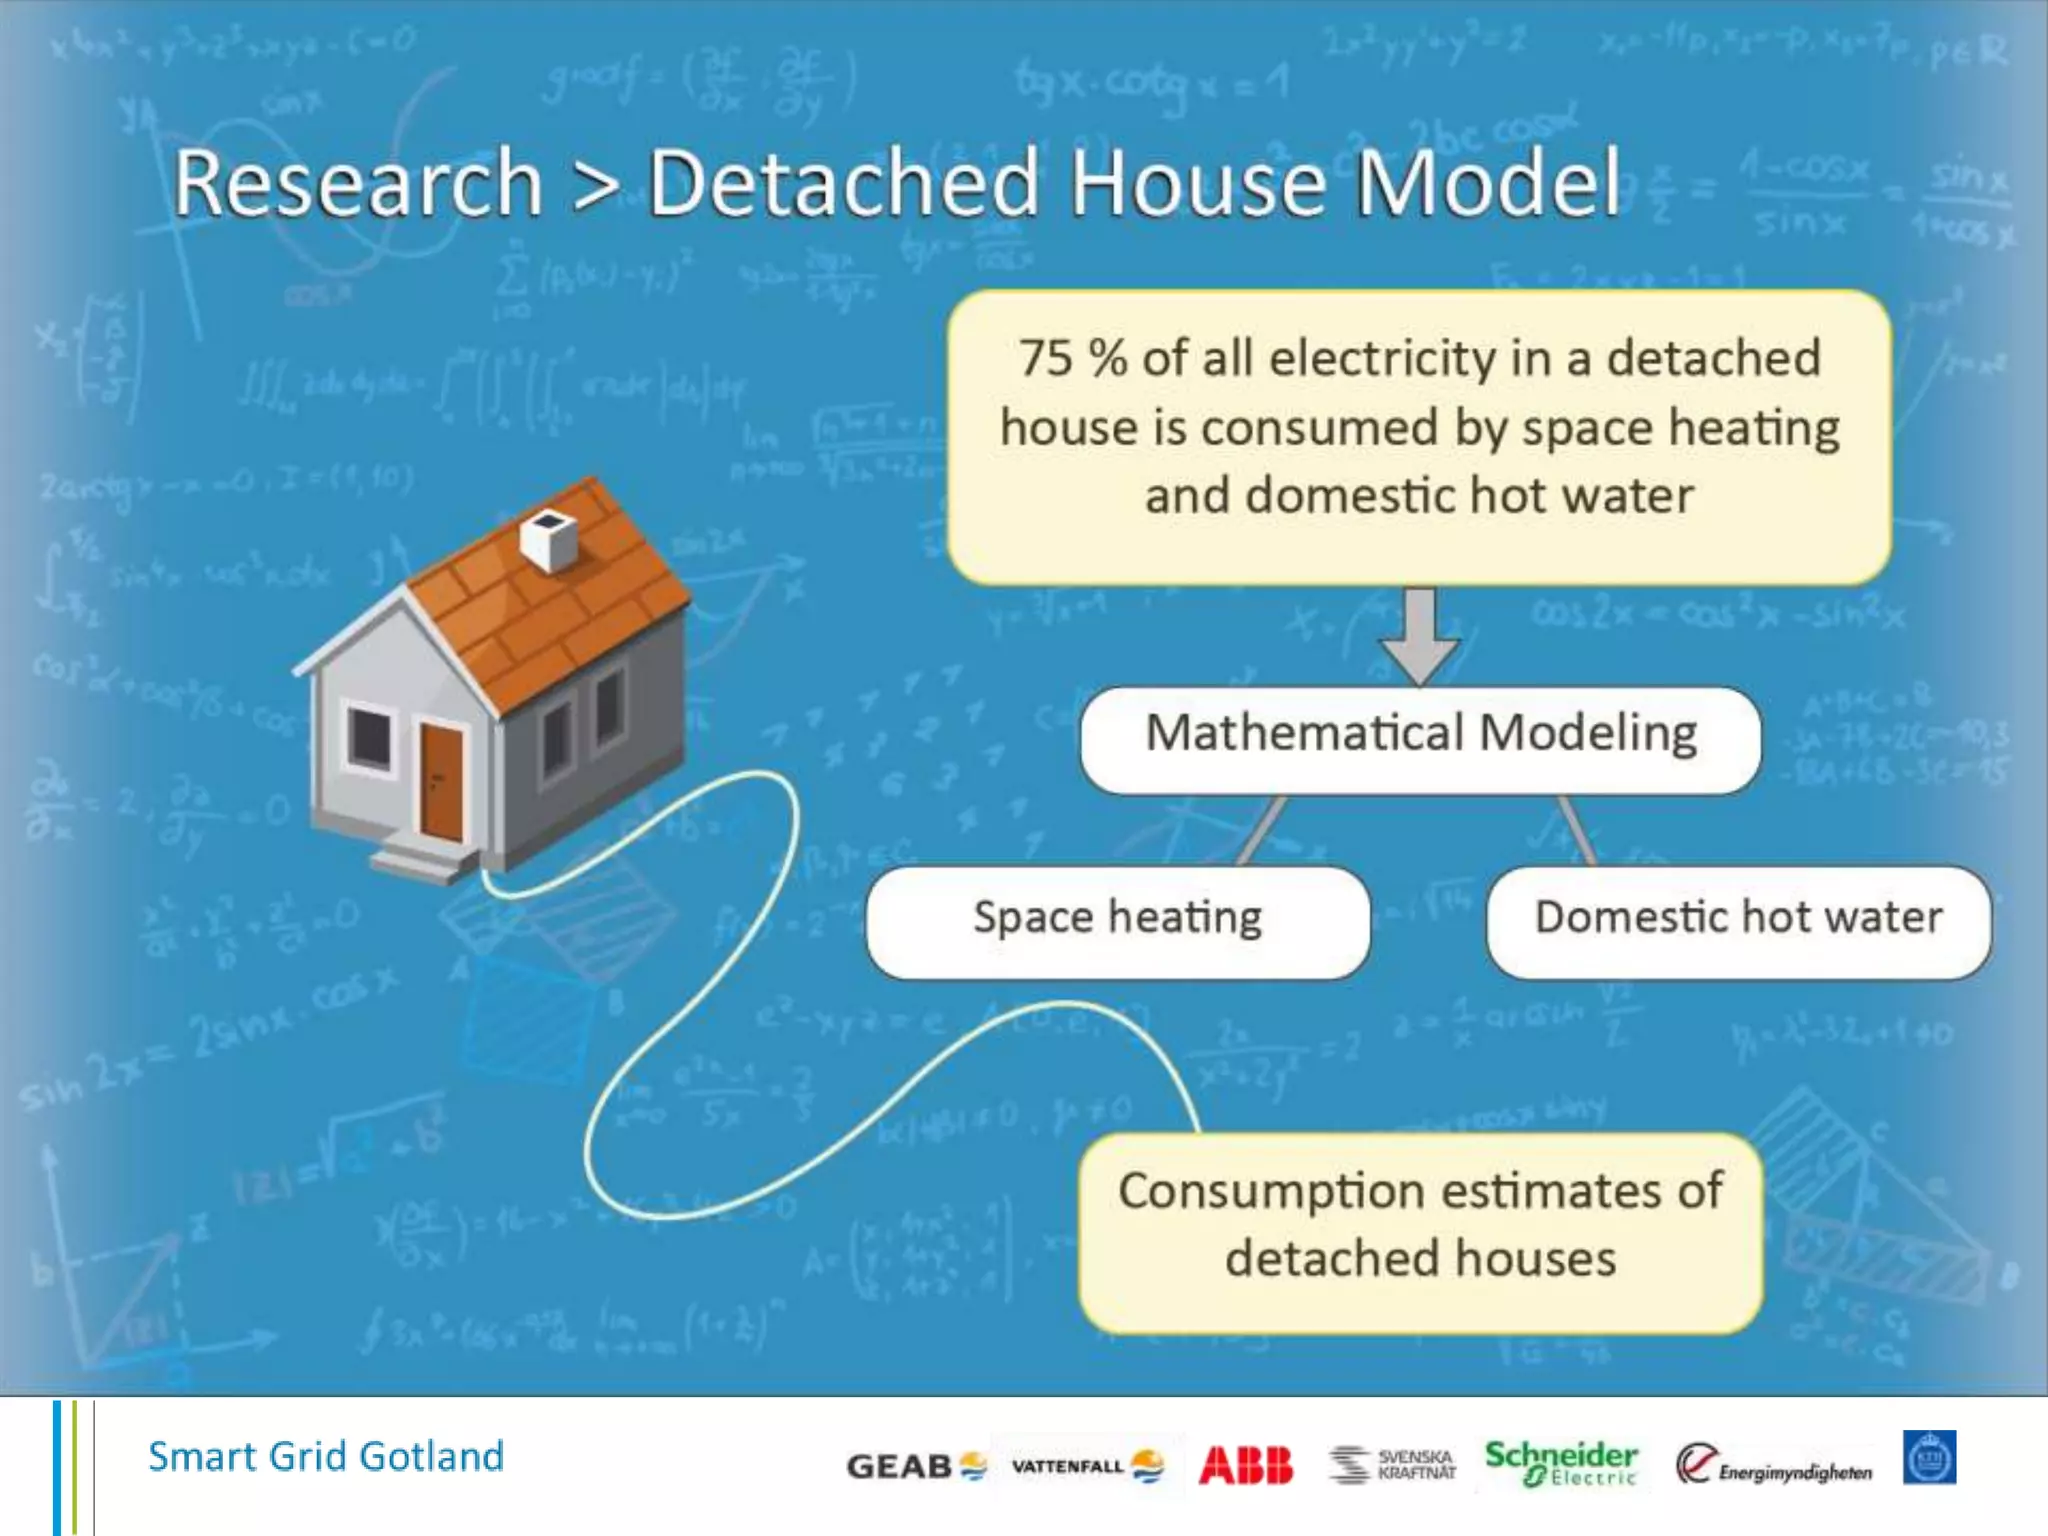
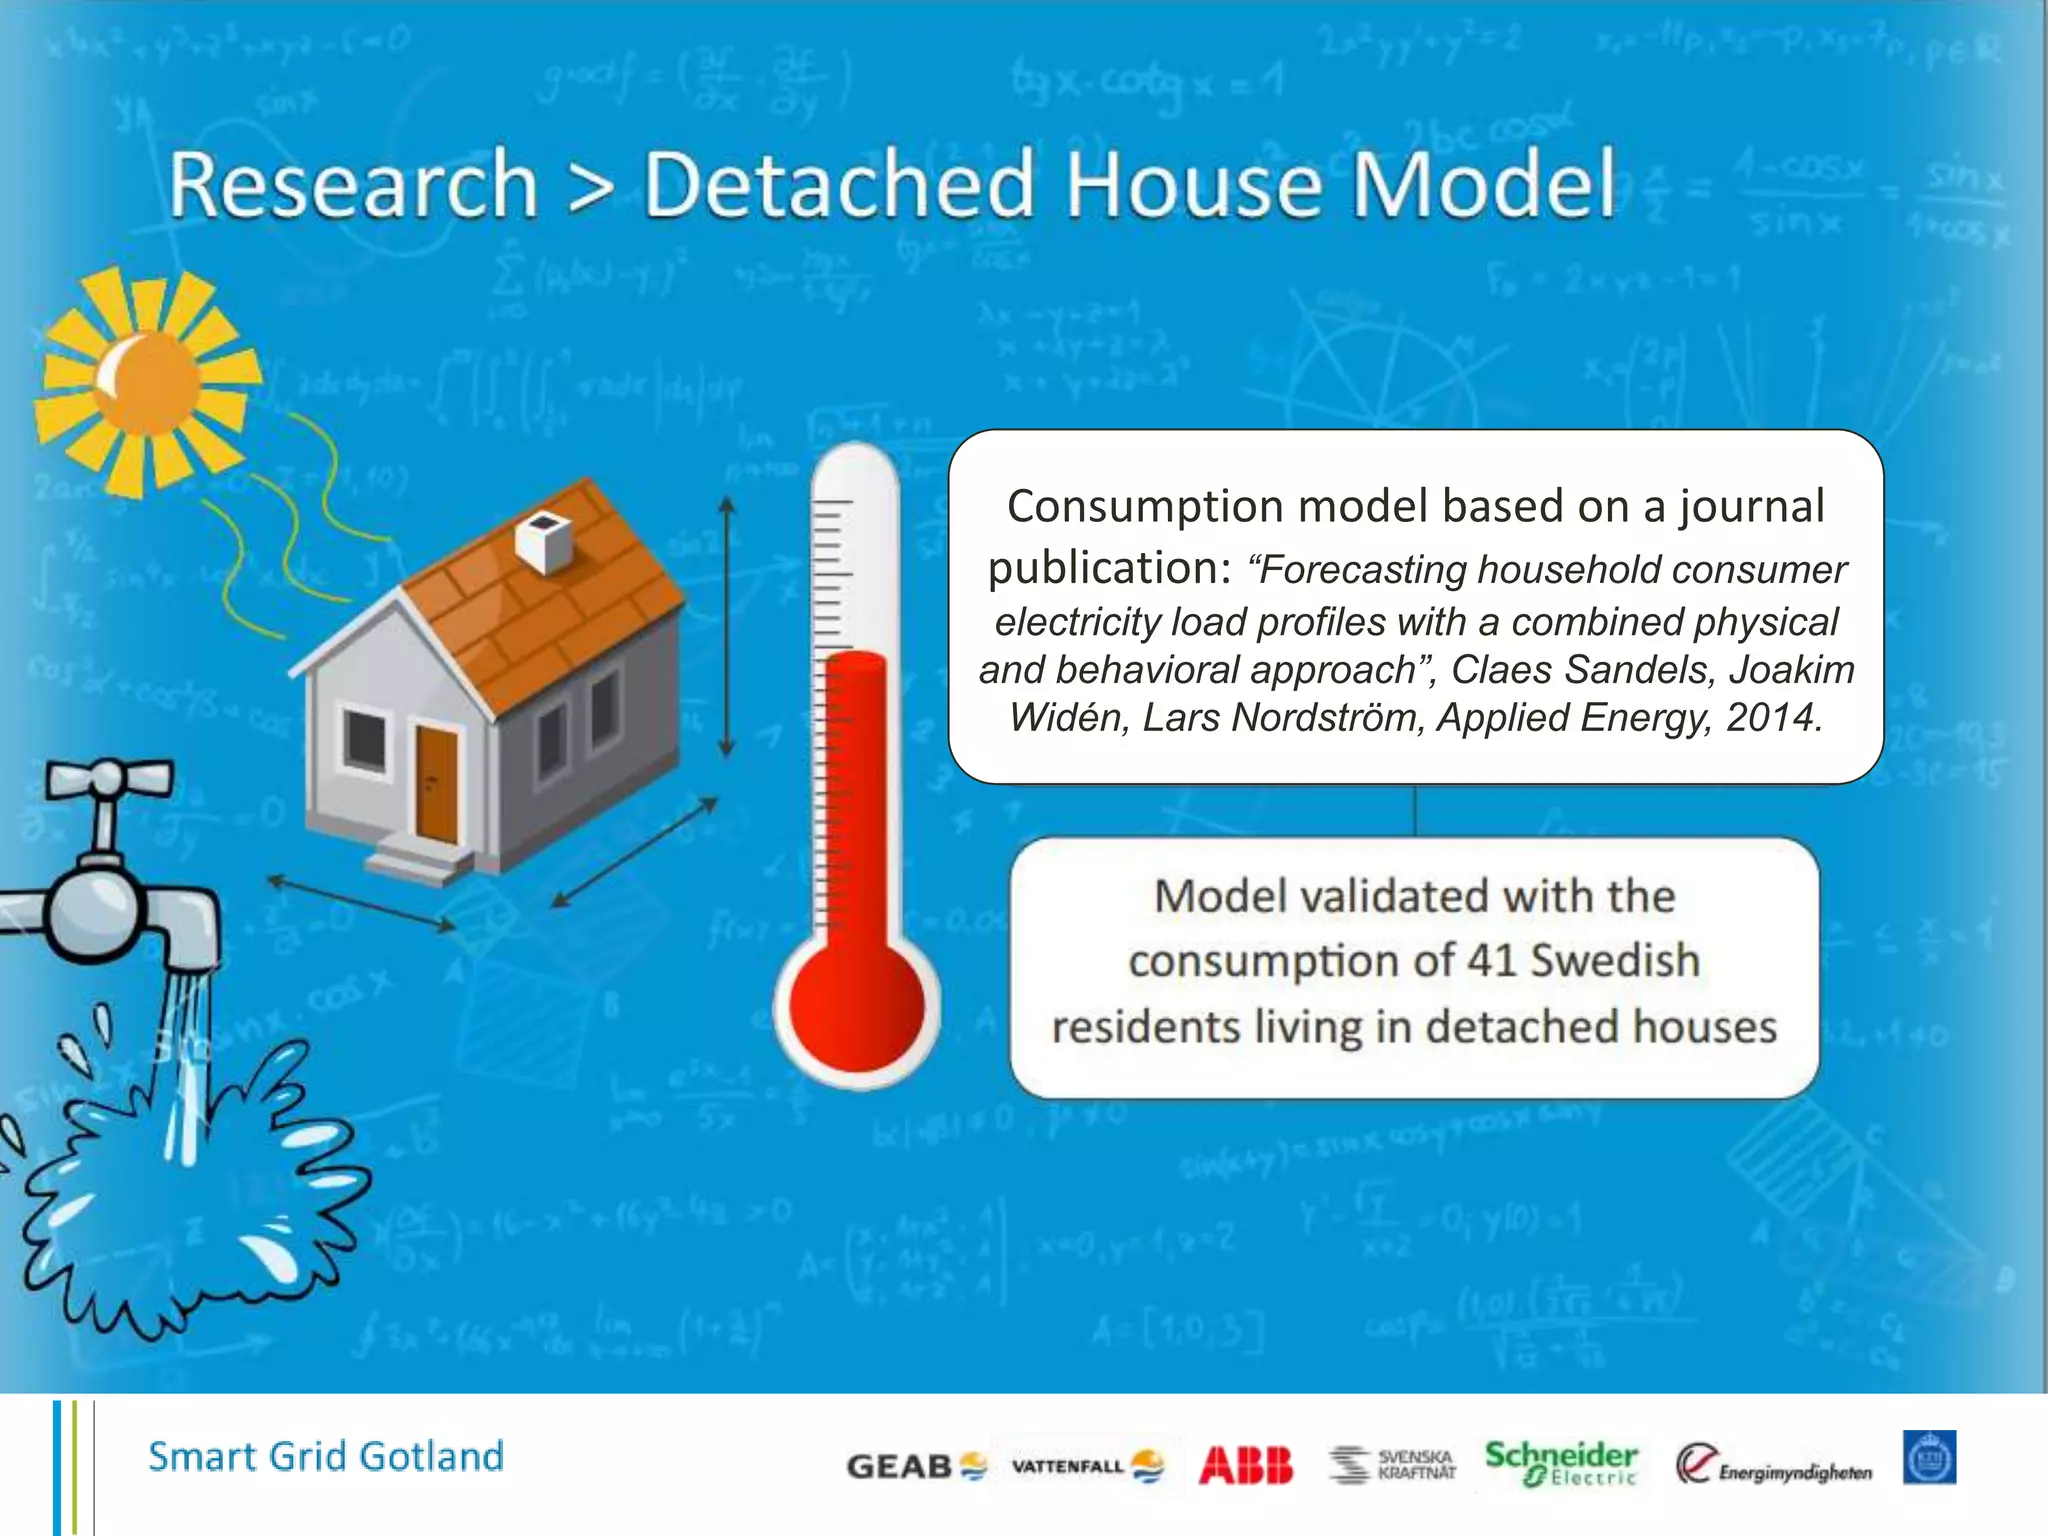
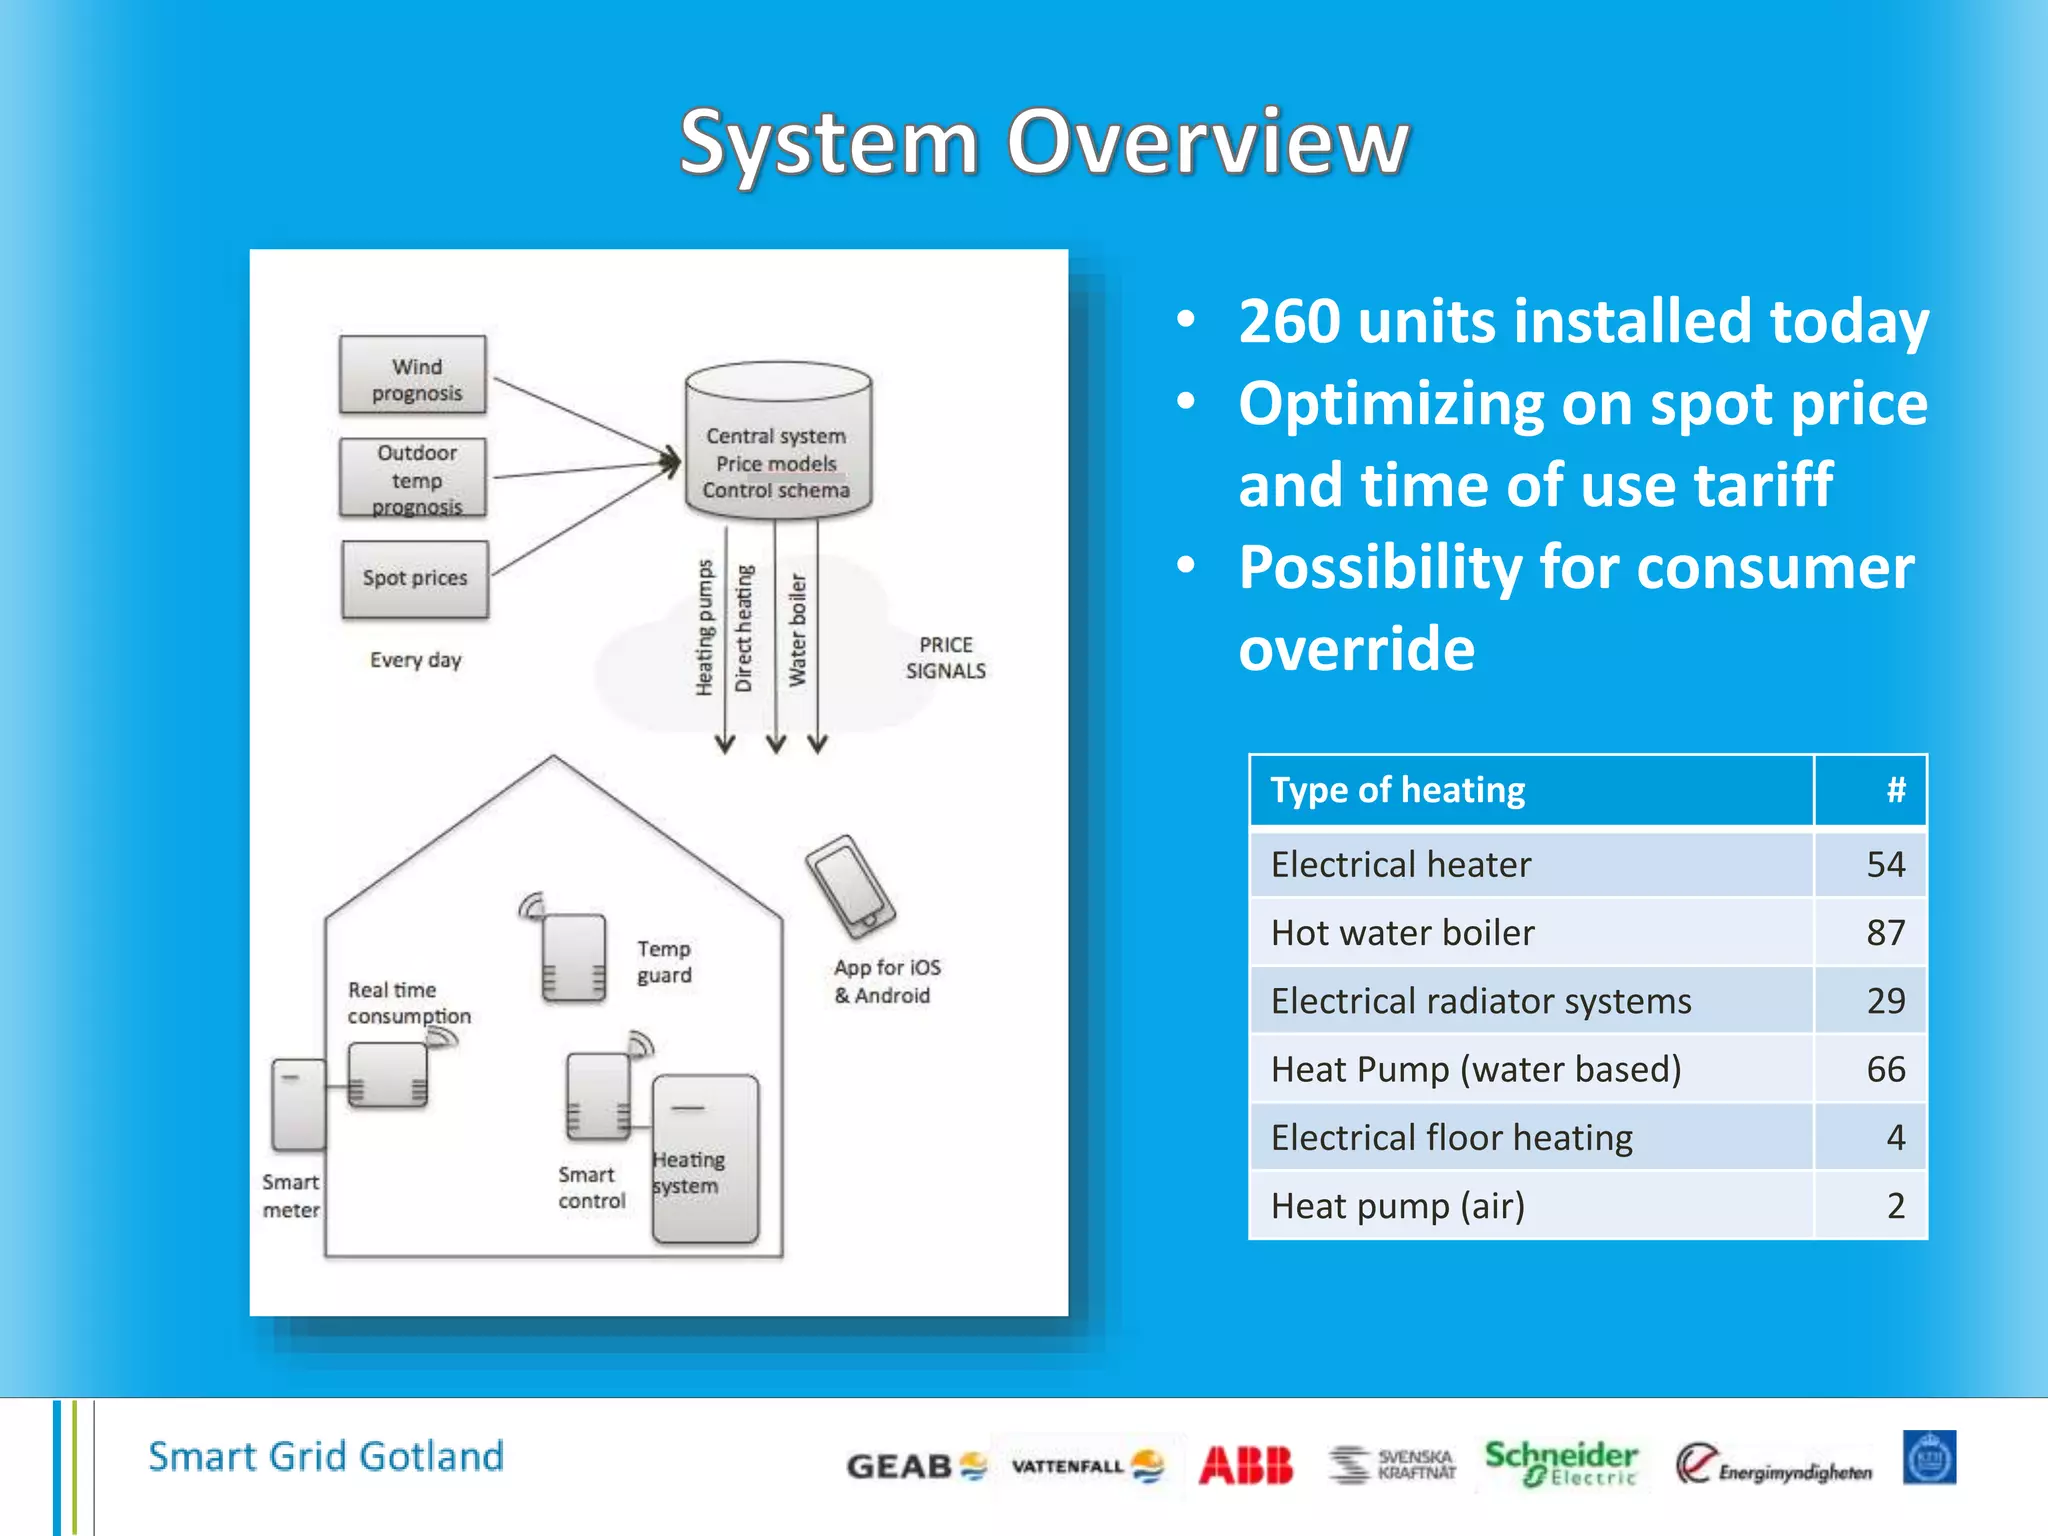
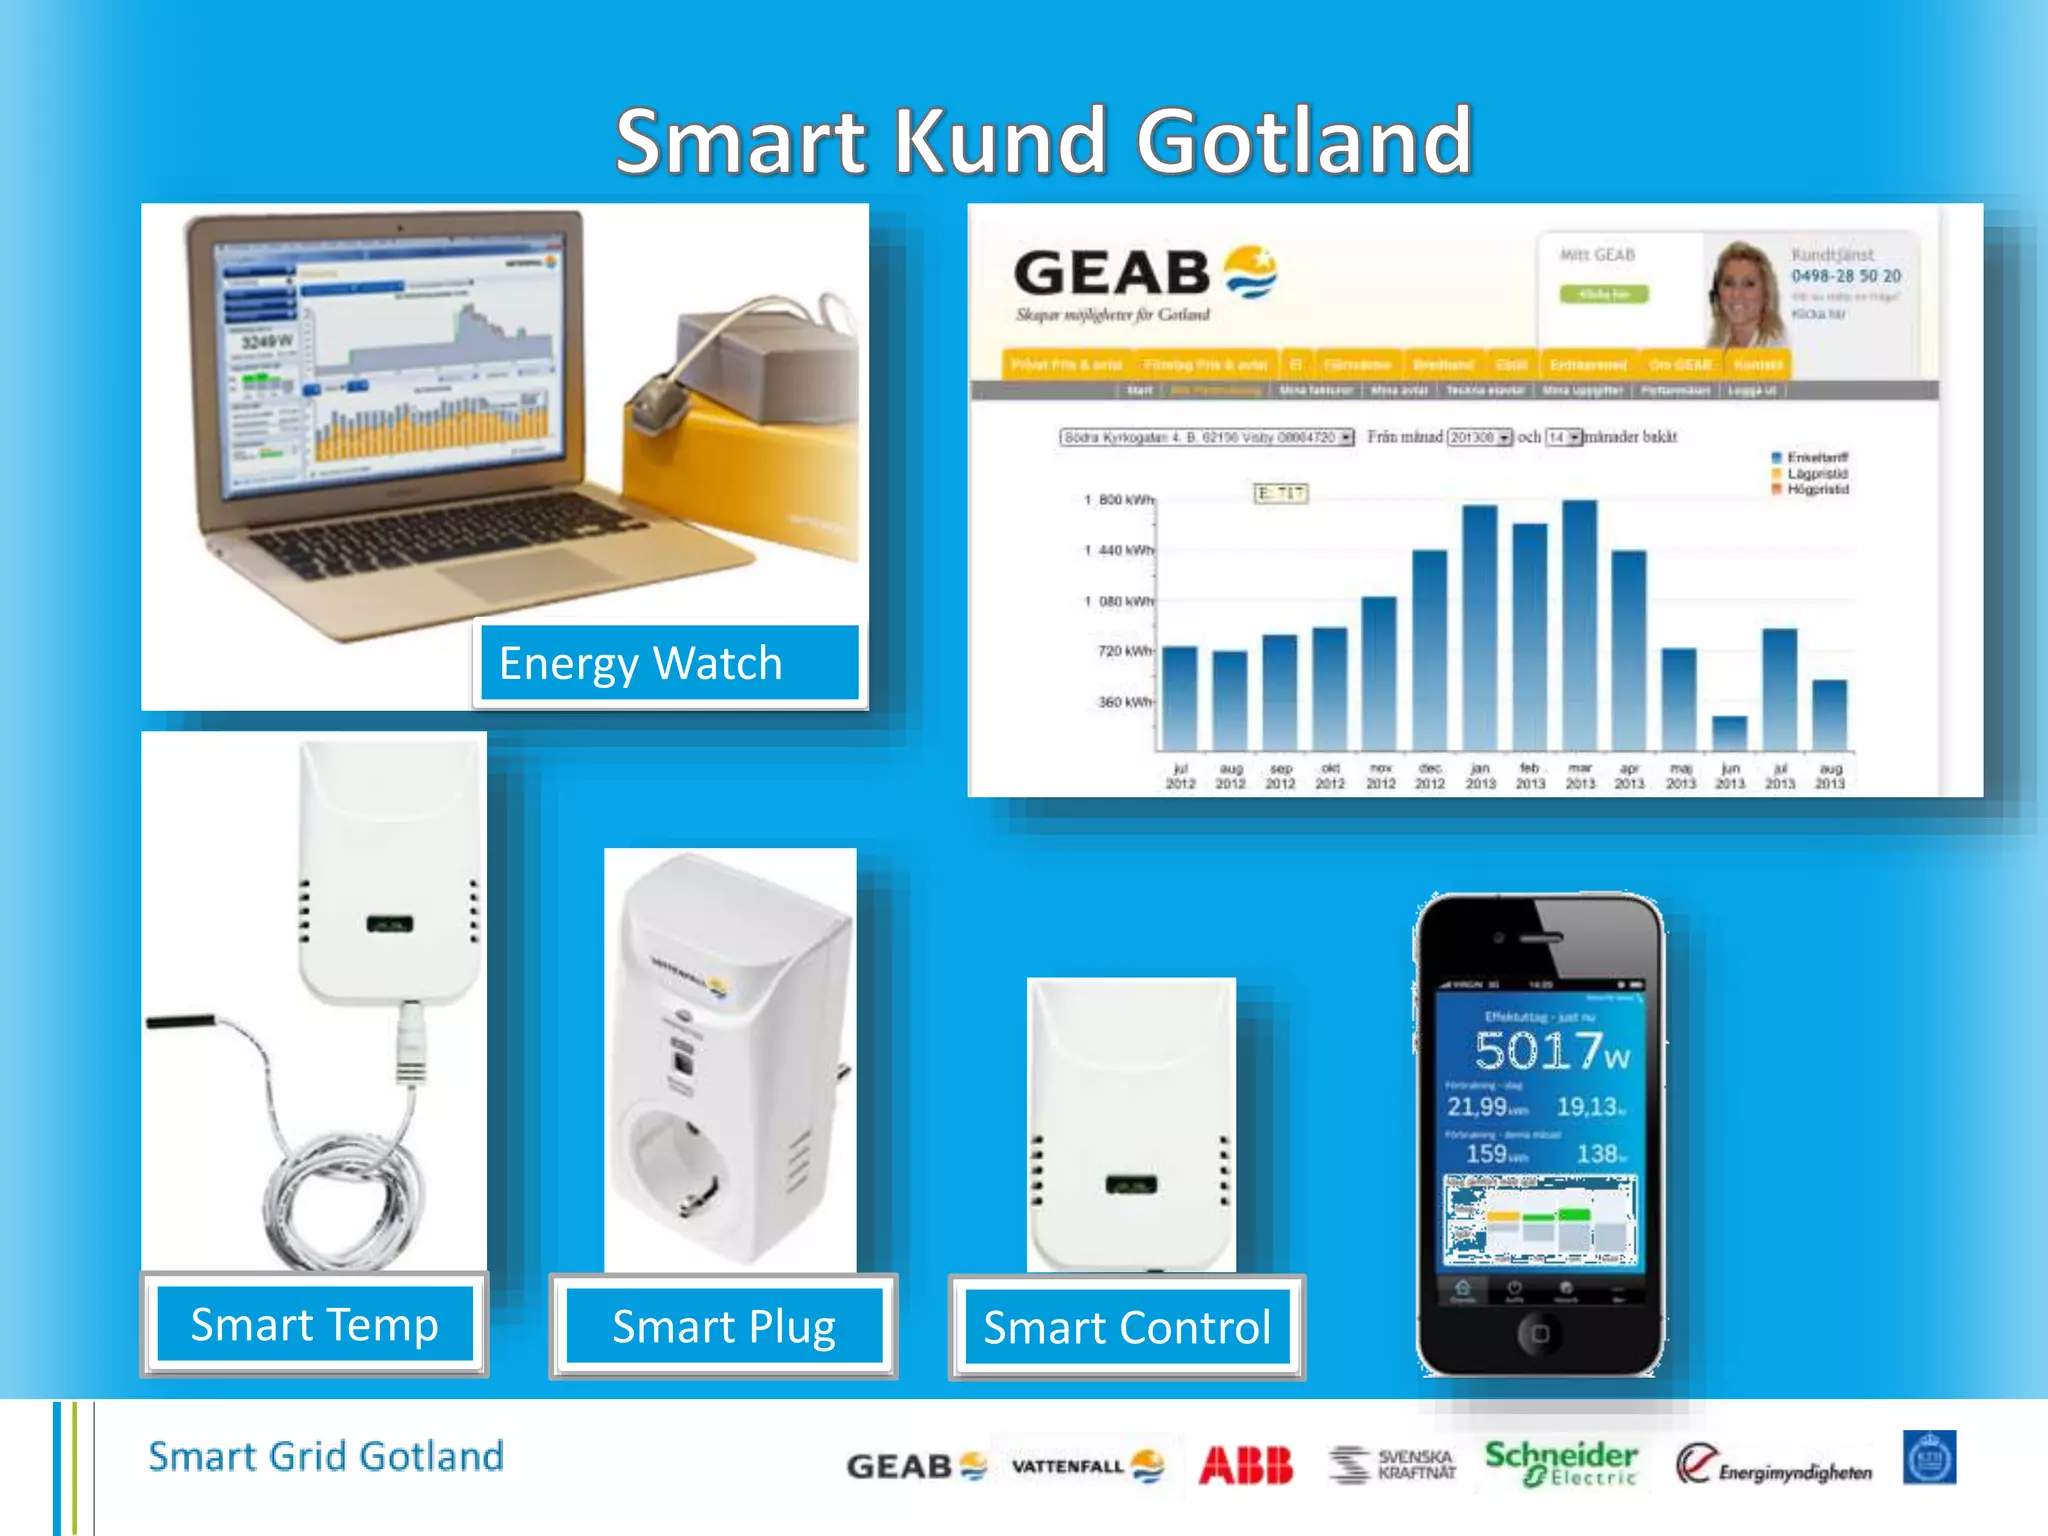
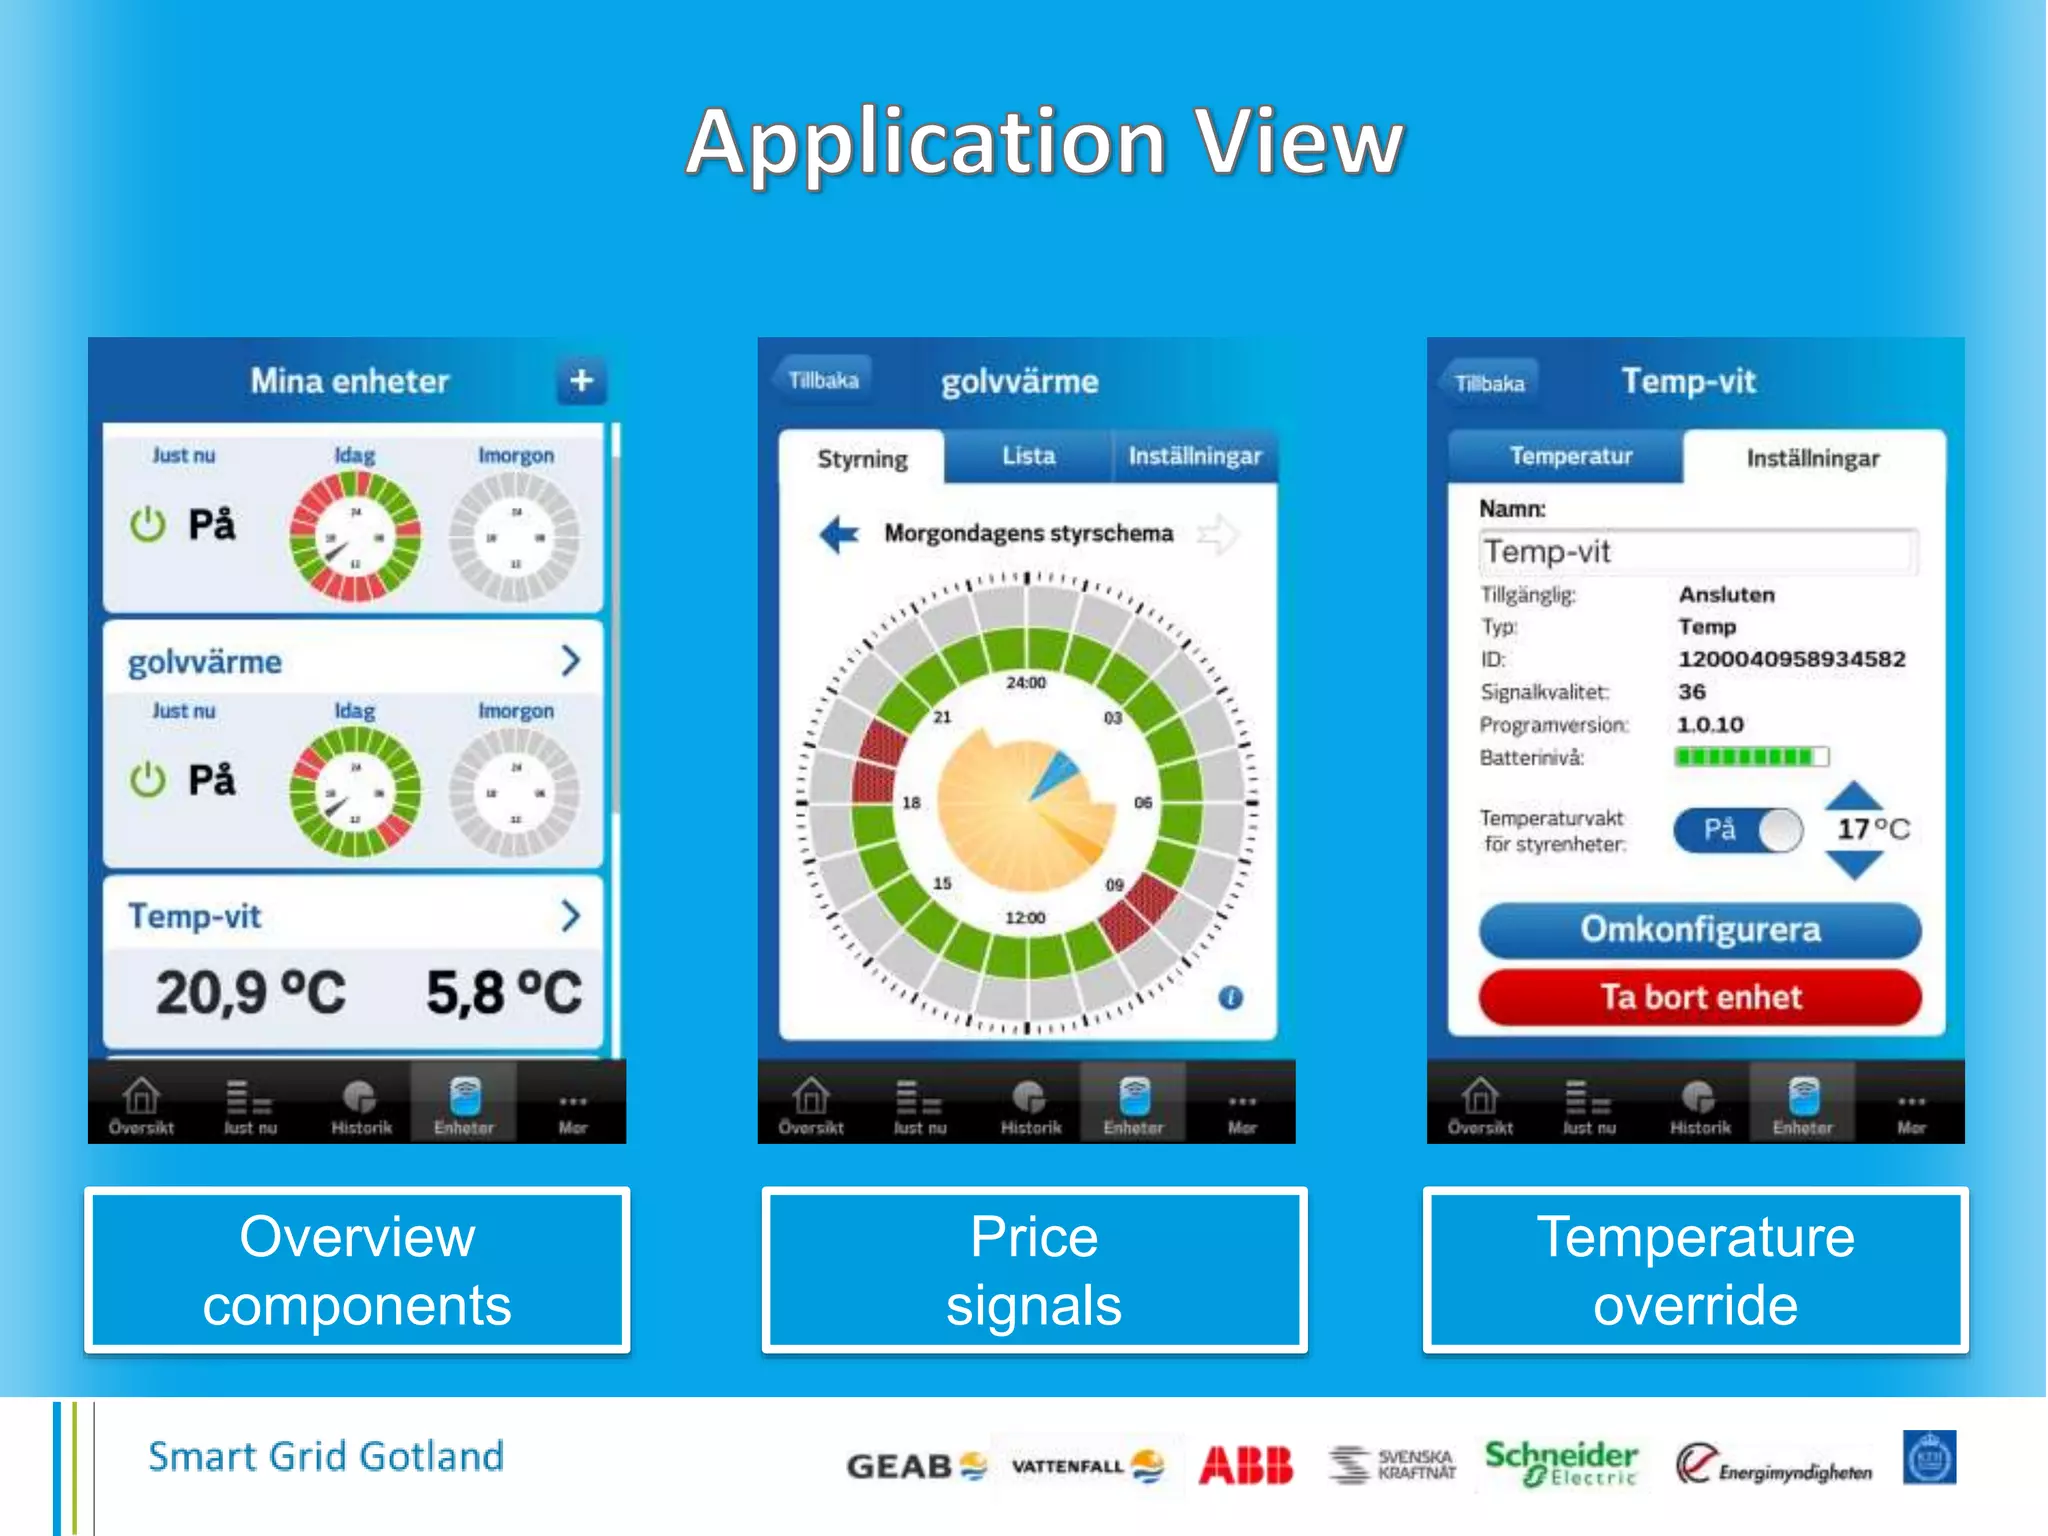
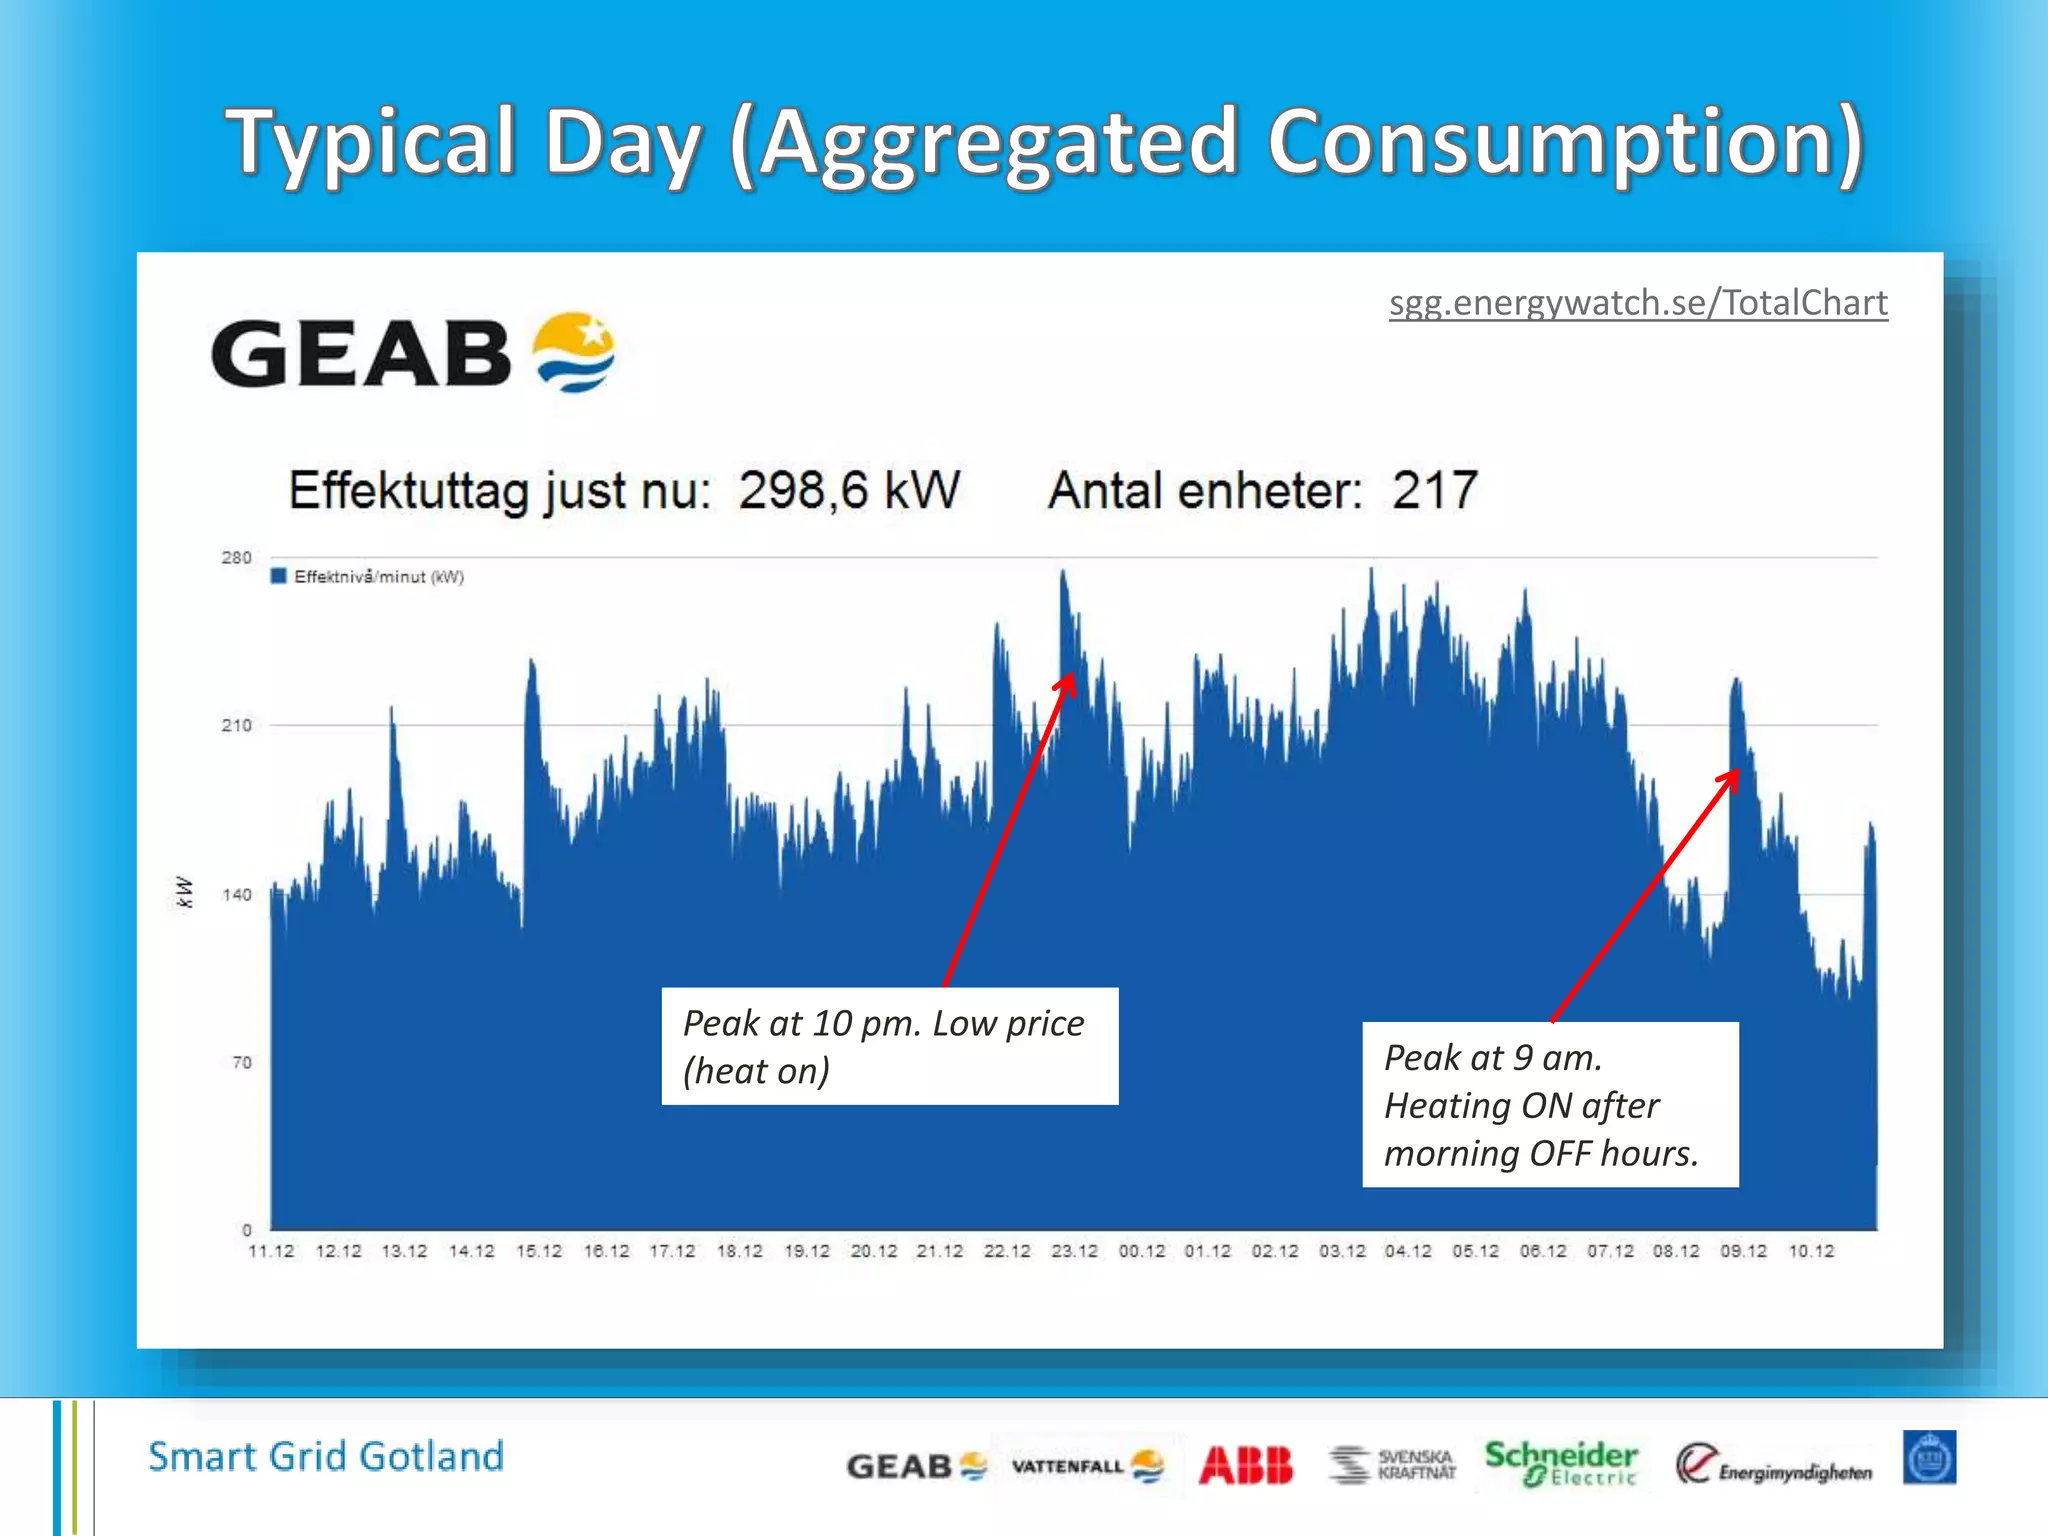
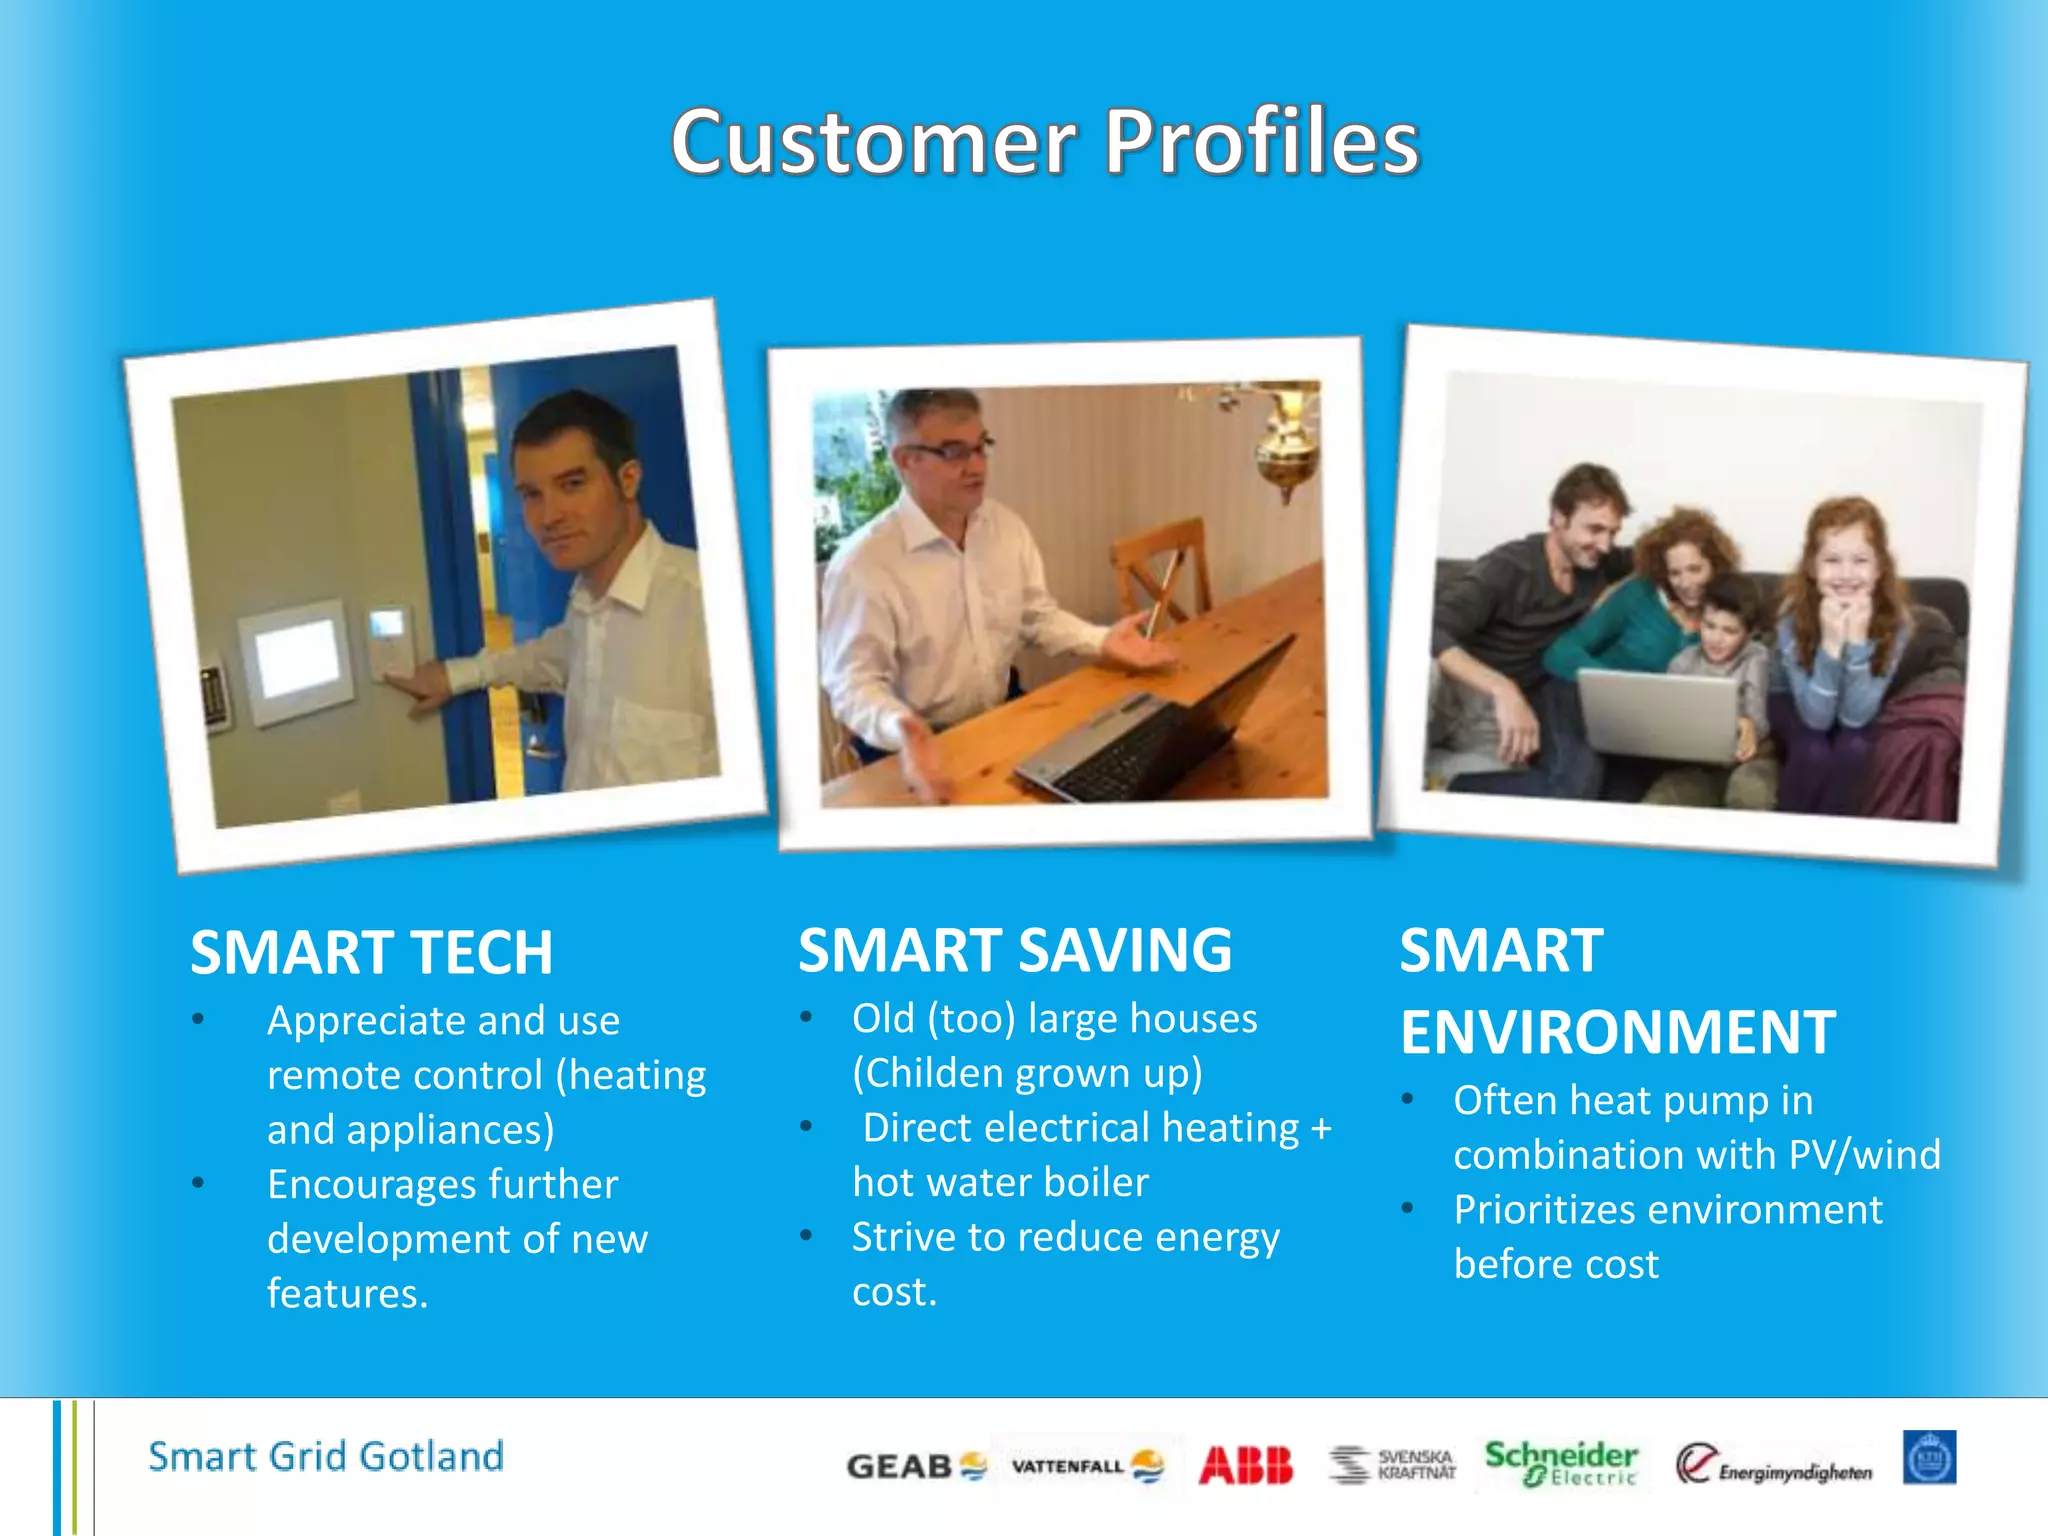

The document discusses the Smart Grid project in Gotland, focusing on the integration of HVDC cables and wind power capacity, which can support up to 200 MW. It highlights the role of demand-response systems in enhancing network capacity and managing load shifting to alleviate congestion, while also emphasizing the need for consumer participation in these initiatives. Furthermore, the document includes insights on consumer behavior, energy-saving measures, and customer satisfaction related to smart technology adoption.


