SlideShare a Scribd company logo
1 of 4
Download to read offline
JUNE/JULY 2011
                   Inside This Issue                                                                                              Robb Fleischer
     > LOCAL MARKET TRENDS ..................... 1                                                                                American Marketing Systems, Inc.
     > MORTGAGE RATE OUTLOOK ............... 2
                                                                                                                                  2800 Van Ness Avenue
                                                                                                                                  San Francisco, CA 94109
     > HOME STATISTICS .............................. 2                                                                           (415) 447-2009
     > FORECLOSURE STATS ........................ 3                                                                               rfleischer@amsiemail.com
                                                                                                                                  http://www.amsires.com/staff/robb
     > CONDO STATISTICS ............................ 3                                                                            DRE #01403882
     > DOM & SP/LP CHARTS ..................... 4


The Real Estate Report
 local market trends                                                                                                                  Trends at a Glance
                                                                                                                                      (Single-family Homes)
                                                                                                                                              May 11    Apr 11         May 10
                                                                           SAN FRANCISCO                                        Home Sales:      209       191            236
                                                                                                                               Median Price: $ 715,000     $ 725,000 $ 750,000
Home Prices Down, Condo/Loft Prices Up Again                                                                                  Av erage Price: 1,002,056 1,025,906      987,896
                                                                                                                        Sale/List Price Ratio:     99.0%      99.6%      99.8%
The median price for single-family re-sale homes             IN THE CHART BELOW…
fell 1.4% in May from April. Year-over-year, the             the green shows momentum for home sales while                  Day s on Market:         64          67        56
median price was off for the ninth month in a row,           the purple line shows momentum for the median                             (Lofts/Tow nhomes/TIC)
falling 4.7%. The average price was up 1.4% indi-            price for single-family, re-sale homes.                                             May 11      Apr 11    May 10
cating that more higher priced homes sold last                                                                                 Condo Sales:         243        231        288
month.                                                       PRICING MOMENTUM…                                                 Median Price: $ 695,000     $ 670,000 $ 646,000
                                                             after peaking in September, was flat at -1. Pricing
The median price for condos/lofts rose 5.5% from                                                                              Av erage Price:    846,713    802,247    726,442
                                                             momentum for condos/lofts has been flat since last
April and was up 7.5% compared to last May. The              October, vacillating between 0 and -1.
                                                                                                                        Sale/List Price Ratio:     98.2%      98.0%      97.7%
average price was up a whopping 16.6%.                                                                                      Day s on Market:         78          71        72

Home sales rose 9.4% from April, but were off,
                                                             MORE STATISTICS…
year-over-year, by 11.4%. Year-to-date, home                 Average days on market dropped three days to 64
sales are down 4.1% compared to the first five               days.
months of 2010.                                                                                                        For complete information on a particular neighbor-
                                                             The sales price to list price ratio lost 0.6 of a point
                                                                                                                       hood or property, call.
                                                             to 99%.
SALES MOMENTUM…
Home sales momentum continued trending down-                 CONDO/LOFT STATISTICS…
ward in May, falling four points to –7. Condo/loft           Condo/loft sales fell 15.6% year-over-year. Year-to-
momentum after peaking at +31 last August,                   date, condo/loft sales are up 4.6%.
dropped seven points to 0.
                                                             The sales price to list price ratio rose 0.2 of a point
WE CALCULATE…                                                to 98.2%.
momentum by using a 12-month moving average                  Remember, the real estate market is a matter of
to eliminate seasonality. By comparing this year’s           neighborhoods and houses. No two are the same.
12-month moving average to last year’s, we get a
percentage showing market momentum.

 San Francisco Homes: Sales Momentum
  25.0%
  20.0%
  15.0%
  10.0%
   5.0%
   0.0%
  -5.0% 0 FMAMJ JA SOND0 FMAMJ JA SOND0 FMAMJ JA SOND0 FMAMJ JA SOND1 FMAMJ JA SOND1 FMAM
        6                7            8              9              0               1
 -10.0%
 -15.0%
 -20.0%
 -25.0%
        Sales        Pricing                                                 © 2010 rereport.com


                                                 Robb Fleischer | rfleischer@amsiemail.com | (415) 447-2009
The Real Estate Report


                                                   Mortgage Rate Outlook
                                                   May 27, 2011 -- HSH.com's broad-market mortgage             fallen to just 6.5 months available, and the 175,000
30-Year Fixed Mortgage Rates                       tracker -- our weekly Fixed-Rate Mortgage Indicator         actual units on the market is the lowest figure in al-
04-11
                                                   (FRMI) -- found that the overall average rate for 30-       most 50 years. Eventually, when demand for new
01-11                                              year fixed-rate mortgages slipped back by two more          homes does return, a strong spate of homebuilding is
10-10                                              basis points this week, landing at an average of            to be expected. Here's hoping it comes sooner than
07-10                                              4.88%, a fresh 2011 low.                                    later, but 2012 seems to be the earliest at this point
04-10
                                                                                                               for the turn in homebuilding.
01-10                                              FHA-backed 30-year fixed-rate mortgages are driving
10-09                                              sales of homes to first-time homebuyers, and also           As to what happens, we'll need to wait and see. For
07-09
04-09
                                                   giving low-equity refinancers an option to pursue.          now, mortgage rates are even more favorable than
01-09                                              Rates for these product also slipped back by two            they have been at any time in 2011. If you can, it
10-08                                              basis points to finish the week at 4.49%.                   might be a good time to get your purchase or re-
07-08                                                                                                          finance done reasonably soon. Next week, we get
04-08                                              Given the wide differential in interest rates, at least
                                                                                                               both end-of-the-month and first-of the-month infor-
01-08                                              some borrowers should be considering hybrid 5/1
10-07                                                                                                          mation, including the employment report. It's a holi-
                                                   ARMs; whose a five-year fixed periods now average
07-07                                                                                                          day-shortened week, and there doesn't seem to be a
                                                   just 3.49%, down three hundredths of a percentage
04-07                                                                                                          likelihood of a big economic surprise on the horizon,
01-07                                              point from last week. Certainly, there are savings to
                                                                                                               so mortgage rates will probably continue to drift.
10-06                                              be had for borrowers willing to accept some future
07-06                                              interest-rate risk.
04-06
01-06                                              Of course, folks without jobs don't buy homes. It
10-05                                              would appear that even folks with jobs are staying
07-05
04-05
                                                   away, too. New Home Sales did bounce 7.2% higher
01-05                                              in April when compared against March, but the
     3.0%   4.0%   5.0%   6.0%   7.0%   8.0%       323,000 annualized rate of sale was certainly nothing
                                                   to get excited about, since something on the order of
                                                   triple that would be closer to normal. Inventories has
                                          San Francisco Homes: Sold Prices & Unit Sales
                                                       (3-month moving average — $000's)
The chart above shows the Na-
tional monthly average for 30-           $1,500                                                                                                                 300
year fixed rate mortgages as             $1,300                                                                                                                 250
compiled by HSH.com. The av-
erage includes mortgages of all          $1,100                                                                                                                 200
sizes, including conforming,               $900                                                                                                                 150
"expanded conforming," and
jumbo.                                     $700                                                                                                                 100
                                           $500                                                                                                                 50
                                           $300                                                                                                                 0
                                                    0 FMAMJ JA SOND0 FMAMJ JA SOND0 FMAMJ JA SOND0 FMAMJ JA SOND1 FMAMJ JA SOND1 FMAM
                                                    6              7              8              9              0              1
                                                 Ave         Med        Units

                                                                                            May Sales Statistics
                                        (Single-family Homes)
                                                                   Prices            Unit                    Change from last year       Change from last month
                                                          Median Average Sales DOM SP/LP                     Median Average      Sales    Median Average      Sales
                                          San Francisco $ 715,000 $1,002,056 209 64 99.0%                     -4.7%    1.4%     -11.4%     -1.4%    -2.3%      9.4%
                                          D1: Northw est $ 917,500      $1,074,775     20      54   99.8%      8.3%    -12.6%    11.1%    -33.5%    -28.8%      0.0%
                                        D2: Central West $ 675,000      $ 720,994      33      55   99.9%      -6.3%    -2.0%   -34.0%      6.1%      5.0%     26.9%
                                          D3: Southw est $ 468,500      $ 544,052      17     107   97.9%     -13.6%   -14.9%    -5.6%    -22.7%     -7.9%     -5.6%
                                         D4: Tw in Peaks $ 785,000      $ 893,158      30      54 102.4%      -11.5%   -15.4%    11.1%      1.9%     -6.0%     20.0%
                                               D5: Central $1,260,000   $1,418,100     34      42 100.3%      -12.3%    -7.9%    41.7%      0.9%     -7.8%     25.9%
                                        D6: Central North $ 661,000     $ 813,667       3      58   97.7%     -51.1%   -38.1%   -40.0%    -61.4%    -57.8%    -25.0%
                                                D7: North $3,244,769    $3,463,030      9      81   93.8%     10.0%     -3.3%   -18.2%     38.2%     14.2%     12.5%
                                           D8: Northeast $1,806,500     $2,794,850      4      66   99.6%     -21.5%   21.5%    100.0%     27.9%     63.8%      0.0%
                                         D9: Central East $ 725,000     $ 839,360      25      60   99.5%     -10.7%    -0.9%    13.6%      4.3%     11.9%     13.6%
Page 2                                    D10: Southeast $ 424,000      $ 415,024      34      89   97.1%     -17.7%   -15.2%   -43.3%      1.0%     -7.9%     -8.1%
San Francisco Homes: Year-Over-Year Median Sales Price Change
30.0%

20.0%

10.0%

  0.0%
       0 FMAMJ JA SOND0 FMAMJ JA SOND0 FMAMJ JA SOND0 FMAMJ JA SOND1 FMAMJ JA SOND1 FMAM
-10.0% 6              7              8              9              0              1
-20.0%

-30.0%

-40.0%

FORECLOSURE STATISTICS
Notices of default, the first step in the foreclosure pro-       property will be sold to the third party; if not, it will go
cess, in San Francisco decreased 21.8% in April from             back to the bank and become part of that bank's REO
the year before. There were 154 notices filed.                   inventory.
Notices of sale, which set the date and time of an auc-          In March, cancellations were up 22.4% from the year
tion, and serve as the homeowner's final notice before           before, which is a positive sign.
sale, declined 23.9% from March, and were down 1.2%
                                                                 Properties going back-to-bank declined 1.8% year-over-
year-over-year. There were 162 notices filed.
                                                                 year.
After the filing of a Notice of Trustee Sale, there are
                                                                 The total number of homes that have had a notice of
only three possible outcomes. First, the sale can be
                                                                 default filed increased by 1.1% compared to last year.
cancelled for reasons that include a successful loan
modification or short sale, a filing error, or a legal re-       The total number of homes scheduled for sale de-
quirement to re-file the notice after extended postpone-         creased by 5.6%.
ments. Alternatively, if the property is taken to sale, the
bank will place the opening bid. If a third party, typically
an investor, bids more than the bank's opening bid, the                                                    (Continued on page 4)


San Francisco Condos: Sold Prices & Unit Sales
            (3-month moving average — $000's)

$1,000                                                                                                                          350
  $900                                                                                                                          300        Table Definitions
                                                                                                                                           _______________
  $800                                                                                                                          250
  $700                                                                                                                          200
                                                                                                                                               Median Price
  $600                                                                                                                          150    The price at which 50% of pric-
  $500                                                                                                                          100     es were higher and 50%were
                                                                                                                                                    lower.
  $400                                                                                                                          50
  $300                                                                                                                          0             Average Price
           0 FMAMJ JA SOND0 FMAMJ JA SOND0 FMAMJ JA SOND0 FMAMJ JA SOND1 FMAMJ JA SOND1 FMAM                                           Add all prices and divide by the
           6              7              8              9              0              1                                                        number of sales.
       Ave         Med          Units

                                                    May Sales Statistics                                                                           SP/LP
                                                                                                                                       Sales price to list price ratio or
(Condos/TICs/Co-ops/Lofts)                                                                                                             the price paid for the property
                          Prices             Unit                    Change from last year          Change from last month              divided by the asking price.
                  Median Average Sales DOM SP/LP                     Median Average         Sales    Median Average          Sales
  San Francisco $ 695,000 $ 846,713 243  78 98.2%                      7.6%   16.6%        -15.6%      3.7%    5.5%           5.2%                   DOI
                                                                                                                                       Days of Inventory, or how many
   D1: Northw est $ 592,500     $ 752,538       13     79    97.6%    -19.1%      4.6%       8.3%      -0.4%       1.6%      85.7%     days it would take to sell all the
 D2: Central West $ 746,500     $ 746,500        2     46    99.6%    40.6%      42.7%     -66.7%      -5.2%      -3.1%     -50.0%     property for sale at the current
                                                                                                                                                rate of sales.
  D3: Southw est $ 380,000      $ 348,750        4     66    97.9%     4.1%       -5.4%    -33.3%      22.6%      15.0%     -33.3%
 D4: Tw in Peaks $ 345,000      $ 355,143        7    137    96.7%    -19.9%    -19.9%     -30.0%     -25.0%     -25.0%      40.0%                  Pend
     D5: Central $ 848,750      $ 858,914       44     68 100.1%      12.0%      10.0%       4.8%       9.4%       5.8%      12.8%     Property under contract to sell
                                                                                                                                         that hasn’t closed escrow.
D6: Central North $ 708,250     $ 706,192       22     67    99.2%    16.2%      16.2%     -31.3%      18.0%      16.0%         4.8%
         D7: North $1,063,750   $1,209,209      30     62    96.8%    14.7%      14.1%       3.4%      -3.3%       3.5%      36.4%
                                                                                                                                                    Inven
   D8: Northeast $ 712,000      $ 919,765       46     79    98.3%    13.9%       8.2%      -4.2%      12.1%       3.6%      12.2%      Number of properties actively
 D9: Central East $ 590,000     $ 793,774       73     87    97.8%     -9.2%     15.9%     -16.1%     -11.2%       0.0%     -11.0%     for sale as of the last day of the
                                                                                                                                                    month.
  D10: Southeast $ 367,450      $ 367,450        2    130    94.8%    -14.3%      -9.5% #VALUE!        18.5%      20.5%     -33.3%
THE REAL ESTATE REPORT
                            San Francisco

                 Robb Fleischer
                 American Marketing Systems, Inc.
                 2800 Van Ness Avenue
                 San Francisco, CA 94109


Go online to see the full report
with the district by district breakdown:
HTTP://WWW.AMSIRES.COM/STAFF/ROBB


(Continued from page 3)
                                                             San Francisco Homes: Sales Price/List Price Ratio
                                                            108.0%
Unfortunately, the number of homes owned by                 106.0%
the bank rose 20% year-over-year. Banks now                 104.0%
own upwards of 750 properties in San Francis-               102.0%
co. At the current rate of sales, this is almost a          100.0%
two month supply.                                            98.0%
                                                             96.0%
While the total number of properties which have              94.0%
had either a foreclosure notice or a notice of               92.0%
sale have declined, the increase in the number               90.0%
                                                                     0FMAMJJASOND0 FMAMJJASOND0FMAMJJASOND0 FMAMJJASOND1FMAMJJASOND1FMAM
of properties going back to the back is worri-                       6           7            8           9            0           1
some.


                                                             San Francisco Homes: Days on Market
                                                            90
                                                            80
                                                            70
                                                            60
                                                            50
                                                            40
                                                            30
                                                            20
                                                            10
                                                             0
                                                                 0 FMAMJ JASOND0 FMAMJ JASOND0 FMAMJ JASOND0 FMAMJ JASOND1 FMAMJ JASOND1 FMAM
                                                                 6             7             8             9             0             1


                                    The Real Estate Market Trends Report is published and copyrighted by http://rereport.com.

More Related Content

What's hot

Annie Williams Market Trends July-Aug 2015
Annie Williams Market Trends July-Aug 2015Annie Williams Market Trends July-Aug 2015
Annie Williams Market Trends July-Aug 2015Jon Weaver
 
Prices Up, Home Sales Down - The Real Estate Report February/March
Prices Up, Home Sales Down - The Real Estate Report February/MarchPrices Up, Home Sales Down - The Real Estate Report February/March
Prices Up, Home Sales Down - The Real Estate Report February/MarchAMSI, San Francisco
 
Wal Mart Store FinancialOctober 11/08/07
Wal Mart Store FinancialOctober 	11/08/07Wal Mart Store FinancialOctober 	11/08/07
Wal Mart Store FinancialOctober 11/08/07finance1
 
Toronto real estate statistics may 2011
Toronto real estate statistics may 2011Toronto real estate statistics may 2011
Toronto real estate statistics may 2011John Helfrich
 
capital oneSanford C. Bernstein & Co. Strategic Decisions Conference Presenta...
capital oneSanford C. Bernstein & Co. Strategic Decisions Conference Presenta...capital oneSanford C. Bernstein & Co. Strategic Decisions Conference Presenta...
capital oneSanford C. Bernstein & Co. Strategic Decisions Conference Presenta...finance13
 
Median Home Price Stays Over $1MM - July/August Real Estate Report
Median Home Price Stays Over $1MM - July/August Real Estate ReportMedian Home Price Stays Over $1MM - July/August Real Estate Report
Median Home Price Stays Over $1MM - July/August Real Estate ReportAMSI, San Francisco
 
Home Prices Resume Upward Trend - May/June Real Estate Report
Home Prices Resume Upward Trend - May/June Real Estate ReportHome Prices Resume Upward Trend - May/June Real Estate Report
Home Prices Resume Upward Trend - May/June Real Estate ReportAMSI, San Francisco
 
Sequoia Capital - Economic Crisis and Venture Capital
Sequoia Capital - Economic Crisis and Venture CapitalSequoia Capital - Economic Crisis and Venture Capital
Sequoia Capital - Economic Crisis and Venture Capitalgarvfinancial
 
Sequoia Capital downturn presentation
Sequoia Capital downturn presentationSequoia Capital downturn presentation
Sequoia Capital downturn presentationguest14c91
 
Annie Williams Real Estate Report - July 2020
Annie Williams Real Estate Report - July 2020Annie Williams Real Estate Report - July 2020
Annie Williams Real Estate Report - July 2020Jon Weaver
 
Relief in Sight? - Real Estate Report March/April
Relief in Sight? - Real Estate Report March/AprilRelief in Sight? - Real Estate Report March/April
Relief in Sight? - Real Estate Report March/AprilAMSI, San Francisco
 
Home Sales Pop in March - Real Estate Report April/May
Home Sales Pop in March - Real Estate Report April/MayHome Sales Pop in March - Real Estate Report April/May
Home Sales Pop in March - Real Estate Report April/MayAMSI, San Francisco
 
Fraser Valley Real Estate Statistics Dec 2011
Fraser Valley Real Estate Statistics Dec 2011Fraser Valley Real Estate Statistics Dec 2011
Fraser Valley Real Estate Statistics Dec 2011Andrew Hudson
 

What's hot (17)

La00001 single family_lafayette
La00001 single family_lafayetteLa00001 single family_lafayette
La00001 single family_lafayette
 
June 2014 Report
June 2014 ReportJune 2014 Report
June 2014 Report
 
Annie Williams Market Trends July-Aug 2015
Annie Williams Market Trends July-Aug 2015Annie Williams Market Trends July-Aug 2015
Annie Williams Market Trends July-Aug 2015
 
Prices Up, Home Sales Down - The Real Estate Report February/March
Prices Up, Home Sales Down - The Real Estate Report February/MarchPrices Up, Home Sales Down - The Real Estate Report February/March
Prices Up, Home Sales Down - The Real Estate Report February/March
 
Wal Mart Store FinancialOctober 11/08/07
Wal Mart Store FinancialOctober 	11/08/07Wal Mart Store FinancialOctober 	11/08/07
Wal Mart Store FinancialOctober 11/08/07
 
Toronto real estate statistics may 2011
Toronto real estate statistics may 2011Toronto real estate statistics may 2011
Toronto real estate statistics may 2011
 
September 2018 Realtor Report
September 2018 Realtor ReportSeptember 2018 Realtor Report
September 2018 Realtor Report
 
capital oneSanford C. Bernstein & Co. Strategic Decisions Conference Presenta...
capital oneSanford C. Bernstein & Co. Strategic Decisions Conference Presenta...capital oneSanford C. Bernstein & Co. Strategic Decisions Conference Presenta...
capital oneSanford C. Bernstein & Co. Strategic Decisions Conference Presenta...
 
Median Home Price Stays Over $1MM - July/August Real Estate Report
Median Home Price Stays Over $1MM - July/August Real Estate ReportMedian Home Price Stays Over $1MM - July/August Real Estate Report
Median Home Price Stays Over $1MM - July/August Real Estate Report
 
Home Prices Resume Upward Trend - May/June Real Estate Report
Home Prices Resume Upward Trend - May/June Real Estate ReportHome Prices Resume Upward Trend - May/June Real Estate Report
Home Prices Resume Upward Trend - May/June Real Estate Report
 
Sequoia Capital - Economic Crisis and Venture Capital
Sequoia Capital - Economic Crisis and Venture CapitalSequoia Capital - Economic Crisis and Venture Capital
Sequoia Capital - Economic Crisis and Venture Capital
 
Sequoiapdf
SequoiapdfSequoiapdf
Sequoiapdf
 
Sequoia Capital downturn presentation
Sequoia Capital downturn presentationSequoia Capital downturn presentation
Sequoia Capital downturn presentation
 
Annie Williams Real Estate Report - July 2020
Annie Williams Real Estate Report - July 2020Annie Williams Real Estate Report - July 2020
Annie Williams Real Estate Report - July 2020
 
Relief in Sight? - Real Estate Report March/April
Relief in Sight? - Real Estate Report March/AprilRelief in Sight? - Real Estate Report March/April
Relief in Sight? - Real Estate Report March/April
 
Home Sales Pop in March - Real Estate Report April/May
Home Sales Pop in March - Real Estate Report April/MayHome Sales Pop in March - Real Estate Report April/May
Home Sales Pop in March - Real Estate Report April/May
 
Fraser Valley Real Estate Statistics Dec 2011
Fraser Valley Real Estate Statistics Dec 2011Fraser Valley Real Estate Statistics Dec 2011
Fraser Valley Real Estate Statistics Dec 2011
 

Viewers also liked

Jumbo Loans Cheaper Than Conforming Loans - The Real Estate Report September/...
Jumbo Loans Cheaper Than Conforming Loans - The Real Estate Report September/...Jumbo Loans Cheaper Than Conforming Loans - The Real Estate Report September/...
Jumbo Loans Cheaper Than Conforming Loans - The Real Estate Report September/...AMSI, San Francisco
 
Median Price for Homes at Record High - The Real Estate Report March/April
Median Price for Homes at Record High - The Real Estate Report March/AprilMedian Price for Homes at Record High - The Real Estate Report March/April
Median Price for Homes at Record High - The Real Estate Report March/AprilAMSI, San Francisco
 
C.A.R’s 2014 Housing Forecast - The Real Estate Report December/January
C.A.R’s 2014 Housing Forecast - The Real Estate Report December/JanuaryC.A.R’s 2014 Housing Forecast - The Real Estate Report December/January
C.A.R’s 2014 Housing Forecast - The Real Estate Report December/JanuaryAMSI, San Francisco
 
Inventory Dominates Market - The Real Estate Report April/Mai
Inventory Dominates Market -  The Real Estate Report April/MaiInventory Dominates Market -  The Real Estate Report April/Mai
Inventory Dominates Market - The Real Estate Report April/MaiAMSI, San Francisco
 
Real Estate Report December/January
Real Estate Report December/JanuaryReal Estate Report December/January
Real Estate Report December/JanuaryAMSI, San Francisco
 
Obtaining a Mortgage to Get More Difficult - The Real Estate Report November/...
Obtaining a Mortgage to Get More Difficult - The Real Estate Report November/...Obtaining a Mortgage to Get More Difficult - The Real Estate Report November/...
Obtaining a Mortgage to Get More Difficult - The Real Estate Report November/...AMSI, San Francisco
 
Lack of Inventory Plagues Market - Real Estate Report August/September
Lack of Inventory Plagues Market - Real Estate Report August/SeptemberLack of Inventory Plagues Market - Real Estate Report August/September
Lack of Inventory Plagues Market - Real Estate Report August/SeptemberAMSI, San Francisco
 
Buyers' Fatigue? - The Real Estate Report June/July
Buyers' Fatigue? - The Real Estate Report June/JulyBuyers' Fatigue? - The Real Estate Report June/July
Buyers' Fatigue? - The Real Estate Report June/JulyAMSI, San Francisco
 
Spring Surge Continues - The Real Estate Report May/June
Spring Surge Continues - The Real Estate Report May/JuneSpring Surge Continues - The Real Estate Report May/June
Spring Surge Continues - The Real Estate Report May/JuneAMSI, San Francisco
 
Prices Reach All-Time Highs, Again - Real Estate Report July/August
Prices Reach All-Time Highs, Again - Real Estate Report July/AugustPrices Reach All-Time Highs, Again - Real Estate Report July/August
Prices Reach All-Time Highs, Again - Real Estate Report July/AugustAMSI, San Francisco
 
Market Takes a Breather - Real Estate Report September/October
Market Takes a Breather - Real Estate Report September/OctoberMarket Takes a Breather - Real Estate Report September/October
Market Takes a Breather - Real Estate Report September/OctoberAMSI, San Francisco
 
Quantitative Easing and Mortgage Rates - Real Estate Report November/December
Quantitative Easing and Mortgage Rates - Real Estate Report November/DecemberQuantitative Easing and Mortgage Rates - Real Estate Report November/December
Quantitative Easing and Mortgage Rates - Real Estate Report November/DecemberAMSI, San Francisco
 
Fotosintesis.ppt
Fotosintesis.pptFotosintesis.ppt
Fotosintesis.pptdwicantik
 

Viewers also liked (13)

Jumbo Loans Cheaper Than Conforming Loans - The Real Estate Report September/...
Jumbo Loans Cheaper Than Conforming Loans - The Real Estate Report September/...Jumbo Loans Cheaper Than Conforming Loans - The Real Estate Report September/...
Jumbo Loans Cheaper Than Conforming Loans - The Real Estate Report September/...
 
Median Price for Homes at Record High - The Real Estate Report March/April
Median Price for Homes at Record High - The Real Estate Report March/AprilMedian Price for Homes at Record High - The Real Estate Report March/April
Median Price for Homes at Record High - The Real Estate Report March/April
 
C.A.R’s 2014 Housing Forecast - The Real Estate Report December/January
C.A.R’s 2014 Housing Forecast - The Real Estate Report December/JanuaryC.A.R’s 2014 Housing Forecast - The Real Estate Report December/January
C.A.R’s 2014 Housing Forecast - The Real Estate Report December/January
 
Inventory Dominates Market - The Real Estate Report April/Mai
Inventory Dominates Market -  The Real Estate Report April/MaiInventory Dominates Market -  The Real Estate Report April/Mai
Inventory Dominates Market - The Real Estate Report April/Mai
 
Real Estate Report December/January
Real Estate Report December/JanuaryReal Estate Report December/January
Real Estate Report December/January
 
Obtaining a Mortgage to Get More Difficult - The Real Estate Report November/...
Obtaining a Mortgage to Get More Difficult - The Real Estate Report November/...Obtaining a Mortgage to Get More Difficult - The Real Estate Report November/...
Obtaining a Mortgage to Get More Difficult - The Real Estate Report November/...
 
Lack of Inventory Plagues Market - Real Estate Report August/September
Lack of Inventory Plagues Market - Real Estate Report August/SeptemberLack of Inventory Plagues Market - Real Estate Report August/September
Lack of Inventory Plagues Market - Real Estate Report August/September
 
Buyers' Fatigue? - The Real Estate Report June/July
Buyers' Fatigue? - The Real Estate Report June/JulyBuyers' Fatigue? - The Real Estate Report June/July
Buyers' Fatigue? - The Real Estate Report June/July
 
Spring Surge Continues - The Real Estate Report May/June
Spring Surge Continues - The Real Estate Report May/JuneSpring Surge Continues - The Real Estate Report May/June
Spring Surge Continues - The Real Estate Report May/June
 
Prices Reach All-Time Highs, Again - Real Estate Report July/August
Prices Reach All-Time Highs, Again - Real Estate Report July/AugustPrices Reach All-Time Highs, Again - Real Estate Report July/August
Prices Reach All-Time Highs, Again - Real Estate Report July/August
 
Market Takes a Breather - Real Estate Report September/October
Market Takes a Breather - Real Estate Report September/OctoberMarket Takes a Breather - Real Estate Report September/October
Market Takes a Breather - Real Estate Report September/October
 
Quantitative Easing and Mortgage Rates - Real Estate Report November/December
Quantitative Easing and Mortgage Rates - Real Estate Report November/DecemberQuantitative Easing and Mortgage Rates - Real Estate Report November/December
Quantitative Easing and Mortgage Rates - Real Estate Report November/December
 
Fotosintesis.ppt
Fotosintesis.pptFotosintesis.ppt
Fotosintesis.ppt
 

Similar to Real Estate Report June/July

The Road To Recovery Will Be Full of Fits & Starts - The Real Estate Report S...
The Road To Recovery Will Be Full of Fits & Starts - The Real Estate Report S...The Road To Recovery Will Be Full of Fits & Starts - The Real Estate Report S...
The Road To Recovery Will Be Full of Fits & Starts - The Real Estate Report S...AMSI, San Francisco
 
Annie Williams Market Trends July-Aug 2014
Annie Williams Market Trends July-Aug 2014Annie Williams Market Trends July-Aug 2014
Annie Williams Market Trends July-Aug 2014Jon Weaver
 
AnnieWilliams Market Trends Oct-Nov 2014
AnnieWilliams Market Trends Oct-Nov 2014AnnieWilliams Market Trends Oct-Nov 2014
AnnieWilliams Market Trends Oct-Nov 2014Jon Weaver
 
Annie Williams Real Estate Report Nov-Dec 2015
Annie Williams Real Estate Report Nov-Dec 2015Annie Williams Real Estate Report Nov-Dec 2015
Annie Williams Real Estate Report Nov-Dec 2015Jon Weaver
 
Annie Williams Market Trends Jan-Feb 2014
Annie Williams Market Trends Jan-Feb 2014Annie Williams Market Trends Jan-Feb 2014
Annie Williams Market Trends Jan-Feb 2014Jon Weaver
 
Annie Williams Market Trends June/July 2014
Annie Williams Market Trends June/July 2014Annie Williams Market Trends June/July 2014
Annie Williams Market Trends June/July 2014Jon Weaver
 
San Francisco Prices Set Record Highs in 2013 - The Real Estate Report Januar...
San Francisco Prices Set Record Highs in 2013 - The Real Estate Report Januar...San Francisco Prices Set Record Highs in 2013 - The Real Estate Report Januar...
San Francisco Prices Set Record Highs in 2013 - The Real Estate Report Januar...AMSI, San Francisco
 
Annie Williams Real Estate Report May-June 2017
Annie Williams Real Estate Report May-June 2017Annie Williams Real Estate Report May-June 2017
Annie Williams Real Estate Report May-June 2017Jon Weaver
 
Annie Williams Real Estate Report - Jan 2016
Annie Williams Real Estate Report - Jan 2016Annie Williams Real Estate Report - Jan 2016
Annie Williams Real Estate Report - Jan 2016Jon Weaver
 
Case-Shiller Report Slowing Price Increases - Real Estate Report October/Nove...
Case-Shiller Report Slowing Price Increases - Real Estate Report October/Nove...Case-Shiller Report Slowing Price Increases - Real Estate Report October/Nove...
Case-Shiller Report Slowing Price Increases - Real Estate Report October/Nove...AMSI, San Francisco
 
Annie Williams Market Trends March-April 2015
Annie Williams Market Trends March-April 2015Annie Williams Market Trends March-April 2015
Annie Williams Market Trends March-April 2015Jon Weaver
 
Market Takes a Breather - The Real Estate Report July/August
Market Takes a Breather -  The Real Estate Report July/AugustMarket Takes a Breather -  The Real Estate Report July/August
Market Takes a Breather - The Real Estate Report July/AugustAMSI, San Francisco
 
Annie Williams Market Trends Mar & Apr 2014
Annie Williams Market Trends Mar & Apr 2014Annie Williams Market Trends Mar & Apr 2014
Annie Williams Market Trends Mar & Apr 2014Jon Weaver
 
Annie Williams Real Estate Report - Feb 2023
Annie Williams Real Estate Report - Feb 2023Annie Williams Real Estate Report - Feb 2023
Annie Williams Real Estate Report - Feb 2023Annie Williams
 
Annie Williams: Real Estate Report July/Aug 2013
Annie Williams: Real Estate Report July/Aug 2013Annie Williams: Real Estate Report July/Aug 2013
Annie Williams: Real Estate Report July/Aug 2013Jon Weaver
 
Annie Williams Market Trends June-July 2015
Annie Williams Market Trends June-July 2015Annie Williams Market Trends June-July 2015
Annie Williams Market Trends June-July 2015Jon Weaver
 

Similar to Real Estate Report June/July (20)

The Road To Recovery Will Be Full of Fits & Starts - The Real Estate Report S...
The Road To Recovery Will Be Full of Fits & Starts - The Real Estate Report S...The Road To Recovery Will Be Full of Fits & Starts - The Real Estate Report S...
The Road To Recovery Will Be Full of Fits & Starts - The Real Estate Report S...
 
Annie Williams Market Trends July-Aug 2014
Annie Williams Market Trends July-Aug 2014Annie Williams Market Trends July-Aug 2014
Annie Williams Market Trends July-Aug 2014
 
Srmag june2011 stats
Srmag june2011 statsSrmag june2011 stats
Srmag june2011 stats
 
AnnieWilliams Market Trends Oct-Nov 2014
AnnieWilliams Market Trends Oct-Nov 2014AnnieWilliams Market Trends Oct-Nov 2014
AnnieWilliams Market Trends Oct-Nov 2014
 
Annie Williams Real Estate Report Nov-Dec 2015
Annie Williams Real Estate Report Nov-Dec 2015Annie Williams Real Estate Report Nov-Dec 2015
Annie Williams Real Estate Report Nov-Dec 2015
 
Annie Williams Market Trends Jan-Feb 2014
Annie Williams Market Trends Jan-Feb 2014Annie Williams Market Trends Jan-Feb 2014
Annie Williams Market Trends Jan-Feb 2014
 
Annie Williams Market Trends June/July 2014
Annie Williams Market Trends June/July 2014Annie Williams Market Trends June/July 2014
Annie Williams Market Trends June/July 2014
 
San Francisco Prices Set Record Highs in 2013 - The Real Estate Report Januar...
San Francisco Prices Set Record Highs in 2013 - The Real Estate Report Januar...San Francisco Prices Set Record Highs in 2013 - The Real Estate Report Januar...
San Francisco Prices Set Record Highs in 2013 - The Real Estate Report Januar...
 
Annie Williams Real Estate Report May-June 2017
Annie Williams Real Estate Report May-June 2017Annie Williams Real Estate Report May-June 2017
Annie Williams Real Estate Report May-June 2017
 
Annie Williams Real Estate Report - Jan 2016
Annie Williams Real Estate Report - Jan 2016Annie Williams Real Estate Report - Jan 2016
Annie Williams Real Estate Report - Jan 2016
 
Case-Shiller Report Slowing Price Increases - Real Estate Report October/Nove...
Case-Shiller Report Slowing Price Increases - Real Estate Report October/Nove...Case-Shiller Report Slowing Price Increases - Real Estate Report October/Nove...
Case-Shiller Report Slowing Price Increases - Real Estate Report October/Nove...
 
Annie Williams Market Trends March-April 2015
Annie Williams Market Trends March-April 2015Annie Williams Market Trends March-April 2015
Annie Williams Market Trends March-April 2015
 
Market Takes a Breather - The Real Estate Report July/August
Market Takes a Breather -  The Real Estate Report July/AugustMarket Takes a Breather -  The Real Estate Report July/August
Market Takes a Breather - The Real Estate Report July/August
 
Annie Williams Market Trends Mar & Apr 2014
Annie Williams Market Trends Mar & Apr 2014Annie Williams Market Trends Mar & Apr 2014
Annie Williams Market Trends Mar & Apr 2014
 
Annie Williams Real Estate Report - Feb 2023
Annie Williams Real Estate Report - Feb 2023Annie Williams Real Estate Report - Feb 2023
Annie Williams Real Estate Report - Feb 2023
 
Robb fleischersf 2019feb
Robb fleischersf 2019febRobb fleischersf 2019feb
Robb fleischersf 2019feb
 
Annie Williams: Real Estate Report July/Aug 2013
Annie Williams: Real Estate Report July/Aug 2013Annie Williams: Real Estate Report July/Aug 2013
Annie Williams: Real Estate Report July/Aug 2013
 
Annie Williams Market Trends June-July 2015
Annie Williams Market Trends June-July 2015Annie Williams Market Trends June-July 2015
Annie Williams Market Trends June-July 2015
 
8
88
8
 
March 2015 Realtor Report
March 2015 Realtor ReportMarch 2015 Realtor Report
March 2015 Realtor Report
 

Recently uploaded

9990771857 Call Girls in Dwarka Sector 6 Delhi (Call Girls) Delhi
9990771857 Call Girls in Dwarka Sector 6 Delhi (Call Girls) Delhi9990771857 Call Girls in Dwarka Sector 6 Delhi (Call Girls) Delhi
9990771857 Call Girls in Dwarka Sector 6 Delhi (Call Girls) Delhidelhimodel235
 
9990771857 Call Girls Dwarka Sector 8 Delhi (Call Girls ) Delhi
9990771857 Call Girls  Dwarka Sector 8 Delhi (Call Girls ) Delhi9990771857 Call Girls  Dwarka Sector 8 Delhi (Call Girls ) Delhi
9990771857 Call Girls Dwarka Sector 8 Delhi (Call Girls ) Delhidelhimodel235
 
Purva Soukhyam in Guduvancheri Chennai.pdf
Purva Soukhyam in Guduvancheri Chennai.pdfPurva Soukhyam in Guduvancheri Chennai.pdf
Purva Soukhyam in Guduvancheri Chennai.pdfpritika141199
 
BDSM⚡Call Girls in Sector 57 Noida Escorts >༒8448380779 Escort Service
BDSM⚡Call Girls in Sector 57 Noida Escorts >༒8448380779 Escort ServiceBDSM⚡Call Girls in Sector 57 Noida Escorts >༒8448380779 Escort Service
BDSM⚡Call Girls in Sector 57 Noida Escorts >༒8448380779 Escort ServiceDelhi Call girls
 
Call Girls In Krishna Nagar Delhi (Escort)↫8447779280↬@SHOT 1500- NIGHT 5500→...
Call Girls In Krishna Nagar Delhi (Escort)↫8447779280↬@SHOT 1500- NIGHT 5500→...Call Girls In Krishna Nagar Delhi (Escort)↫8447779280↬@SHOT 1500- NIGHT 5500→...
Call Girls In Krishna Nagar Delhi (Escort)↫8447779280↬@SHOT 1500- NIGHT 5500→...asmaqueen5
 
2k Shot Call girls Karol Bagh Delhi 9205541914
2k Shot Call girls Karol Bagh Delhi 92055419142k Shot Call girls Karol Bagh Delhi 9205541914
2k Shot Call girls Karol Bagh Delhi 9205541914Delhi Call girls
 
Best Deal Virtual Space in Satya The Hive Tata Zudio 750 Sqft 1.89 Cr All inc...
Best Deal Virtual Space in Satya The Hive Tata Zudio 750 Sqft 1.89 Cr All inc...Best Deal Virtual Space in Satya The Hive Tata Zudio 750 Sqft 1.89 Cr All inc...
Best Deal Virtual Space in Satya The Hive Tata Zudio 750 Sqft 1.89 Cr All inc...ApartmentWala1
 
M3M 129 E Brochure Noida Expressway, Sector 129, Noida
M3M 129 E Brochure Noida Expressway, Sector 129, NoidaM3M 129 E Brochure Noida Expressway, Sector 129, Noida
M3M 129 E Brochure Noida Expressway, Sector 129, Noidasarak0han45400
 
Call Girls In Vasant Vihar Delhi 💯Call Us 🔝8264348440🔝
Call Girls In Vasant Vihar Delhi 💯Call Us 🔝8264348440🔝Call Girls In Vasant Vihar Delhi 💯Call Us 🔝8264348440🔝
Call Girls In Vasant Vihar Delhi 💯Call Us 🔝8264348440🔝soniya singh
 
Call Girls In Laxmi Nagar Delhi +91-8447779280! !Best Woman Seeking Man Escor...
Call Girls In Laxmi Nagar Delhi +91-8447779280! !Best Woman Seeking Man Escor...Call Girls In Laxmi Nagar Delhi +91-8447779280! !Best Woman Seeking Man Escor...
Call Girls In Laxmi Nagar Delhi +91-8447779280! !Best Woman Seeking Man Escor...asmaqueen5
 
Kohinoor Hinjewadi Phase 2 Pune E-Brochure.pdf
Kohinoor Hinjewadi Phase 2 Pune  E-Brochure.pdfKohinoor Hinjewadi Phase 2 Pune  E-Brochure.pdf
Kohinoor Hinjewadi Phase 2 Pune E-Brochure.pdfManishSaxena95
 
Enjoy Night ≽ 8448380779 ≼ Call Girls In Huda City Centre (Gurgaon)
Enjoy Night ≽ 8448380779 ≼ Call Girls In Huda City Centre (Gurgaon)Enjoy Night ≽ 8448380779 ≼ Call Girls In Huda City Centre (Gurgaon)
Enjoy Night ≽ 8448380779 ≼ Call Girls In Huda City Centre (Gurgaon)Delhi Call girls
 
Premium Villa Projects in Sarjapur Road Bengaluru
Premium Villa Projects in Sarjapur Road BengaluruPremium Villa Projects in Sarjapur Road Bengaluru
Premium Villa Projects in Sarjapur Road BengaluruShivaSeo3
 
Shapoorji Pallonji Joyville Vista Pune | Spend Your Family Time Together
Shapoorji Pallonji Joyville Vista Pune | Spend Your Family Time TogetherShapoorji Pallonji Joyville Vista Pune | Spend Your Family Time Together
Shapoorji Pallonji Joyville Vista Pune | Spend Your Family Time Togetheraidasheikh47
 
2k Shot Call girls Aiims Delhi 9205541914
2k Shot Call girls Aiims Delhi 92055419142k Shot Call girls Aiims Delhi 9205541914
2k Shot Call girls Aiims Delhi 9205541914Delhi Call girls
 
Majestique Viman Nagar Pune Brochure.pdf
Majestique Viman Nagar Pune Brochure.pdfMajestique Viman Nagar Pune Brochure.pdf
Majestique Viman Nagar Pune Brochure.pdfBabyrudram
 
9990771857 Call Girls in Dwarka Sector 137 Noida (Call Girls) Delhi
9990771857 Call Girls in Dwarka Sector 137 Noida (Call Girls) Delhi9990771857 Call Girls in Dwarka Sector 137 Noida (Call Girls) Delhi
9990771857 Call Girls in Dwarka Sector 137 Noida (Call Girls) Delhidelhimodel235
 
BDSM⚡Call Girls in Sector 55 Noida Escorts >༒8448380779 Escort Service
BDSM⚡Call Girls in Sector 55 Noida Escorts >༒8448380779 Escort ServiceBDSM⚡Call Girls in Sector 55 Noida Escorts >༒8448380779 Escort Service
BDSM⚡Call Girls in Sector 55 Noida Escorts >༒8448380779 Escort ServiceDelhi Call girls
 
Greater Vancouver Realtors Statistics Package April 2024
Greater Vancouver Realtors Statistics Package April 2024Greater Vancouver Realtors Statistics Package April 2024
Greater Vancouver Realtors Statistics Package April 2024VickyAulakh1
 
2k Shots ≽ 9205541914 ≼ Call Girls In Sainik Farm (Delhi)
2k Shots ≽ 9205541914 ≼ Call Girls In Sainik Farm (Delhi)2k Shots ≽ 9205541914 ≼ Call Girls In Sainik Farm (Delhi)
2k Shots ≽ 9205541914 ≼ Call Girls In Sainik Farm (Delhi)Delhi Call girls
 

Recently uploaded (20)

9990771857 Call Girls in Dwarka Sector 6 Delhi (Call Girls) Delhi
9990771857 Call Girls in Dwarka Sector 6 Delhi (Call Girls) Delhi9990771857 Call Girls in Dwarka Sector 6 Delhi (Call Girls) Delhi
9990771857 Call Girls in Dwarka Sector 6 Delhi (Call Girls) Delhi
 
9990771857 Call Girls Dwarka Sector 8 Delhi (Call Girls ) Delhi
9990771857 Call Girls  Dwarka Sector 8 Delhi (Call Girls ) Delhi9990771857 Call Girls  Dwarka Sector 8 Delhi (Call Girls ) Delhi
9990771857 Call Girls Dwarka Sector 8 Delhi (Call Girls ) Delhi
 
Purva Soukhyam in Guduvancheri Chennai.pdf
Purva Soukhyam in Guduvancheri Chennai.pdfPurva Soukhyam in Guduvancheri Chennai.pdf
Purva Soukhyam in Guduvancheri Chennai.pdf
 
BDSM⚡Call Girls in Sector 57 Noida Escorts >༒8448380779 Escort Service
BDSM⚡Call Girls in Sector 57 Noida Escorts >༒8448380779 Escort ServiceBDSM⚡Call Girls in Sector 57 Noida Escorts >༒8448380779 Escort Service
BDSM⚡Call Girls in Sector 57 Noida Escorts >༒8448380779 Escort Service
 
Call Girls In Krishna Nagar Delhi (Escort)↫8447779280↬@SHOT 1500- NIGHT 5500→...
Call Girls In Krishna Nagar Delhi (Escort)↫8447779280↬@SHOT 1500- NIGHT 5500→...Call Girls In Krishna Nagar Delhi (Escort)↫8447779280↬@SHOT 1500- NIGHT 5500→...
Call Girls In Krishna Nagar Delhi (Escort)↫8447779280↬@SHOT 1500- NIGHT 5500→...
 
2k Shot Call girls Karol Bagh Delhi 9205541914
2k Shot Call girls Karol Bagh Delhi 92055419142k Shot Call girls Karol Bagh Delhi 9205541914
2k Shot Call girls Karol Bagh Delhi 9205541914
 
Best Deal Virtual Space in Satya The Hive Tata Zudio 750 Sqft 1.89 Cr All inc...
Best Deal Virtual Space in Satya The Hive Tata Zudio 750 Sqft 1.89 Cr All inc...Best Deal Virtual Space in Satya The Hive Tata Zudio 750 Sqft 1.89 Cr All inc...
Best Deal Virtual Space in Satya The Hive Tata Zudio 750 Sqft 1.89 Cr All inc...
 
M3M 129 E Brochure Noida Expressway, Sector 129, Noida
M3M 129 E Brochure Noida Expressway, Sector 129, NoidaM3M 129 E Brochure Noida Expressway, Sector 129, Noida
M3M 129 E Brochure Noida Expressway, Sector 129, Noida
 
Call Girls In Vasant Vihar Delhi 💯Call Us 🔝8264348440🔝
Call Girls In Vasant Vihar Delhi 💯Call Us 🔝8264348440🔝Call Girls In Vasant Vihar Delhi 💯Call Us 🔝8264348440🔝
Call Girls In Vasant Vihar Delhi 💯Call Us 🔝8264348440🔝
 
Call Girls In Laxmi Nagar Delhi +91-8447779280! !Best Woman Seeking Man Escor...
Call Girls In Laxmi Nagar Delhi +91-8447779280! !Best Woman Seeking Man Escor...Call Girls In Laxmi Nagar Delhi +91-8447779280! !Best Woman Seeking Man Escor...
Call Girls In Laxmi Nagar Delhi +91-8447779280! !Best Woman Seeking Man Escor...
 
Kohinoor Hinjewadi Phase 2 Pune E-Brochure.pdf
Kohinoor Hinjewadi Phase 2 Pune  E-Brochure.pdfKohinoor Hinjewadi Phase 2 Pune  E-Brochure.pdf
Kohinoor Hinjewadi Phase 2 Pune E-Brochure.pdf
 
Enjoy Night ≽ 8448380779 ≼ Call Girls In Huda City Centre (Gurgaon)
Enjoy Night ≽ 8448380779 ≼ Call Girls In Huda City Centre (Gurgaon)Enjoy Night ≽ 8448380779 ≼ Call Girls In Huda City Centre (Gurgaon)
Enjoy Night ≽ 8448380779 ≼ Call Girls In Huda City Centre (Gurgaon)
 
Premium Villa Projects in Sarjapur Road Bengaluru
Premium Villa Projects in Sarjapur Road BengaluruPremium Villa Projects in Sarjapur Road Bengaluru
Premium Villa Projects in Sarjapur Road Bengaluru
 
Shapoorji Pallonji Joyville Vista Pune | Spend Your Family Time Together
Shapoorji Pallonji Joyville Vista Pune | Spend Your Family Time TogetherShapoorji Pallonji Joyville Vista Pune | Spend Your Family Time Together
Shapoorji Pallonji Joyville Vista Pune | Spend Your Family Time Together
 
2k Shot Call girls Aiims Delhi 9205541914
2k Shot Call girls Aiims Delhi 92055419142k Shot Call girls Aiims Delhi 9205541914
2k Shot Call girls Aiims Delhi 9205541914
 
Majestique Viman Nagar Pune Brochure.pdf
Majestique Viman Nagar Pune Brochure.pdfMajestique Viman Nagar Pune Brochure.pdf
Majestique Viman Nagar Pune Brochure.pdf
 
9990771857 Call Girls in Dwarka Sector 137 Noida (Call Girls) Delhi
9990771857 Call Girls in Dwarka Sector 137 Noida (Call Girls) Delhi9990771857 Call Girls in Dwarka Sector 137 Noida (Call Girls) Delhi
9990771857 Call Girls in Dwarka Sector 137 Noida (Call Girls) Delhi
 
BDSM⚡Call Girls in Sector 55 Noida Escorts >༒8448380779 Escort Service
BDSM⚡Call Girls in Sector 55 Noida Escorts >༒8448380779 Escort ServiceBDSM⚡Call Girls in Sector 55 Noida Escorts >༒8448380779 Escort Service
BDSM⚡Call Girls in Sector 55 Noida Escorts >༒8448380779 Escort Service
 
Greater Vancouver Realtors Statistics Package April 2024
Greater Vancouver Realtors Statistics Package April 2024Greater Vancouver Realtors Statistics Package April 2024
Greater Vancouver Realtors Statistics Package April 2024
 
2k Shots ≽ 9205541914 ≼ Call Girls In Sainik Farm (Delhi)
2k Shots ≽ 9205541914 ≼ Call Girls In Sainik Farm (Delhi)2k Shots ≽ 9205541914 ≼ Call Girls In Sainik Farm (Delhi)
2k Shots ≽ 9205541914 ≼ Call Girls In Sainik Farm (Delhi)
 

Real Estate Report June/July

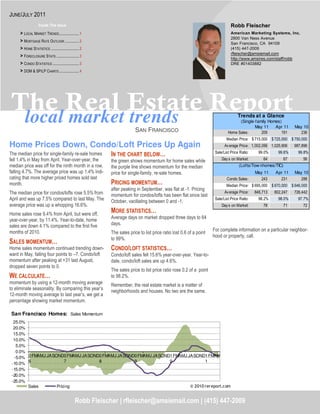
  • 1. JUNE/JULY 2011 Inside This Issue Robb Fleischer > LOCAL MARKET TRENDS ..................... 1 American Marketing Systems, Inc. > MORTGAGE RATE OUTLOOK ............... 2 2800 Van Ness Avenue San Francisco, CA 94109 > HOME STATISTICS .............................. 2 (415) 447-2009 > FORECLOSURE STATS ........................ 3 rfleischer@amsiemail.com http://www.amsires.com/staff/robb > CONDO STATISTICS ............................ 3 DRE #01403882 > DOM & SP/LP CHARTS ..................... 4 The Real Estate Report local market trends Trends at a Glance (Single-family Homes) May 11 Apr 11 May 10 SAN FRANCISCO Home Sales: 209 191 236 Median Price: $ 715,000 $ 725,000 $ 750,000 Home Prices Down, Condo/Loft Prices Up Again Av erage Price: 1,002,056 1,025,906 987,896 Sale/List Price Ratio: 99.0% 99.6% 99.8% The median price for single-family re-sale homes IN THE CHART BELOW… fell 1.4% in May from April. Year-over-year, the the green shows momentum for home sales while Day s on Market: 64 67 56 median price was off for the ninth month in a row, the purple line shows momentum for the median (Lofts/Tow nhomes/TIC) falling 4.7%. The average price was up 1.4% indi- price for single-family, re-sale homes. May 11 Apr 11 May 10 cating that more higher priced homes sold last Condo Sales: 243 231 288 month. PRICING MOMENTUM… Median Price: $ 695,000 $ 670,000 $ 646,000 after peaking in September, was flat at -1. Pricing The median price for condos/lofts rose 5.5% from Av erage Price: 846,713 802,247 726,442 momentum for condos/lofts has been flat since last April and was up 7.5% compared to last May. The October, vacillating between 0 and -1. Sale/List Price Ratio: 98.2% 98.0% 97.7% average price was up a whopping 16.6%. Day s on Market: 78 71 72 Home sales rose 9.4% from April, but were off, MORE STATISTICS… year-over-year, by 11.4%. Year-to-date, home Average days on market dropped three days to 64 sales are down 4.1% compared to the first five days. months of 2010. For complete information on a particular neighbor- The sales price to list price ratio lost 0.6 of a point hood or property, call. to 99%. SALES MOMENTUM… Home sales momentum continued trending down- CONDO/LOFT STATISTICS… ward in May, falling four points to –7. Condo/loft Condo/loft sales fell 15.6% year-over-year. Year-to- momentum after peaking at +31 last August, date, condo/loft sales are up 4.6%. dropped seven points to 0. The sales price to list price ratio rose 0.2 of a point WE CALCULATE… to 98.2%. momentum by using a 12-month moving average Remember, the real estate market is a matter of to eliminate seasonality. By comparing this year’s neighborhoods and houses. No two are the same. 12-month moving average to last year’s, we get a percentage showing market momentum. San Francisco Homes: Sales Momentum 25.0% 20.0% 15.0% 10.0% 5.0% 0.0% -5.0% 0 FMAMJ JA SOND0 FMAMJ JA SOND0 FMAMJ JA SOND0 FMAMJ JA SOND1 FMAMJ JA SOND1 FMAM 6 7 8 9 0 1 -10.0% -15.0% -20.0% -25.0% Sales Pricing © 2010 rereport.com Robb Fleischer | rfleischer@amsiemail.com | (415) 447-2009
  • 2. The Real Estate Report Mortgage Rate Outlook May 27, 2011 -- HSH.com's broad-market mortgage fallen to just 6.5 months available, and the 175,000 30-Year Fixed Mortgage Rates tracker -- our weekly Fixed-Rate Mortgage Indicator actual units on the market is the lowest figure in al- 04-11 (FRMI) -- found that the overall average rate for 30- most 50 years. Eventually, when demand for new 01-11 year fixed-rate mortgages slipped back by two more homes does return, a strong spate of homebuilding is 10-10 basis points this week, landing at an average of to be expected. Here's hoping it comes sooner than 07-10 4.88%, a fresh 2011 low. later, but 2012 seems to be the earliest at this point 04-10 for the turn in homebuilding. 01-10 FHA-backed 30-year fixed-rate mortgages are driving 10-09 sales of homes to first-time homebuyers, and also As to what happens, we'll need to wait and see. For 07-09 04-09 giving low-equity refinancers an option to pursue. now, mortgage rates are even more favorable than 01-09 Rates for these product also slipped back by two they have been at any time in 2011. If you can, it 10-08 basis points to finish the week at 4.49%. might be a good time to get your purchase or re- 07-08 finance done reasonably soon. Next week, we get 04-08 Given the wide differential in interest rates, at least both end-of-the-month and first-of the-month infor- 01-08 some borrowers should be considering hybrid 5/1 10-07 mation, including the employment report. It's a holi- ARMs; whose a five-year fixed periods now average 07-07 day-shortened week, and there doesn't seem to be a just 3.49%, down three hundredths of a percentage 04-07 likelihood of a big economic surprise on the horizon, 01-07 point from last week. Certainly, there are savings to so mortgage rates will probably continue to drift. 10-06 be had for borrowers willing to accept some future 07-06 interest-rate risk. 04-06 01-06 Of course, folks without jobs don't buy homes. It 10-05 would appear that even folks with jobs are staying 07-05 04-05 away, too. New Home Sales did bounce 7.2% higher 01-05 in April when compared against March, but the 3.0% 4.0% 5.0% 6.0% 7.0% 8.0% 323,000 annualized rate of sale was certainly nothing to get excited about, since something on the order of triple that would be closer to normal. Inventories has San Francisco Homes: Sold Prices & Unit Sales (3-month moving average — $000's) The chart above shows the Na- tional monthly average for 30- $1,500 300 year fixed rate mortgages as $1,300 250 compiled by HSH.com. The av- erage includes mortgages of all $1,100 200 sizes, including conforming, $900 150 "expanded conforming," and jumbo. $700 100 $500 50 $300 0 0 FMAMJ JA SOND0 FMAMJ JA SOND0 FMAMJ JA SOND0 FMAMJ JA SOND1 FMAMJ JA SOND1 FMAM 6 7 8 9 0 1 Ave Med Units May Sales Statistics (Single-family Homes) Prices Unit Change from last year Change from last month Median Average Sales DOM SP/LP Median Average Sales Median Average Sales San Francisco $ 715,000 $1,002,056 209 64 99.0% -4.7% 1.4% -11.4% -1.4% -2.3% 9.4% D1: Northw est $ 917,500 $1,074,775 20 54 99.8% 8.3% -12.6% 11.1% -33.5% -28.8% 0.0% D2: Central West $ 675,000 $ 720,994 33 55 99.9% -6.3% -2.0% -34.0% 6.1% 5.0% 26.9% D3: Southw est $ 468,500 $ 544,052 17 107 97.9% -13.6% -14.9% -5.6% -22.7% -7.9% -5.6% D4: Tw in Peaks $ 785,000 $ 893,158 30 54 102.4% -11.5% -15.4% 11.1% 1.9% -6.0% 20.0% D5: Central $1,260,000 $1,418,100 34 42 100.3% -12.3% -7.9% 41.7% 0.9% -7.8% 25.9% D6: Central North $ 661,000 $ 813,667 3 58 97.7% -51.1% -38.1% -40.0% -61.4% -57.8% -25.0% D7: North $3,244,769 $3,463,030 9 81 93.8% 10.0% -3.3% -18.2% 38.2% 14.2% 12.5% D8: Northeast $1,806,500 $2,794,850 4 66 99.6% -21.5% 21.5% 100.0% 27.9% 63.8% 0.0% D9: Central East $ 725,000 $ 839,360 25 60 99.5% -10.7% -0.9% 13.6% 4.3% 11.9% 13.6% Page 2 D10: Southeast $ 424,000 $ 415,024 34 89 97.1% -17.7% -15.2% -43.3% 1.0% -7.9% -8.1%
  • 3. San Francisco Homes: Year-Over-Year Median Sales Price Change 30.0% 20.0% 10.0% 0.0% 0 FMAMJ JA SOND0 FMAMJ JA SOND0 FMAMJ JA SOND0 FMAMJ JA SOND1 FMAMJ JA SOND1 FMAM -10.0% 6 7 8 9 0 1 -20.0% -30.0% -40.0% FORECLOSURE STATISTICS Notices of default, the first step in the foreclosure pro- property will be sold to the third party; if not, it will go cess, in San Francisco decreased 21.8% in April from back to the bank and become part of that bank's REO the year before. There were 154 notices filed. inventory. Notices of sale, which set the date and time of an auc- In March, cancellations were up 22.4% from the year tion, and serve as the homeowner's final notice before before, which is a positive sign. sale, declined 23.9% from March, and were down 1.2% Properties going back-to-bank declined 1.8% year-over- year-over-year. There were 162 notices filed. year. After the filing of a Notice of Trustee Sale, there are The total number of homes that have had a notice of only three possible outcomes. First, the sale can be default filed increased by 1.1% compared to last year. cancelled for reasons that include a successful loan modification or short sale, a filing error, or a legal re- The total number of homes scheduled for sale de- quirement to re-file the notice after extended postpone- creased by 5.6%. ments. Alternatively, if the property is taken to sale, the bank will place the opening bid. If a third party, typically an investor, bids more than the bank's opening bid, the (Continued on page 4) San Francisco Condos: Sold Prices & Unit Sales (3-month moving average — $000's) $1,000 350 $900 300 Table Definitions _______________ $800 250 $700 200 Median Price $600 150 The price at which 50% of pric- $500 100 es were higher and 50%were lower. $400 50 $300 0 Average Price 0 FMAMJ JA SOND0 FMAMJ JA SOND0 FMAMJ JA SOND0 FMAMJ JA SOND1 FMAMJ JA SOND1 FMAM Add all prices and divide by the 6 7 8 9 0 1 number of sales. Ave Med Units May Sales Statistics SP/LP Sales price to list price ratio or (Condos/TICs/Co-ops/Lofts) the price paid for the property Prices Unit Change from last year Change from last month divided by the asking price. Median Average Sales DOM SP/LP Median Average Sales Median Average Sales San Francisco $ 695,000 $ 846,713 243 78 98.2% 7.6% 16.6% -15.6% 3.7% 5.5% 5.2% DOI Days of Inventory, or how many D1: Northw est $ 592,500 $ 752,538 13 79 97.6% -19.1% 4.6% 8.3% -0.4% 1.6% 85.7% days it would take to sell all the D2: Central West $ 746,500 $ 746,500 2 46 99.6% 40.6% 42.7% -66.7% -5.2% -3.1% -50.0% property for sale at the current rate of sales. D3: Southw est $ 380,000 $ 348,750 4 66 97.9% 4.1% -5.4% -33.3% 22.6% 15.0% -33.3% D4: Tw in Peaks $ 345,000 $ 355,143 7 137 96.7% -19.9% -19.9% -30.0% -25.0% -25.0% 40.0% Pend D5: Central $ 848,750 $ 858,914 44 68 100.1% 12.0% 10.0% 4.8% 9.4% 5.8% 12.8% Property under contract to sell that hasn’t closed escrow. D6: Central North $ 708,250 $ 706,192 22 67 99.2% 16.2% 16.2% -31.3% 18.0% 16.0% 4.8% D7: North $1,063,750 $1,209,209 30 62 96.8% 14.7% 14.1% 3.4% -3.3% 3.5% 36.4% Inven D8: Northeast $ 712,000 $ 919,765 46 79 98.3% 13.9% 8.2% -4.2% 12.1% 3.6% 12.2% Number of properties actively D9: Central East $ 590,000 $ 793,774 73 87 97.8% -9.2% 15.9% -16.1% -11.2% 0.0% -11.0% for sale as of the last day of the month. D10: Southeast $ 367,450 $ 367,450 2 130 94.8% -14.3% -9.5% #VALUE! 18.5% 20.5% -33.3%
  • 4. THE REAL ESTATE REPORT San Francisco Robb Fleischer American Marketing Systems, Inc. 2800 Van Ness Avenue San Francisco, CA 94109 Go online to see the full report with the district by district breakdown: HTTP://WWW.AMSIRES.COM/STAFF/ROBB (Continued from page 3) San Francisco Homes: Sales Price/List Price Ratio 108.0% Unfortunately, the number of homes owned by 106.0% the bank rose 20% year-over-year. Banks now 104.0% own upwards of 750 properties in San Francis- 102.0% co. At the current rate of sales, this is almost a 100.0% two month supply. 98.0% 96.0% While the total number of properties which have 94.0% had either a foreclosure notice or a notice of 92.0% sale have declined, the increase in the number 90.0% 0FMAMJJASOND0 FMAMJJASOND0FMAMJJASOND0 FMAMJJASOND1FMAMJJASOND1FMAM of properties going back to the back is worri- 6 7 8 9 0 1 some. San Francisco Homes: Days on Market 90 80 70 60 50 40 30 20 10 0 0 FMAMJ JASOND0 FMAMJ JASOND0 FMAMJ JASOND0 FMAMJ JASOND1 FMAMJ JASOND1 FMAM 6 7 8 9 0 1 The Real Estate Market Trends Report is published and copyrighted by http://rereport.com.