SlideShare a Scribd company logo
1 of 27
Download to read offline
1
THE TWO-GAP MODEL OF ECONOMIC GROWTH IN NIGERIA: VECTOR
AUTOREGRESSION (VAR) APPROACH
Abstract
This paper explores the relevance and application of the theoretical prescriptions of the
Two-Gap model to the Nigerian economic growth situation from 1970-2007. A co-
integration test confirmed that long run relationship exists among the variables, giving an
indication that they have the tendency to reach equilibrium in the long run. It was
apparent from the results of the autoregression analysis that foreign aid does not give
clear evidence of an imperative growth factor in Nigeria, FDI does but is volatile. This
further confirmed the transfer paradox – which posits that foreign aid tends to immiserate
the recipient country. The endogeneity of aid on real GDP re-emphasizes the imperative
of economic reforms as a condition for aid. The study found no theoretical or empirical
justification for the assumption that filling a “trade gap” determined by “aid
requirements” will boost trade and growth in the Nigerian economy.
JEL Classification: F13; O11; C01
Key Words: Two-Gap Model, Economic Growth, Foreign Aid and FDI, Vector
Autoregression, Co integration.
1. Introduction
Nigeria with a population of over 150 million people, endowed with human and natural
resources, has agriculture as its mainstay and was the largest exporter of cocoa, coffee,
and rubber to mention but a few. Paradoxically, the oil boom of 1970s was a period when
the revenue realized from oil should have improved the lives of many Nigerians, but alas
reverse was the case. The huge revenue from oil resulted in the neglect of the agricultural
sector such that Nigeria’s economy was reduced to a mono-cultural economy. Our pattern
of production also become faulty to the extent that the ripple effect of the economic*
problem resulting from oil as a main source of export led to the collapse of the textile and
some industries; most especially the manufacturing industry. Consequently, Nigerian
economy productive capacity runs below expectation. From the foregoing, two major
economic problems emerge and these are inadequate savings and a deteriorating terms of
trade. At the time when other countries in the world were expanding, Nigerian economy
remained anaemic, with the growth rate of the economy remaining sluggish and stunted,
thus raising the number of poor people astronomically. The misappropriation of the oil
proceeds pushed many into the dark and eventually led to the Dutch Disease; evidenced
by poor economic performance and increased poverty rate. Since the return to democratic
rule in 1999, the economy has been trying to pick up from the doldrums which was
caused by the military mismanagement. In year 2000 and 2001 alone, GDP rose by
3.83% and 4.21% respectively; a record above the average growth rate of 2.6% recorded
*
2
from 1992 to 1998. Despite this increase, Nigeria still records a considerably high
proportion of poor people in the world, having over 60% of the population living below
the poverty line.
The bane of Nigeria's underdevelopment has been attributed to the lack of infrastructural
facilities, wrong policy frameworks, hostile environment, backwardness in technology,
problem of unemployment and over-dependence on imported products amongst other
factors. The National Economic Empowerment Development Strategy (NEEDS)
document a blueprint for improving the economy. For instance, The NEEDS program
targeted minimum annual GDP growth rates of 5% in 2004 but achieved 4.2%, while 6%
growth rate was targeted in 2005 and 2006 but realized 4.5% and 6.1% growth rates
respectively. Also, 7% growth rate was targeted in 2007 but realized 7.4% which is above
the targeted growth, in year 2008, GDP growth rate of 11% was targeted. On the whole,
the average growth rate of the economy between 2003 and 2006 hover around 6%. These
statistics actually show an improvement in the economic output, but to what extent does
this statistics affect the living standard of the people considering the different and relative
economic variables used as a tool for driving growth in Nigeria. Though much attention
had focused on domestic savings and export earnings (especially oil export), the duo have
not justified Nigeria’s economic growth pattern as there exists some inherent
developmental rigidities which encumber their usefulness. Foreign aid should be
channeled to those countries that have a balance of payments constraint while foreign
direct investment should be directed to augment the domestic savings. Foreign aid and
foreign direct investment will therefore be reviewed to palliate the short comings of
export earnings and domestic savings respectively.
Two-Gap Models of development are contained in the Post-Keynesian growth models for
closed economies as designed by Harrod (1939) and Domar (1946). They tried to identify
the pre-conditions for the economic growth of market economies. These two pre-
conditions are essentially rooted in the Nigerian economy and these are (1) Internally:
inadequate savings would definitely translate to investment. The GAP between these two
is called saving constraints (SAVING GAP). Closing this gap requires foreign direct
investment (FDI). (2) Externally: inadequate foreign exchange arising from inability to
export vis-à-vis high importation will lead to short fall in foreign exchange. The GAP
between this duo is called foreign exchange constraints (TRADE GAP) which can be
corrected by foreign aid.
Nigerian leaders resorted to foreign aid assistance from developed countries, multilateral
and bilateral international organizations to salvage the economy from total collapse.
Therefore, to emphasize the need for economic growth and development, there is need to
diversify the economy from oil exploration and exploitation to productive effort of
agricultural and other real sectors. However, inability to revive these sectors spells doom
to the trade and investment platform of Nigeria.
The two-gap model of growth has been adopted as a tool to bring the economy to bear on
the path of growth and if possible, salvage the economy. This paper aims at establishing
whether or not the theoretical prescription that the two-gap model of economic growth
purports holds in Nigeria. The rest of the paper is structured as follows. Section 2
explicates the theoretical background of the two-gap model, while Section 3 discusses the
3
methodology. Empirical results are presented in Section 4, while the conclusion and
policy recommendations are contained in the last section.
2. Theoretical Underpinnings and Literature Review
2.1. Review of Foreign Direct Investment and Economic Growth
It has been observed that domestic savings, if properly mobilized, can encourage an
improvement in the economic activities through investment. One of the major economic
problems of any developing and underdeveloped countries is inadequate savings.
Inadequate domestic savings or inappropriate mobilization of savings for investment
purposes is what is termed in the literature as savings constraint (SAVING GAP). This
gap can be corrected by encouraging the foreign direct investment (FDI) otherwise
known as foreign capital inflow. The major focus of this section is to indicate the effect
of FDI on economic growth in Nigeria. Attracting foreign direct investment would tend
to improve economic conditions while its volatility can trigger macro economic
instability in the country, especially Nigeria. From the literature, FDI is an investment
made to acquire a lasting management interest (normally 10% of voting stock) in a
business enterprise operating in a country other than that of the investor as defined by the
residency (World Bank,1996). One of the purposes for which the New Partnership for
Africa’s development (NEPAD) was established is to encourage the inflow of FDI inform
of new technology, refined marketing strategy and management. Asiedu (2001) submits
that the determinants of FDI in one region may not be the same for other regions. In that
case, the major source of FDI in countries within a region may be different from one
another with time variance.
Hanson (2001) argues that the evidence that FDI generates positive spillovers for host
countries is weak. In a review of micro data on spillovers from foreign-owned to
domestically owned firms, Gorg and Greenwood (2002) conclude that the effects are
mostly negative. Basu and Srinivasan (2002) analyzed FDI in African countries and
argued that the main determinants of FDI flows in Africa can be divided into four
categories – natural resource, specific locational advantage, policies towards FDI and
economic reforms. Meanwhile, the ratio of FDI to GDP is captured in figure 1.
Figure 1: FDI as a percentage of GDP in Nigeria
.0
.1
.2
.3
.4
.5
.6
.7
.8
1970 1975 1980 1985 1990 1995 2000 2005
FDI
RGDP
It is instructive to note that successive Nigerian governments reckoned with FDI as a
vehicle for political and economic domination. Figure 1 clearly depicts spiral movement
of the ratio of FDI inflow to real GDP in Nigeria. In 1983, 1993, 1995 and 1999 (four
years), Nigeria witnessed higher ratio of FDI to real GDP. This relationship occupies the
4
central impact of FDI to the Nigerian economy; one could adjudge this spiral movement,
especially from 1970 to 1999, to instability of FDI resulting from unstable political
structures of the economy. However, from 1999 to 2007, the ratio is consistent and
almost stable; this could have been attributed to the impact of return to democracy in
which the governments (both federal and state) woos the foreign investors of the need to
invest in Nigeria economy. This effort no doubt, impacts positively on the economy
making the growth in both FDI and real GDP move by almost the same proportion.
Success was recorded by embarking on various micro and macroeconomic policies,
projects and programmes that facilitated FDI attraction initiatives. No foreign investors
would dare to risk his life by investing in a country whose economy is shaky, stunted, and
unstable (e.g military rule). But, the success of FDI is determined majorly by the political
and economic factors prevailing in that country.
The collapse of the world oil prices of the 1980s due to the glut in the international
market accounted for investment withdrawals and thus a low level of FDI inflow.
Company Taxes Act 1961, Exchange Control Act and Immigration Act could also have
contributed largely in the discouragement of FDI inflows. Basically, the adoption of the
Structural Adjustment Programme in 1986 sparked off the journey towards the
termination of FDI-hostile policies; given that the elements in the implementation of the
Programme were creative steps geared towards encouraging FDI inflow. However, the
inflow seemed unsustainable as the period 1990–1993 witnessed a characteristic drop in
the rate of inflow which may be attributed to a political stalemate that disrupted
productive activities, procured uncertainty and promoted capital flight. The repeal of the
NEPAD and its replacement with the Nigerian Investment Promotion Commission
(NIPC) restored life to the investment climate as the NIPC provided an opportunity for
foreign investors to set up businesses in Nigeria with 100% ownership. This in
conjunction with other investment-friendly policies served to promote FDI inflow
especially and increasingly to the non-oil sector of the economy. Political factors such as
the democratic transition of 1999 introduced some measures aimed at improving the
efficiency and productivity of the economy. Notable among this was the privatization and
commercialization of public enterprises which contributed greatly to the sustained inflow
of FDI over from 1999 to date. A classic example is the deregulation of the
telecommunications sector of the economy by granting operating licenses to Global
System for Mobile communications operators which has increased FDI inflow in the
telecommunication sector of the economy (Ayanwale 2007).
The theoretical work of Findlay (1978) and Wang and Bloomstrom (1992) examined the
importance of FDI as a conduit pipe for transferring technology. They warned that in the
absence of linkages, foreign investments could have limited effect in spurring growth in
an economy. Hirschman (1958:109) emphasized that not all sectors have the same
potential to absorb foreign technology or to create linkages with the rest of the economy.
He noted, for example, “Linkages are weak in agriculture and mining sectors.
Markusen and Venables (1999) analyzed the effect of foreign firms on the development
of domestic firms in the industrial sector. In their model, foreign companies compete with
domestic producers while creating additional demand for domestically produced
intermediate goods through linkages with local suppliers. De Gregorio (1992) by
examining the experiences of 12 Latin American countries over the period 1950-85,
5
found that FDI provides three times the boost to economic growth as compared with
aggregate investment. Blomstrom et al (1992) arrived at a similar conclusion using a
larger sample of developing countries. They also found that FDI has a strong impact on
the economic growth of developing countries. However, they also find that this effect is
limited to higher-income developing countries. On the contrary, Carkovic and Levine
(2002) used macro level data to find little support for the importance of FDI in
stimulating growth. They argue that previous studies showing the benefit of FDI on
economic growth has not fully taken into account the endogeneity problem. It has been
observed that FDI which repose the inadequate domestic savings might be exogenous,
showing that FDI might be absolutely exogenous implying that deficient domestic
savings might not be FDI determining factor.
The relationship between FDI and economic growth has become increasingly
endogenous. Both Zhang (2002) and Zhang (1999) find evidence of a two-way Granger
causality in the relationship between FDI and China’s economic growth. Similarly, Choe
(2003) in a large sample of 80 countries finds evidence of two-way causality between
FDI and economic growth. In addition, he also finds that the effects are more apparent
from economic growth to FDI. Human capital can also play an important role in turning
the FDI resources to economic growth, Borensztein et al (1998) shows that the country
needs a certain level of human capital in order for the country to benefit fully from FDI.
They performed cross-country regressions on a sample of 69 developing countries and
found that FDI contributes more to growth than domestic investment. Balasubramanayam
et al. (1996) found that FDI flows were associated with faster growth than in those
developing countries that pursued inward oriented trade policies. Asiedu (2001) found a
positive relationship between the return on capital and FDI, suggesting that higher GDP
per capita implies a brighter prospect for FDI in the host economy. Aluko (1961), Brown
(1962) and Obinna (1983) report positive linkages between FDI and economic growth in
Nigeria. Endozien (1968) discusses the linkage effects of FDI on the Nigerian economy
and submits that these have not been considerable and that the broad linkage effects were
lower than the Chenery–Watanabe average (Chenery and Watanabe, 1958). Oseghale and
Amonkhienan (1987) found that FDI is positively associated with GDP, concluding that
greater inflow of FDI will spell a better economic performance for the country.
Investment (both foreign and domestic) as a percentage of GDP and trade openness is
expected to rise as countries pass through higher stages of development and experience
faster growth rates.
2.1.1 Determinants of Foreign Direct Investment
The role of foreign direct investment in growth acceleration and economic transformation
has increased interest and drive towards the attraction of foreign exchange. FDI is an
intervention that seeks to bridge the gap between domestic savings and investment; while
encouraging diffusion of latest technology and management approaches from developed
region, it thus plays a vital role in promoting rapid economic growth in developing
countries.
Determinants of FDI have been identified as size of the market, openness (Lim 2001).
The study further identified infrastructure ability, political/economic stability and free
trade zones as important avenues for FDI but had mixed results for fiscal incentives, the
6
business or investment climate, labour cost and openness. Edozien (1968) in an appraisal
of the relationship between FDI and economic growth recognizes that it generates an
inflow of capital technical knowhow and managerial capacity. In addition, Loius (1998)
employing error correction specification identified both economic and political factors as
the major determinants of FDI in Nigeria.
Using panel data for 22 countries over 1984-2000, Asiedu (2005) found that the presence
of natural resource and large markets promote foreign direct investment. The study found
that lower inflation, good infrastructure, educated population, openness to FDI, less
corruption, political stability and a reliable legal system promote FDI. Differentiating the
types of FDI into resource seeking, market seeking and efficiency seeking FDI,
Nunnenkamp and Spatz (2003) analysed the effect of an interplay of industry and host
country characteristics has on the growth of FDI in developing countries. The strategic
role of FDI in augmenting domestic investment intensified effort of democratic
governments at attracting FDI.
From the foregoing it is established that foreign direct investment produces economic
benefits to the recipient countries by providing capital, foreign exchange, technology,
competition and enhanced access to foreign markets. It also serves to promote domestic
investment and innovation. Thus, we may identify the determinants of Foreign Direct
Investment in Nigeria as follows,
FDI = f ( FDIt-1 ,HUMAN CAPITAL, NR, IFA, OP, REXR ,GDP, POL)
Where: NR = Presence of Natural Resources; IFA = Infrastructural Ability; OP =
Openness; REXR = Real Exchange Rate; POL = Political Factors
2.2 Review of Foreign Aid and Economic Growth
While FDI is a long-term capital transfer to finance investment, foreign aid is an official
development assistance (ODA) which is monitored and administered by the Development
Assistance Committee (DAC) consisting of grants or loans that one government or
multilateral organization gives to a developing country to promote economic
development and welfare. By concessionary terms, considering loans; it means 25% of
ODA must be in the form of grants which includes exports credits and debt forgiveness
etc. The aid resources of bilateral donors tend to follow the donor’s political and strategic
priorities and not those countries that have the greatest need from a development
perspective. In his works, Bauer (1991) argued that aid has serious, distorting
consequences on the political life of recipient countries. Bauer, one of the critics of
foreign aid, claimed that foreign aid has sustained governments in their pursuit of
economically counterproductive political and economic policies; such policies include
the persecution of particular groups, restriction on private trade and the inflow of private
capital and enterprises, price policies that discourage agricultural production.
Papers by Svensson (2000a, 2000b) and Collier and Dollar (2004), among others do not
only explicitly address the economic growth problems but also explored the channels
7
through which foreign aid may deteriorate economic policy. The conjectures are such that
foreign aid may partially substitute for sound economic policies, or that large aid
payments induce wasteful rent-seeking activities. The ‘Fischer-Easterly model’ (Fischer,
1991, 1993; Easterly, 1993) provides a natural context within which the aid-growth
relationship can be emphasized. Since 1980s, much aid from the multilateral lending
agencies has been linked explicitly to macroeconomic policy reforms and structural
adjustment programs (see Krueger 1997, Greenaway 1998, McGillivray and Morrissey
1998).
The aid-growth literature has been dominated by cross-sectional studies using single-
equation estimation techniques, producing mixed empirical results. Among early
investigations for example, Papanek (1973) appeared to overturn the negative results of
Griffin (1970) and Griffin and Enos (1970) by disaggregating capital flows into foreign
aid, private capital and other inflows, reporting a positive and significant aid coefficient
on economic growth. On the other hand, Voivodas (1973) obtained a negative impact of
aid on growth (although not significant) for a sample of 22 LDCs for the period 1956-
1968. The ambiguity of these results may have, however, risen at least in part from the
poor quality of the data for these early periods. For Sub-Saharan Africa, Levy (1988)
reports a significant positive relationship in a regression model including aid (as a ratio of
GDP) and income per capita, for 1968-82. Also, Hadjimichael et al. (1995) found
positive evidence for the period 1986 to 1992 using a sample of 41 countries. Their
model is more sophisticated than most predecessors by attempting to capture potential
side effects of foreign aid (such as ‘Dutch-Disease’ effects) and other policy variables
that are hypothesised to affect growth. Similarly, Burnside and Dollar (1997), using a
model including a variety of policy variables, finds that though the ratio of aid to GDP
often does not significantly affect growth in LDCs, aid interacted with policy variables
does. Boone (1996) however has cast doubt on the growth effects of aid, arguing that, for
a sample of LDCs, aid has had no impact on either investment or income growth.
In another development, Knack (2000) shows that aid flows (relative to GDP and to
government spending) are significantly correlated with a worsening of political risks for
external investors, implying a deterioration in economic institutions. Djankov, Montalvo,
and Reynal-Querol (2005) study changes in the quality of political rather than economic
institutions. Their results revealed that on the average, countries with above average aid
receipts relative to GDP promptly show a political deterioration. The effect of aid over
the long run is substantial. While Rajan and Subramanian (2005) find that aid appears to
slow the growth of labor intensive industries in developing countries, consistent with a
“Dutch disease” effect caused by an appreciating exchange rate. World Bank (2000) on
the other hand, finds that Africa’s exchange rates seem to be overvalued—an effect that
may be due to a combination of aid flows and natural resource earnings. Mosley (1980),
using a simultaneous equation model, found a weak, negative correlation between aid and
growth, though he did find a positive, significant relationship for the ‘poorest’ countries
in his sample. In this paper, we have concluded that political instabilities, some
fundamental rigidities, misappropriation of public funds, amongst others, hinder growth
of third world countries of which Nigeria forms a part: which is why foreign aid inflows
has not been a determinant of growth. This has been widely supported by many writers.
The figure below shows the ratio of AID to GDP from 1970 to 2007.
8
Figure 2: Aid as a ratio of GDP in Nigeria
0.0
0.4
0.8
1.2
1.6
1970 1975 1980 1985 1990 1995 2000 2005
AI
DRGDP
A working knowledge of the saying that, 'poverty anywhere being a threat to prosperity
everywhere', has been the propelling force behind the commitment of developed
countries and international organisations in providing development assistance to
developing countries. However, a typical observation of the Official Development
Assistance directed to Nigeria has been low over the years 1970-1987; a considerable rise
occur consequent to adoption of the Structural Adjustment Programme (SAP) in 1986:
this confirmed the relative importance of economic reform in the determination of aid. A
sharp increase was recorded in the 2005 and 2006; a period when Nigeria was relieved of
$18 billion debt out of a total debt of $30 billion. This debt was converted to foreign aid
of which $9billion each was estimated for year 2005 and 2006 and in year 2005 alone,
the foreign aid worth about 150% of the real GDP.
International organisations and developed countries probably grew more confident in the
ability of democratic government to manage aid funds to improve the economy and living
standards of her people as against the mismanagement vanguard by the military warlords.
Nigeria has received more than enough foreign development assistance, yet the economy
remained stunted and sticky. Different reforms have been put in place but none have
solved the problems of growth of the economy, the growth statistics have not affected the
common man on the street.
Knack (2000) argues that high level of aid erodes institutional quality, increases rent-
seeking and corruption, thereby negatively affecting growth. Papanek (1973), in a cross-
country regression analysis of 34 countries in the 1950s and 51 countries in the1960s,
treating foreign aid, foreign investment, other flows and domestic savings as explanatory
variables, finds that foreign aid has a substantially greater effect on growth than the other
variables. He explains, “Aid, unlike domestic savings, can fill the foreign exchange gap
as well as the savings gap”. Fayissa and El-Kaissy (1999), in a study of 77 countries over
sub-periods 1971-1980, 1981-1990 and 1971-1990, show that foreign aid positively
affects economic growth in developing countries. Using modern economic growth
theories, they point out that foreign aid, domestic savings, human capital and export are
9
positively correlated with economic growth in the countries studied. This is consistent
with the economic theory of foreign aid, which asserted that overseas development
assistance accelerates economic growth by supplementing domestic capital formation
(Chenery and Strout, 1966).
Burnside and Dollar (1997), in their well-known paper “Aid, Policies, and Growth”, find
that aid has a positive impact on growth in developing countries with good fiscal,
monetary and trade policies but has little impact on countries where such policies are
poor. To some, economic growth is elusive because different factors are responsible for
growth in different economies of the world.
2.2.1 Determinants of Foreign Aid
Given the high level of unemployment, poverty and poor economic performance of
developing countries in general, foreign aid should represent an important source of
foreign exchange for most countries of sub-Saharan Africa because it serves as a
supplement of their low savings, export earnings and thin tax revenues. The concern for
Africa can be seen in the commitment of the Economic Commission on Africa to raise
over $50billioin annually to fuel Africa’s growth. Also, the shriveling state of the African
economy with a hope for rejuvenation by aid influences the UN to increasingly advocate
for rich countries to raise the ratio of foreign aid to 0.7% of GDP by 2015.
Studies have shown that aid, other than fuel development, has made budget of most of the
African countries being aid dependent. Thus, the paradox is observed that the more aid is
been redirected to Africa, the more its living standards plummet. This is because aid
tends to underwrite misguided policies and is an incentive for the corrupt and bloated
institutions which characterize most African countries. Poor countries that are substantial
aid recipients have been known with records of negative growth trends. Corruption tends
to increase with foreign aid and is negatively related to trade. However, the systematic
failure and inefficiency of aid (due largely to weak and unproductive institutions) is not
only related to Africa but also to countries of Latin America.
Total foreign inflows to a country could be in form of foreign aid, foreign borrowing and
foreign investment. However, aid, as distinct from other forms does not cause an outflow
of funds to pay back debt or repatriation of profits. Thus, the potential positive effect of
foreign aid should however, be more plausible than the general effect of all foreign
inflows. Though we need to know how beneficial or harmful aid is, much more we need
to establish why different countries receive or attract aid in different amounts. Ali and
Isse (2006) employed a panel approach to establish determinants of aid. The study
specified and estimated a model explaining foreign aid allocation among 151 countries
over the period 1975-1998. Trade, private credit, foreign direct investment, GDP per
worker and government consumption were established as important determinants of
foreign aid. From the analysis, factors appearing to decrease aid were years of schooling,
private credit, trade and GDP per worker. While the factors appearing to increase foreign
aid include taxes on international trade, ethnicity, government consumption. Following is
a description of determinants of foreign aid (Economic Development Assistance)
EDA = f (GDPW, TRADE, ETHNO, TOT, CREDIT, EDU, LAND AREA, GOV)
10
Taxes on trade, (TOT), capture the paradox that characterises the provision of foreign aid
on one hand and protective trade policy on the other hand. There is interdependence
between foreign aid and a country's tax policies. A rise in trade protection is usually
associated with a rise in foreign aid provision. Nugent (1999). The countries that depend
greatly on private capital (CREDIT) attract less aid; it fosters institutions and productive
ventures and is likely to drive out overly managed government-to-government aid.
Krueger (1993)
Government spending (GOV) is the ratio of government consumption expenditure to
GDP controlling for size and scope of government. Since aid goes to government and
increased government spending amplifies aid, it tends to deter economic performance.
The comparison between trade and aid sheds light on how competition and efficiency of
each affect resource allocation. Another determinant of aid is GDP per worker (GDPW).
Nugent and Krueger established that ethnic diversity (ETHNO) attracts aid for two
crucial reasons; the more interest groups are seeking funding for their pet projects,
governments may use foreign aid to obtain interest group supports, political undertones.
2.2.2 The International Organizations and Foreign Aid in Africa
From the birth of international organizations, sub-Saharan Africa has been a region of
particular interest in the realm of development. The region has been plagued by high
economic volatility, extreme poverty, political instability and social unrest. According to
the United Nations Industrial Development Organization (UNIDO), sub- Saharan Africa
is the only world region where extreme poverty has grown for the past 20 years and is
currently at a rate of nearly 50 percent (WB Intranet). While the greatest amount of aid
per capita has gone to this region, it has seen the weakest reform (Devarajan et al. 2001).
The International Monetary Fund and the World Bank have contributed the largest
amount of aid to the region. These two lenders offer lower interest rates than private
donors with the intent of aiding nations in financial crisis. Structural adjustment
measures, however, are imposed to create greater assurance of debt repayment and
stabilization of the development process. The lack of development despite increased
foreign capital assistance as well as a heavy debt crisis between 1970 and 1985 resulted
in strategic conditionality requirements for borrowing countries as stipulated by
international lenders. From 1989-1999, the number of loans with attached structural
adjustment requirements increased from 60 percent to 100 percent and the average
number of conditions increased from three to 12 (Santiso 2001:11). This notion of
conditionality is important for both borrowing countries and international lending
organizations because donors develop a vested interest in successful reform and
stabilization of finances. Conditionality and surveillance make them active participants in
internal policy reform. The expansion of conditionality during the 1990s is notable
especially for the IMF in that where it had previously focused on macroeconomic reform;
it began to target microeconomic policies (Eldar 2005:511). The most prevalent reform
measures include trade reform, price liberalisation and privatisation, promotion of central
bank independence, strengthening of financial sector regulations, devaluation of
currency, and decentralisation of agencies and national enterprises (IMF 2005).
In addition, many of the changes in the 1990s are a reflection of increased attention to
internal social and political factors in borrowing nations, including a good governance
emphasis. The World Bank, for example, has significantly expanded its commitment to
government related programs. Between 1996 and 2005, more than 600 programs and
11
initiatives have been created with focus on public sector reform (Santiso 2001:3). The
area of sub-Saharan Africa also falls under the category of low-income which makes its
countries eligible for the Poverty Reduction and Growth Facility (PRGF) loans. This
program is designed for low-income countries because it offers low-interest loans
supported by programs with poverty reduction strategies (IMF 10.2007). The World
Bank also offers interest-free lending for the poorest countries through its International
Development Agency (IDA) (WB Group 2008). Despite these programs, however, sub-
Saharan Africa has seen little progress, thereby underscoring the need for a new approach
to developmental assistance.
2.3 Review of the Two-Gap Model and the Theoretical Framework
When external finance either grants or loans supplement domestic resources, then we
have “the Two-Gap model” the major assumption of this model is that most developing
countries either face a shortage of domestic savings to augment for investment
opportunities or they (developing countries) are faced with foreign exchange constraints
to finance the needed capital and intermediate goods. In their book, Economic
Development Todaro and Smith (2004) claimed that most Two-Gap models assume that
the savings gap and the foreign-exchange gap are unequal in magnitude and independent
in nature. The implication of this is that one of the Two-Gaps would be “binding” or
“dominant” for any less developed country at any point in time.
McKinnon (1964), Chenery and Strout (1966), Findlay (1973), and others applied the
Harrod- Domar growth model to show that foreign capital can raise the growth rate by
raising the availability of capital for production, where the capital-output ratio is held
constant. The two-gap approach introduces the assumption that an imported commodity
not produced domestically is essential for the production of investment goods. On one
hand, if the availability of foreign exchange (if trade gap exist) to purchase these
imported capital goods constrains or expands (when the economy has human resources
and technology of its own) the growth of the economy, the growth would be exogenous
of foreign exchange, since it does not depends on foreign investment goods and
technology. On the other hand, foreign capital can be introduced in the form of official
flows, or FDI (provided saving gap exist). If the availability of foreign capital to
compensate for the lack of domestic savings constrains or expands the growth of the
economy, we may call the growth endogenous of FDI, since the economy does not have
technology and human resources of its own.
The Two-Gap Model
Essentially, the two gap model is based on the gap between a country's own provision of
resources and its absorptive capacity. These two gaps are known as the Savings Gap and
the Foreign Exchange Gap. Whichever of the two gaps is binding (or is the greatest) will
constrain the amount of investment and capital formation, which can be undertaken.
(1) The Savings Gap Where savings fall short of what can be effectively and
productively invested.
(2) The Foreign Exchange Gap
Where earnings of foreign exchange fall short of the amounts needed to purchase
the necessary foreign materials, components, etc.
12
Derivation of the Two-Gap Model
We start with the basic Macroeconomic Identity where Aggregate Output = Aggregate
Expenditure. Thus, assuming that there is no government sector
Y = C + I + (X - M) where: Y = GNP
Where Y= GNP; C= Consumption; I= Investment (or Domestic Capital formation)
X = Exports; M = Imports
M = Imports
Subtracting C from both sides we get:
Since Y – C = S Where: S = Savings (domestic)
Then,
This relationship can be restated as follows
=
These two constitute two separate constraints. Eliminating one does not get rid of the
other.
Note: The analysis rests on the premise that domestic investment can be financed
by domestic saving as well as through inflows of capital.
If we let (M – X) = F, then we can represent the above as follows
F = I – S or as in the text I = F + S
Possible Scenarios
Using the relationship posited above, the following scenarios may arise:
S may be too small to permit the amount of I that the country would otherwise have the
capability to undertake. Therefore, a SAVINGS GAP would exist.
X may be too small to permit the M required to make full use of the resources of the
economy. Therefore a FOREIGN EXCHANGE (or TRADE) GAP would exist.
Now,
(Sources of Resources used in the economy = Uses of Resources in the Economy:
expenditure Targets
Y + M = C + I + X
Y – C + M = I + X
M – X = I – S
(Foreign Exchange Gap) (Savings Gap)
S + M = I + X
(Withdrawals) (Injections)
13
Additional Discussion
While the two gaps are distinct and separate ones, international transfers can, in fact, be
used to fill both. For example, a machine given to a country represents both an import for
which no resources need to be exported (thus alleviating the foreign exchange gap) and
an investment good which does not have to be offset by domestic saving (thus alleviating
the savings gap). We should also note that the notion of two gaps is not consistent with
neo-classical economic theory. Neo-classical economics assumes that resources can be
easily shifted between different employments. Thus, whenever idle resources (excess
capacity) exist, these idle resources can be used to produce exports, and exports can be
increased by simply altering the exchange rate - i.e., by devaluing. Conversely, idle
resources can be used to produce capital goods, intermediate inputs and the like, so that
foreign exchange constraints can be eliminated. Concerning the latter, excess labour can,
for example, be put to work to create labour intensive capital goods.
Proponents of the two-gap model contend that imperfections and rigidities exist which
preclude the economy from working according to the neo-classical edicts. For example,
many governments may not think it desirable to do what neo-classical economics
suggests they ought to do. As well, actions which may be theoretically proper may simply
not be effective since they are implemented in an environment totally different from that
perceived by neo-classical economics.
Assessment of the Two Gaps
In some of the work done on the two-gap model, it is suggested not only that they exist
but that, most often; the trade gap exceeds the savings gap. This suggests that the trade
gap is more powerful - i.e. is the binding constraint. An early UNCTAD study suggests
that the two gaps are about equal.
3. Methodology and Data
In the Harrod-Domar model, where production technology and the capital-labor ratio are
fixed, capital accumulation is essential for growth. In the neoclassical Solow-Swan
model, on the other hand, the capital-labor ratio changes to accommodate technology
innovation, which is the source of growth. Barro (1990) and others, who advocate the
endogenous growth theory, assert that the government policies, such as open trade and
education, could stipulate the country’s long-term growth rate.
In the course of this paper, we shall refer to the impact of time series data on the model
used, in response to the influence of time series data, we shall conduct unit root tests
using augmented Dickey-Fuller (ADF) and Philip Perron (PP) and the empirical
examination of vector autoregressive analysis would be made to explain the Two-Gap
model.
3.1 Time Series Data Analysis
Empirical analysis using time-series data requires that each variable xt is stationary,
meaning that: 1) its mean E(xt) and variance V(xt) are constant over time t, and 2) the
value of covariance Cov(xt, xt-k) between two time periods t and t-k depends only on the
14
lag k and not on the actual time t at which the covariance is computed. The problem of
spurious regression is likely to arise, when two time-series exhibit both strong upward or
downward trends. In this case the high R2
could be due to the presence of the trend, not
due to any meaningful relationship between the two. It is known that if a time-series
model includes one non-stationary variable, then the regression could be spurious, even
though it exhibits a high R2
and significant t-values, Yamachita and Khachi (2003). In the
course of this paper, time series secondary data obtained from the Central Bank of
Nigeria (CBN) statistical bulletin, International Financial Statistics, African Development
Bank volume on selected statistics, National Bureau of Statistics and other conference
papers.
3.2 Unit Root Test
Let us denote the stochastic error term by ut, which has zero mean, constant variance,
and is not autocorrelated. Such an error term is called white noise. If Δxt = xt - xt-1 is
stationary, where Δis the first-difference operator, the original series xt is called
integrated of order 1, and denoted by I(1). In general, if a time series has to be
differenced r times before it becomes stationary, it is integrated of order r, or I(r).
Consider the autoregressive model xt = r xt-1+ ut, where ut is white noise. If r =1, then xt
is a non-stationary time-series known as a random walk, and we say that xt has a unit
root. The model can be modified as Δ xt = ( r - 1) xt-1+ ut = a xt-1+ ut, where a = r - 1. The
unit root is tested for xt under the null hypothesis that a = 0.
More generally, the unit root is tested for xt under the null hypothesis that a = 0 in the
time series model Δxt =a xt-1+ b t +g + ut, where t is a time trend, and g is a drift
parameter (intercept). If the error term ut is autocorrelated, then the model is modified to
include more lags:



 









m
i
t
t
t
t
t t
i .(3.1)
u ..
..........
..........
..........
..........
..........
1
1 


The number of lagged difference terms to include m is determined empirically by Akaike
information criterion (AIC), or Schwarz criterion (SC). The unit root test for xt under the
null hypothesis a = 0 applied to the model (1) is called Augmented Dickey-Fuller (ADF)
test. However, we shall consider ADF unit root and Phillips-Perron (PP) test appropriate
for this research work.
The finding that many macro time series may contain a unit root has spurred the
development of the theory of non-stationary time series analysis. Engle and Granger
(1987) pointed out that a linear combination of two or more non-stationary series may be
stationary.
3.3 Vector Autoregressive Analysis (VAR)Model
Consider a VAR of order P:
1
1 1
... ..............................................................3.2
t
t y t t t
y A Apy Bx e
 
    
15
Where: yt is a k-vector of non-stationary I(1) variables, xt is a d vector of deterministic
variables, and et is a vector of innovations. We can rewrite the VAR as:
1
1
1
........................................................3.3
p
i t i t t
t t
i
T Dy Bx e
Dy Hy




 
  
Since VAR models do not distinguish the dependent variables from the independent
variables, the notation of Yt and Xt is conventional. Under the assumption that et is
neither autocorrelated nor correlated with any of the right-hand side variables, we can
appropriately estimate the coefficients by OLS. The number of lags m is again
determined by Akaike information criterion (AIC), or Schwarz criterion (SC).
a) Impulse Response Analyses
An impulse response function is created by converting the VAR model (1) to the vector
moving average model of infinite order VMA (∞). It traces the effects of one standard
deviation shock to one of the impulses ut on current and future values of the endogenous
variables Yt in the converted form. The impulses are usually correlated, so that they have
a common component which cannot be associated with a specific variable.
A common method of dealing with this issue is to attribute all of the effects of any
common component to one variable that comes first in the VMA(∞) model. More
technically, the error terms are orthogonalized by Cholesky decomposition, so that the
covariance matrix of the resulting impulses is diagonal. While this method is widely
used, it is rather arbitrary, and changing the Cholesky ordering of the variables could
dramatically change the impulse responses.
b) Variance Decompositions
Variance decomposition provides a different method of depicting the system dynamics. It
decomposes variation in a targeted endogenous variable Yt into the component shocks to
all endogenous variables in the VMA(∞) model, and provides information about the
relative importance of each random impulse ut to the targeted variable.
4. Estimation
4.1 Data Description and Unit Root Test
Data are prescribed from established theoretical framework of two-gap model. Annual
time series data (from 1970-2007) that include real GDP, domestic investment, foreign
direct investment (FDI), export, import and aid are all consider germane to this research
work. The log form of these variables are represented as LRGDP, LDINV, LFDI, LEXP,
LIMP and LAID respectively and on these log form will unit root test be conducted.
The result of both augmented Dickey-Fuller (ADF) and Philip Perron (PP) unit root test
are shown in Appendix 1. We reject the null hypothesis of unit root at first difference for
all variables except PP unit root test of LFDI. By implication, all variables except
LFDI—PP are stationary at critical values -4.23, -3.54 and -3.2 at 1% , 5% and 10%
16
respectively, though LDINV-ADF is stationary at I(2) thus, we classify it a non stationary
variable.
4.2 Vector Autoregression Analysis
The crux of this research is the vector autoregression analysis which represents the
impulse response and variance decomposition of the variables. In the context of this
research work, the shock of the economic growth will be examined through the
innovation of the error term and a recursive VAR was found suitable for this purpose.
Evidently, the result of the recursive VAR depends on the order of the variables:
changing the order changes the VAR equations, coefficients, and residuals, and there are
n! recursive VARs, representing all possible orderings. The cholesky orderings is as
follows KLRGDP KLFDI KLAID KLDINV KLEX KLIMP making real GDP the most
important variable among the variables. Both impulse response and variance
decomposition are observed through the stationary status of the variables.
4.2.1 Impulse Response
Appendix 2 gives the result of the impulse response of the VAR method: in this regard,
since, we are more interested in the factor(s) that influence real GDP therefore; we shall
consider the real GDP shock through the other variables. The response of KLRGDP to
one standard deviation innovation or impulse of KLFDI is volatile as the result indicates
both positive and negative response. The volatility nature of KLFDI over the ten year
period is relaxed in year nine and ten. The response of KLRGDP to one standard
deviation innovation of KLAID is flat, negative and zero. Whereas: the response of
KLRGDP to one impulse of KLDINV is consistently positive. Unfortunately, the
response of KLRGDP to one standard shock of KLEX and KLIMP revealed negative
impact for many years. However, the response of KLAID to one impulse of KLRGDP is
positive for many periods.
4.2.2 Variance Decomposition
Variance decomposition results of the VAR approach is explicitly displayed in Appendix
3. At this point, we shall determine vividly factors that influenced real GDP in Nigeria
for ten period horizon. 50% of the variation in real GDP is determined by its lagged
values starting from horizon one to six. And down the horizon, KLFDI, KLDINV and
KLIMP explain at least 10% of the variation in real GDP while KLAID and KLEX have
a very low impact on real GDP. More interestingly, KLAID is determined by KLRGDP;
this is because more than 20% of the variation in KLAID is consistently explained by
KLRGDP. Moreover, over 28% of the variation in KLEX is consistently explained by
KLDINV while over 45% of the factors affecting KLIMP can be traced to KLDINV.
No doubt, these results did not only indicate the dominant factors affecting the growth in
real GDP in Nigeria but also revealed the necessity and importance of general
equilibrium theory of the economy.
17
Conclusion. We conduct various tests using the VAR model analysis to identify the
factors that promote or restrain economic growth based on the two-gap model. The
results of the unit root test confirm that all the variables are absolutely nonstationary
except for (LFDI) which is stationary at levels using Phillip Peron test. From the VAR
analysis, Foreign aid does not give clear evidence of an imperative growth factor in
Nigeria while FDI does but volatile. This confirmed the transfer paradox –a condition
under which foreign aid immiserates the recipient country. The implication of this is that
once a country attains high economic growth, it could resolve the gap by itself and tread a
sustainable growth path. This could be achieved through first, increase in exporting
commodities, secondly diversification of the economy from oil-which has remained a
Dutch disease to the Nigerian economy. Third, import substitution items should be
encouraged among the local producers and lastly, trade liberalization should be the key
policy thrust to complement foreign aid if aid is needed at all. Either aid conditionality or
non-conditionality, the analysis confirmed that aid can distort the welfare of Nigerian
citizens. Moreover, there is no theoretical or empirical justification (by this research) for
the assumption that filling a “trade gap” determined by “aid requirements” will boost
trade and growth in the Nigerian economy.
From the variance decomposition of VAR, foreign direct investment is determined by its
past levels while aid is determined by real GDP. The policy implication of endogeneity of
aid on real GDP re-emphasizes the imperative of economic reforms as a condition for aid.
Aid tying may alter the allocation of resources from an efficient position to an inefficient
position of the recipient countries; In this case, aid will deteriorate and immiserate the
living well being of the citizen. The fact is that the donor may advise Nigeria to increase
her imports by the amount of aid provided and as such, an appropriate import policy to
match this requirement may remains sacrosanct to Africa’s developmental problem.
Moreover, if the government marginal propensity to spend associated with tying is higher
and more than the private agents, then deterioration of the terms of trade may be powerful
enough to induce the transfer paradox.
There are two interesting notable results from the variance decomposition result; first
about 60% of the variation in import has been consistently explained by foreign direct
investment and domestic investment. Hence, investment resources have been channeled
to importation which in turn deteriorates Nigeria terms of trade. Secondly, more than
28% of the variation in exportation is constantly determined by domestic investment.
This is robust enough to indicate the economic justification of domestic investment
designing a development trajectory through a refine economic policy that will enhance
domestic investment. Thus, relying solely on FDI in closing the savings gap can cause
more harm than good to Nigerian economy.
The two-gap model of Chenery and Strout (1966) showed that developing countries are
constrained with little domestic savings and foreign exchange earnings. The model
predicted that foreign aid and foreign direct investment are an optimal means to break the
poverty circle and solve the two gaps simultaneously. Except the fundamental rigidities
which includes, among other things, inappropriate economic policies, corruption,
mismanagement of resources and overreliance on oil resources, the vicious circle of
poverty in Nigeria economy cannot be broken by attracting foreign aid and foreign direct
investment alone.
18
References
Aluko, S.A. (1961). “Financing Economic Development in Nigeria”. The Nigerian
Journal of Economic and Social Studies, 3(1): 39–67.
Asiedu, E. (2001). “On the Determinants of Foreign Direct Investment to Developing
Countries: Is Africa Different?” World Development, 30(1): 107–19.
Balasubramanyan, V., N. Mohammed, A. Salisu and David Sapsford. (1996). “Foreign
Direct Investment and Growth in EP and IS Countries”, Economic Journal, 106: 92–105.
Barro, R.J. (1990), “Economic Growth in a Cross Section of Countries”, Quarterly
Journal of Economics, 106(2), 407-433
Basu, Anupam, and Krishna Srinivasan, (2002), “Foreign Direct Investment in Africa—
Some Case Studies,” IMF Working Paper No. 02/61 (Washington, International
Monetary Fund).
Bauer, P. T. (1991). The Development Frontier: Essays in Applied Economics.
Cambridge, MA: Harvard University Press.
Blomström, M., Lipsey, R. and Zejan, M. (1992), “What Explains Developing Country
Growth?” NBER Working Paper, n. 4132. Cambridge, Mass.
Boone, P. (1996), “Politics and the Effectiveness of Foreign Aid”, European Economic
Review, Vol. 40, pp. 289-328.
Borensztein, E., J. De Gregoria and J. Lee. (1998). “How Does Foreign Investment
Affect Economic Growth?” Journal of International Economics, 45(1): 115–35.
Burnside and Dollar (1997) Aid, Policies, and Growth. Policy Research Working Paper
No. 1777, Washington, World Bank.
Brown, C.V. (1962). “External Economies and Economic Development”. The Nigerian
Journal of Economic and Social Studies, 4(1): 16–22.
Carkovic, M. and R. Levine. (2002). “Does Foreign Direct Investment Accelerate
Economic Growth?” University of Minnesota, Working Paper.
Chenery, H. B. and A. Stout (1966). “Foreign Assistance and Economic Development”.
American Economic Review Vol. 55 pp.679-733.
Chenery, H. B. and T. Watanabe. (1958). “International Comparisons of the Structure of
Production”. Econometrica XXVI 487-521.
19
Choe, J.I. (2003). Do Foreign Direct Investment and Gross Domestic Investment Promote
Economic Growth? Review of Development Economics, 7(1), 44-57
Collier, Paul, and David Dollar. (2002). “Aid Allocation and Poverty Reduction.”
European Economic Review 46(8): 1475-1500.
————. 2004. “Development Effectiveness.” Economic Journal 114(496): F244-F271.
De Gregorio, J. (1992),“Economic Growth in Latin America”. Journal of Development
Economics 39, pp. 59-83.
Devarajan Shantayanan, Collier, Paul and David Dollar. (2001). "Measuring IDA's
Effectiveness." Processed. World Bank, Washington, D.C.
Djankov, Simeon, Jose G. Montalvo, and Marta Reynal- Querol. (2005). “The Curse of
Aid.” World Bank, Washington, D.C.
Domar, Evsey. (1946), “Capital Expansion, Rate of Growth, and Employment”,
Econometrica, Vol. 14, pp. 137-47.
Easterly, William and Sergio Rebelo. (1993). “Fiscal Policy and Economic Growth: An
Empirical Investigation.” NBER Working Paper No. 4499.
Eldar, O. (2005). “Reform of IMF Conditionality: A Proposal for Self Imposed
Conditionality”. Journal of International Economic Law 8, 2: 511.
Endozien, E.G. (1968). “Linkages, Direct Foreign Investment and Nigeria’s Economic
Development”. The Nigerian Journal of Economic and Social Studies, 10(2): 119–203.
Fayissa, Bichaka and El-Kaissy, Mohamed I. (1999). “Foreign Aid and Economic
Growth of Developing Countries (LDCs): Further Evidence.” Studies in Comparative
International Development
Findlay, R. (1978). “Relative Backwardness, Direct Foreign Investment and the Transfer
of Technology: A Simple Dynamic Model”. Quarterly Journal of Economics, 92: 1–16.
Fischer, Stanley. (1991). “Growth, Macroeconomics and Development.” NBER Working
Paper No. 3702.
————. (1993). “The Role of Macroeconomic Factors in Growth.” Journal of
Monetary Economics 32(3): 485-512
Gorg, H. and D. Greenaway (2002). “Much Ado About Nothing? Do Domestic Firms
Really Benefit from Foreign Direct Investment?” Research Paper 2001/37, Globalisation
and Labour Markets Programme, at Leverhulme Centre for Research on Globalisation
and Economic Policy, Nottingham.
20
Greenaway, D. (1998), “Does Trade Policy Reform Improve Economic Performance?”
Scottish Journal of Political Economy, Vol. 45, forthcoming.
Griffin, K. (1970). “Foreign Capital, Domestic Savings and Economic Development”.
Bulletin of the Oxford University Institute of Economics and Statistics, 32 (2): 99-112.
Griffin, K. and J. L. Enos (1970). “Foreign Capital, Domestic Savings and Economic
Development,” Oxford Bulletin of Economics and Statistics, vol. 32, pp. 99-112.
Gujarati, D.N. (1995), Basic Econometrics, McGraw-Hill, 3rd edition Development,”
Oxford Bulletin of Economics and Statistics, vol. 32, pp. 99-112.
Hadjimichael, M.T et al. (1995), Sub-Saharan Africa Growth, Savings, and Investment,
1986-1993, International Monetary Fund Occasional Paper No. 118, Washington D.C.
Hanson, G.H. (2001). “Should Countries Promote Foreign Direct Investment?” G-24
Discussion Paper No. 9. UNCTAD Geneva.
Harrod, R., (1939). “An Essay in Dynamic Theory”, Economic Journal 49, pp.14-33.
Hirschman, A. (1958). The Strategy of Economic Development. New Haven: Yale
University Press.
Knack, S., (2000). Does Foreign Aid Promote Democracy. World Bank, Washington,
DC.
Krueger, A.E. (1997), “Trade Policy and Economic Development: How We Learn”,
American Economic Review, Vol. 87, pp. 1-22.
Levy, V. (1988), “Aid and Growth in Sub-Saharan Africa: The Recent Experience”,
European Economic Review, Vol. 32, pp. 1777-1795.
Markusen, J. and K. Maskus. (1999). “Discrimination among Alternative Theories of
FDI.” NBER Working Paper 7164.
McGillivray, M. and Morrissey, W.O. (eds) (1998), Liberalisation and Adjustment
(London, Macmillan), forthcoming.
McKinnon, R.E. (1964), “Foreign Exchange Constraints in Economic Development and
Efficient Aid Allocation”, Economic Journal, 74, 388-409
Mosley, P. (1980), “Aid, Savings and Growth Revisited”, Bulletin of the Oxford
University Institute of Economics and Statistics, Vol. 42, pp. 79-85.
Obinna, O.E. (1983). “Diversification of Nigeria’s External Finances through Strategic
Foreign Direct Investment”. Nigerian Economic Society Annual Conference Proceedings,
Jos, 13-16th May.
21
Oseghale, B.D. and E.E. Amonkhienan. (1987). “Foreign Debt, Oil Export, Direct
Foreign Investment (1960-1984)”. The Nigerian Journal of Economic and Social Studies,
29(3): 359–80.
Papanek, G. F. (1973). “Aid, Foreign Private Investment, Savings and Growth in Less
Developed Countries”. Journal of Political Economy, 81 (1): 120-30.
Rajan, Raghuram, and Arvind Subramanian. (2005). “What Might Prevent Aid from
Enhancing Growth?” International Monetary Fund, Washington, D.C.
Svensson, J. (2000a) “Foreign Aid and Rent Seeking”, Journal of International
Economics 51 (2): 437-61.
Santiso, Carlos. (2000). “Towards Democratic Governance: The Contribution of the
Multilateral Development Banks in Latin America”, in Peter Burnell, ed., Democracy
Assistance: International Cooperation for Democratization (London: Frank Cass
Publishers), 150-190.
___________. 2001. “International Co-operation for Democracy and Good Governance:
Moving Toward a Second Generation?” European Journal of Development Research
13(1):154-180.
Stiglitz, Joseph. (1999). “The World Bank at the Millennium,” The Economic Journal
109 (November), F577-597.
Svensson, J. (2000b) “When is Foreign Aid Policy Credible? Aid Dependence and
Conditionality”, Journal of Development Economics 61 (1): 61-84.
Voivodas, C.S. (1973). “Exports, Foreign Capital Inflow and Economic Growth”.
Journal of International Economics, 3 (4): 337-49.
Wang, J.Y. and M. Blomstrom. (1992). “Foreign Investment and Technology Transfer: A
Simple Model.” European Economic Review 36: 137-155.
Zhang, Kevin Hongli (1999). “Hod does FDI interact with economic growth in a large
developing country? The case of China”. Economic Systems, 21(4): 291-304.
Zhang, K. (2001) “Does Foreign Direct Investment promote growth? Evidence from East
Asia and Latin America”, Contemporary Economic Policy 19, 2, 175-85.
World Bank “Extreme Poverty Spreading in Sub-Saharan Africa”. The Internet
<http://go.worldbank.org/7U5V8V9TU0>
World Bank. (1996). World Debt Tables: External Finance for Developing Countries,
Vol. 1 (Analysis and Summary Tables). Washington, D.C.: The World Bank.
22
World Bank. 2000. Can Africa Claim the 21st Century? New York: Oxford University
Press.
APPENDIX 1: UNIT ROOT TESTS
Augmented Dickey Fuller (ADF) Phillip Perron (PP)
Variable Level 1st
Difference
Order of
Integration
Level 1st
Difference Order of
Integration
LRGDP -0.5837
*(0.9740)
-4.2573
(0.0097)
I(1) -0.6151
(0.9721)
-5.787
(0.0002)
I(1)
LEXP -2.851
(0.1896)
-3.966
(0.0194)
I(1) -2.9475
(0.1602)
-6.0502
(0.0001)
I (1)
LIMP -2.62
(0.2751)
-3.874
(0.0240)
I(1) -2.4776
(0.3367)
-5.0721
(0.0011)
I(1)
LAID -2.67
(0.255)
-4.83
(0.002)
I(1) -2.1625
(0.4955)
-4.7354
(0.0028)
I(1)
LFDI -2.218
(0.4658)
-6.5427
(0.6000)
I(1) -4.0106
(0.0170)
-13.1793
(0.000)
I(0)
LDINV -1.9370
(0.6147)
-2.9203
(0.1687)
I(2) -1.7686
(0.6995)
-4.2547
(0.0095)
I(1)
Critical Values:
1% - 4.23
5% - 3.54
10%- 3.20
() are the P-values
23
APPENDIX 2: IMPULSE RESPONSE
24
-.05
.00
.05
.10
.15
1 2 3 4 5 6 7 8 9 10
Response of KLRGDP to KLRGDP
-.05
.00
.05
.10
.15
1 2 3 4 5 6 7 8 9 10
Response of KLRGDP to KLFDI
-.05
.00
.05
.10
.15
1 2 3 4 5 6 7 8 9 10
Response of KLRGDP to KLAID
-.05
.00
.05
.10
.15
1 2 3 4 5 6 7 8 9 10
Response of KLRGDP to KLDINV
-.05
.00
.05
.10
.15
1 2 3 4 5 6 7 8 9 10
Response of KLRGDP to KLEX
-.05
.00
.05
.10
.15
1 2 3 4 5 6 7 8 9 10
Response of KLRGDP to KLIMP
-.8
-.4
.0
.4
.8
1 2 3 4 5 6 7 8 9 10
Response of KLFDI to KLRGDP
-.8
-.4
.0
.4
.8
1 2 3 4 5 6 7 8 9 10
Response of KLFDI to KLFDI
-.8
-.4
.0
.4
.8
1 2 3 4 5 6 7 8 9 10
Response of KLFDI to KLAID
-.8
-.4
.0
.4
.8
1 2 3 4 5 6 7 8 9 10
Response of KLFDI to KLDINV
-.8
-.4
.0
.4
.8
1 2 3 4 5 6 7 8 9 10
Response of KLFDI to KLEX
-.8
-.4
.0
.4
.8
1 2 3 4 5 6 7 8 9 10
Response of KLFDI to KLIMP
-.2
-.1
.0
.1
.2
.3
.4
.5
.6
1 2 3 4 5 6 7 8 9 10
Response of KLAID to KLRGDP
-.2
-.1
.0
.1
.2
.3
.4
.5
.6
1 2 3 4 5 6 7 8 9 10
Response of KLAID to KLFDI
-.2
-.1
.0
.1
.2
.3
.4
.5
.6
1 2 3 4 5 6 7 8 9 10
Response of KLAID to KLAID
-.2
-.1
.0
.1
.2
.3
.4
.5
.6
1 2 3 4 5 6 7 8 9 10
Response of KLAID to KLDINV
-.2
-.1
.0
.1
.2
.3
.4
.5
.6
1 2 3 4 5 6 7 8 9 10
Responseof KLAIDtoKLEX
-.2
-.1
.0
.1
.2
.3
.4
.5
.6
1 2 3 4 5 6 7 8 9 10
Response of KLAID to KLIMP
-.2
-.1
.0
.1
.2
.3
.4
1 2 3 4 5 6 7 8 9 10
Response of KLDINV to KLRGDP
-.2
-.1
.0
.1
.2
.3
.4
1 2 3 4 5 6 7 8 9 10
Response of KLDINV to KLFDI
-.2
-.1
.0
.1
.2
.3
.4
1 2 3 4 5 6 7 8 9 10
Response of KLDINV to KLAID
-.2
-.1
.0
.1
.2
.3
.4
1 2 3 4 5 6 7 8 9 10
Response of KLDINV to KLDINV
-.2
-.1
.0
.1
.2
.3
.4
1 2 3 4 5 6 7 8 9 10
Responseof KLDINV toKLEX
-.2
-.1
.0
.1
.2
.3
.4
1 2 3 4 5 6 7 8 9 10
Response of KLDINV to KLIMP
-.2
-.1
.0
.1
.2
.3
.4
1 2 3 4 5 6 7 8 9 10
Response of KLEX to KLRGDP
-.2
-.1
.0
.1
.2
.3
.4
1 2 3 4 5 6 7 8 9 10
Response of KLEX to KLFDI
-.2
-.1
.0
.1
.2
.3
.4
1 2 3 4 5 6 7 8 9 10
Response of KLEX toKLAID
-.2
-.1
.0
.1
.2
.3
.4
1 2 3 4 5 6 7 8 9 10
Responseof KLEX to KLDINV
-.2
-.1
.0
.1
.2
.3
.4
1 2 3 4 5 6 7 8 9 10
Responseof KLEX toKLEX
-.2
-.1
.0
.1
.2
.3
.4
1 2 3 4 5 6 7 8 9 10
Response of KLEX toKLIMP
-.2
-.1
.0
.1
.2
.3
1 2 3 4 5 6 7 8 9 10
Response of KLIMP to KLRGDP
-.2
-.1
.0
.1
.2
.3
1 2 3 4 5 6 7 8 9 10
Response of KLIMP to KLFDI
-.2
-.1
.0
.1
.2
.3
1 2 3 4 5 6 7 8 9 10
Response of KLIMP to KLAID
-.2
-.1
.0
.1
.2
.3
1 2 3 4 5 6 7 8 9 10
Response of KLIMP to KLDINV
-.2
-.1
.0
.1
.2
.3
1 2 3 4 5 6 7 8 9 10
Response of KLIMP to KLEX
-.2
-.1
.0
.1
.2
.3
1 2 3 4 5 6 7 8 9 10
Response of KLIMP to KLIMP
ResponsetoCholesky OneS.D. Innovations
APPENDIX 3: VARIANCE DECOMPOSITION
Variance Decomposition
25
of KLRGDP:
Period S.E. KLRGDP KLFDI KLAID KLDINV KLEX KLIMP
1 0.123798 100.0000 0.000000 0.000000 0.000000 0.000000 0.000000
2 0.154767 65.76889 8.437530 8.394068 7.951837 8.013316 1.434354
3 0.169900 54.70480 9.663150 7.122894 12.01037 7.320184 9.178597
4 0.174252 52.01832 11.25674 6.774977 11.58932 7.012901 11.34774
5 0.184054 51.59011 13.70808 6.272471 10.39486 7.621239 10.41323
6 0.185859 50.60722 14.34517 6.356272 10.69483 7.608001 10.38851
7 0.190519 48.50369 14.39567 6.094540 12.28790 7.551852 11.16635
8 0.192010 47.82272 14.97355 6.248031 12.24025 7.684088 11.03136
9 0.192624 47.75430 14.95117 6.211043 12.24017 7.877443 10.96587
10 0.193044 47.55079 14.88652 6.197314 12.36713 8.078873 10.91936
Variance Decomposition
of KLFDI:
Period S.E. KLRGDP KLFDI KLAID KLDINV KLEX KLIMP
1 0.740623 1.862669 98.13733 0.000000 0.000000 0.000000 0.000000
2 1.073082 1.819130 92.94011 0.431305 3.732261 1.066408 0.010789
3 1.181349 5.973889 87.72340 0.895938 4.232394 0.933037 0.241343
4 1.229572 5.864214 82.32918 3.358659 4.464488 3.620799 0.362660
5 1.278164 6.372320 76.38298 3.494073 6.586062 6.472452 0.692112
6 1.303195 6.944384 75.26702 3.532195 6.811668 6.727778 0.716953
7 1.320870 6.963542 75.01657 3.556731 6.819805 6.588578 1.054779
8 1.328086 7.014028 74.88016 3.520794 6.764158 6.554648 1.266210
9 1.329049 7.019998 74.79121 3.562936 6.765637 6.589367 1.270852
10 1.333349 6.977578 74.63190 3.560927 6.853429 6.642822 1.333340
Variance Decomposition
of KLAID:
Period S.E. KLRGDP KLFDI KLAID KLDINV KLEX KLIMP
1 0.597454 22.91558 1.221771 75.86265 0.000000 0.000000 0.000000
2 0.620065 21.57543 1.171983 71.32712 0.026677 0.270875 5.627909
3 0.630620 22.88262 1.715176 68.98936 0.703197 0.263567 5.446085
4 0.642386 23.84216 1.652921 66.48559 1.176643 1.509897 5.332788
5 0.650401 23.26748 2.088046 64.86107 2.426237 1.845343 5.511824
6 0.653767 23.24746 2.078224 64.20376 2.515282 1.844644 6.110630
7 0.655418 23.51617 2.102919 63.93372 2.503889 1.863389 6.079914
8 0.657358 23.47424 2.090708 63.55713 2.693975 2.139840 6.044109
9 0.658506 23.39338 2.149365 63.33591 2.840421 2.146238 6.134683
10 0.659074 23.46026 2.148080 63.22837 2.844137 2.143608 6.175539
Variance Decomposition
26
of KLDINV:
Period S.E. KLRGDP KLFDI KLAID KLDINV KLEX KLIMP
1 0.380951 5.201617 7.435944 0.165153 87.19729 0.000000 0.000000
2 0.467856 5.037329 13.28741 0.186418 75.16507 4.002808 2.320969
3 0.493946 8.348750 12.93663 0.527585 71.66756 3.591229 2.928241
4 0.500376 8.166133 13.76463 1.617058 69.92908 3.558631 2.964460
5 0.515652 7.699576 14.55753 1.791411 68.10465 4.418139 3.428699
6 0.517731 7.693714 15.08331 1.780115 67.55868 4.463366 3.420816
7 0.519094 7.968375 15.09438 1.836357 67.21150 4.486486 3.402906
8 0.520926 7.995779 15.01115 1.826053 67.03685 4.747592 3.382574
9 0.521489 8.015348 15.05349 1.834015 66.91229 4.751038 3.433820
10 0.522102 8.012437 15.16254 1.832271 66.76261 4.740464 3.489676
Variance Decomposition
of KLEX:
Period S.E. KLRGDP KLFDI KLAID KLDINV KLEX KLIMP
1 0.405345 0.521838 0.664525 2.336485 28.67826 67.79890 0.000000
2 0.484393 4.873610 1.811576 3.371461 35.53521 47.69339 6.714751
3 0.522384 6.262767 12.73033 3.008580 30.88581 41.00888 6.103627
4 0.529897 6.087949 13.98512 3.576571 30.31819 39.85655 6.175610
5 0.534328 6.740631 13.96541 3.664868 30.10218 39.28478 6.242128
6 0.539818 6.662690 14.58828 4.018201 29.49420 39.05117 6.185453
7 0.546461 6.556713 15.94324 3.944771 29.17291 38.20116 6.181211
8 0.549874 6.480671 16.92692 3.914999 28.82299 37.73785 6.116565
9 0.550716 6.490750 16.96336 3.906661 28.83054 37.70889 6.099803
10 0.551891 6.584809 16.92255 3.939603 28.78152 37.69396 6.077557
Variance Decomposition
of KLIMP:
Period S.E. KLRGDP KLFDI KLAID KLDINV KLEX KLIMP
1 0.390089 2.294448 8.281972 0.441789 50.21157 12.22034 26.54989
2 0.538937 1.468271 16.75705 0.395878 54.54992 9.307551 17.52133
3 0.553262 1.686748 17.33250 1.080213 52.36193 10.09890 17.43971
4 0.571545 1.751751 20.34410 1.218479 50.01776 10.08007 16.58784
5 0.586251 1.828539 22.00813 1.641319 48.05927 10.57450 15.88823
6 0.589491 1.817416 22.57070 1.714995 47.53710 10.64315 15.71664
7 0.593562 1.793692 22.72343 1.837123 46.97646 11.16747 15.50182
8 0.594728 1.842128 22.71172 1.830129 46.82011 11.30467 15.49124
9 0.596426 2.211073 22.67156 1.832362 46.59052 11.28334 15.41115
10 0.597759 2.205563 22.86573 1.889806 46.39031 11.23378 15.41481
Cholesky Ordering:
KLRGDP KLFDI
KLAID KLDINV KLEX
KLIMP
27
DATA SOURCES
Variable Description Source
EXP Exports of Goods and Services International Financial Statistics
IMP Imports of Goods and Services International Financial Statistics
AID Official Development Assistance, ODA Quality of Government Data set June 17, 2009
FDI Net Foreign Direct Investment Quality of Government Data set June 17, 2009
RGDP Real Gross Domestic Product Quality of Government Data set June 17, 2009
DIV Domestic Investment International Financial Statistics

More Related Content

Similar to This is a lirature review sourced from Internet. It is not mine

Tax Incentives and Foreign Direct Investment in Nigeria
Tax Incentives and Foreign Direct Investment in NigeriaTax Incentives and Foreign Direct Investment in Nigeria
Tax Incentives and Foreign Direct Investment in Nigeriaiosrjce
 
The Short-Run Impact of FDI on Nigerian Economy
The Short-Run Impact of FDI on Nigerian EconomyThe Short-Run Impact of FDI on Nigerian Economy
The Short-Run Impact of FDI on Nigerian Economypaperpublications3
 
Foreign Direct Investment and Development of Manufacturing Sector in Nigeria ...
Foreign Direct Investment and Development of Manufacturing Sector in Nigeria ...Foreign Direct Investment and Development of Manufacturing Sector in Nigeria ...
Foreign Direct Investment and Development of Manufacturing Sector in Nigeria ...inventionjournals
 
Foreign Investment and Its Effect on the Economic Growth in Nigeria: A Triang...
Foreign Investment and Its Effect on the Economic Growth in Nigeria: A Triang...Foreign Investment and Its Effect on the Economic Growth in Nigeria: A Triang...
Foreign Investment and Its Effect on the Economic Growth in Nigeria: A Triang...iosrjce
 
Determinants of Foreign Direct Investment in Nigeria
Determinants of Foreign Direct Investment in NigeriaDeterminants of Foreign Direct Investment in Nigeria
Determinants of Foreign Direct Investment in Nigeriaijtsrd
 
Determinants of Foreign Direct Investment in Nigeria (1977-2008) OLADAPO TOLU...
Determinants of Foreign Direct Investment in Nigeria (1977-2008) OLADAPO TOLU...Determinants of Foreign Direct Investment in Nigeria (1977-2008) OLADAPO TOLU...
Determinants of Foreign Direct Investment in Nigeria (1977-2008) OLADAPO TOLU...dapoace
 
Analysis of the effects of capital flight on economic growth evidence from ni...
Analysis of the effects of capital flight on economic growth evidence from ni...Analysis of the effects of capital flight on economic growth evidence from ni...
Analysis of the effects of capital flight on economic growth evidence from ni...Alexander Decker
 
The impact of interest rates on the development of an emerging market empiric...
The impact of interest rates on the development of an emerging market empiric...The impact of interest rates on the development of an emerging market empiric...
The impact of interest rates on the development of an emerging market empiric...Alexander Decker
 
Empirical study of the relationship between available forms of finance and pe...
Empirical study of the relationship between available forms of finance and pe...Empirical study of the relationship between available forms of finance and pe...
Empirical study of the relationship between available forms of finance and pe...Alexander Decker
 
11.[27 40]the impact of macroeconomic variables on non-oil exports performanc...
11.[27 40]the impact of macroeconomic variables on non-oil exports performanc...11.[27 40]the impact of macroeconomic variables on non-oil exports performanc...
11.[27 40]the impact of macroeconomic variables on non-oil exports performanc...Alexander Decker
 
External Reserves and Economic Growth in Nigeria
External Reserves and Economic Growth in NigeriaExternal Reserves and Economic Growth in Nigeria
External Reserves and Economic Growth in Nigeriaijtsrd
 
Vectorautoregressivemodel and the nigerian economy
Vectorautoregressivemodel and the nigerian economyVectorautoregressivemodel and the nigerian economy
Vectorautoregressivemodel and the nigerian economyAlexander Decker
 
FINANCIAL DEEPENING AND FOREIGN DIRECT INVESTMENT IN NIGERIA
FINANCIAL DEEPENING AND FOREIGN DIRECT INVESTMENT IN NIGERIAFINANCIAL DEEPENING AND FOREIGN DIRECT INVESTMENT IN NIGERIA
FINANCIAL DEEPENING AND FOREIGN DIRECT INVESTMENT IN NIGERIAAJHSSR Journal
 
Cointegration and Causality Inferences on Domestic Savings, Investment and Ec...
Cointegration and Causality Inferences on Domestic Savings, Investment and Ec...Cointegration and Causality Inferences on Domestic Savings, Investment and Ec...
Cointegration and Causality Inferences on Domestic Savings, Investment and Ec...Associate Professor in VSB Coimbatore
 
Analyzing the Effect of Government Expenditure on Inflation Rate in Nigeria 1...
Analyzing the Effect of Government Expenditure on Inflation Rate in Nigeria 1...Analyzing the Effect of Government Expenditure on Inflation Rate in Nigeria 1...
Analyzing the Effect of Government Expenditure on Inflation Rate in Nigeria 1...ijtsrd
 
Foreign Aid and Fiscal Behaviour in Nigeria: An Impact Assessment of Deregula...
Foreign Aid and Fiscal Behaviour in Nigeria: An Impact Assessment of Deregula...Foreign Aid and Fiscal Behaviour in Nigeria: An Impact Assessment of Deregula...
Foreign Aid and Fiscal Behaviour in Nigeria: An Impact Assessment of Deregula...iosrjce
 
Chile, Indonesia, And Turkey
Chile, Indonesia, And TurkeyChile, Indonesia, And Turkey
Chile, Indonesia, And TurkeyKelley Hunter
 
Exchange Rate and Trade Balance Nexus
Exchange Rate and Trade Balance NexusExchange Rate and Trade Balance Nexus
Exchange Rate and Trade Balance NexusYogeshIJTSRD
 

Similar to This is a lirature review sourced from Internet. It is not mine (20)

Tax Incentives and Foreign Direct Investment in Nigeria
Tax Incentives and Foreign Direct Investment in NigeriaTax Incentives and Foreign Direct Investment in Nigeria
Tax Incentives and Foreign Direct Investment in Nigeria
 
The Short-Run Impact of FDI on Nigerian Economy
The Short-Run Impact of FDI on Nigerian EconomyThe Short-Run Impact of FDI on Nigerian Economy
The Short-Run Impact of FDI on Nigerian Economy
 
Foreign Direct Investment and Development of Manufacturing Sector in Nigeria ...
Foreign Direct Investment and Development of Manufacturing Sector in Nigeria ...Foreign Direct Investment and Development of Manufacturing Sector in Nigeria ...
Foreign Direct Investment and Development of Manufacturing Sector in Nigeria ...
 
Foreign Capital Distribution in Nigeria: Policy Implications for the Agricult...
Foreign Capital Distribution in Nigeria: Policy Implications for the Agricult...Foreign Capital Distribution in Nigeria: Policy Implications for the Agricult...
Foreign Capital Distribution in Nigeria: Policy Implications for the Agricult...
 
Foreign Investment and Its Effect on the Economic Growth in Nigeria: A Triang...
Foreign Investment and Its Effect on the Economic Growth in Nigeria: A Triang...Foreign Investment and Its Effect on the Economic Growth in Nigeria: A Triang...
Foreign Investment and Its Effect on the Economic Growth in Nigeria: A Triang...
 
Determinants of Foreign Direct Investment in Nigeria
Determinants of Foreign Direct Investment in NigeriaDeterminants of Foreign Direct Investment in Nigeria
Determinants of Foreign Direct Investment in Nigeria
 
Determinants of Foreign Direct Investment in Nigeria (1977-2008) OLADAPO TOLU...
Determinants of Foreign Direct Investment in Nigeria (1977-2008) OLADAPO TOLU...Determinants of Foreign Direct Investment in Nigeria (1977-2008) OLADAPO TOLU...
Determinants of Foreign Direct Investment in Nigeria (1977-2008) OLADAPO TOLU...
 
Analysis of the effects of capital flight on economic growth evidence from ni...
Analysis of the effects of capital flight on economic growth evidence from ni...Analysis of the effects of capital flight on economic growth evidence from ni...
Analysis of the effects of capital flight on economic growth evidence from ni...
 
The impact of interest rates on the development of an emerging market empiric...
The impact of interest rates on the development of an emerging market empiric...The impact of interest rates on the development of an emerging market empiric...
The impact of interest rates on the development of an emerging market empiric...
 
Empirical study of the relationship between available forms of finance and pe...
Empirical study of the relationship between available forms of finance and pe...Empirical study of the relationship between available forms of finance and pe...
Empirical study of the relationship between available forms of finance and pe...
 
11.[27 40]the impact of macroeconomic variables on non-oil exports performanc...
11.[27 40]the impact of macroeconomic variables on non-oil exports performanc...11.[27 40]the impact of macroeconomic variables on non-oil exports performanc...
11.[27 40]the impact of macroeconomic variables on non-oil exports performanc...
 
External Reserves and Economic Growth in Nigeria
External Reserves and Economic Growth in NigeriaExternal Reserves and Economic Growth in Nigeria
External Reserves and Economic Growth in Nigeria
 
Vectorautoregressivemodel and the nigerian economy
Vectorautoregressivemodel and the nigerian economyVectorautoregressivemodel and the nigerian economy
Vectorautoregressivemodel and the nigerian economy
 
FINANCIAL DEEPENING AND FOREIGN DIRECT INVESTMENT IN NIGERIA
FINANCIAL DEEPENING AND FOREIGN DIRECT INVESTMENT IN NIGERIAFINANCIAL DEEPENING AND FOREIGN DIRECT INVESTMENT IN NIGERIA
FINANCIAL DEEPENING AND FOREIGN DIRECT INVESTMENT IN NIGERIA
 
Cointegration and Causality Inferences on Domestic Savings, Investment and Ec...
Cointegration and Causality Inferences on Domestic Savings, Investment and Ec...Cointegration and Causality Inferences on Domestic Savings, Investment and Ec...
Cointegration and Causality Inferences on Domestic Savings, Investment and Ec...
 
Analyzing the Effect of Government Expenditure on Inflation Rate in Nigeria 1...
Analyzing the Effect of Government Expenditure on Inflation Rate in Nigeria 1...Analyzing the Effect of Government Expenditure on Inflation Rate in Nigeria 1...
Analyzing the Effect of Government Expenditure on Inflation Rate in Nigeria 1...
 
Foreign Aid and Fiscal Behaviour in Nigeria: An Impact Assessment of Deregula...
Foreign Aid and Fiscal Behaviour in Nigeria: An Impact Assessment of Deregula...Foreign Aid and Fiscal Behaviour in Nigeria: An Impact Assessment of Deregula...
Foreign Aid and Fiscal Behaviour in Nigeria: An Impact Assessment of Deregula...
 
Chile, Indonesia, And Turkey
Chile, Indonesia, And TurkeyChile, Indonesia, And Turkey
Chile, Indonesia, And Turkey
 
Exchange Rate and Trade Balance Nexus
Exchange Rate and Trade Balance NexusExchange Rate and Trade Balance Nexus
Exchange Rate and Trade Balance Nexus
 
D0333027032
D0333027032D0333027032
D0333027032
 

Recently uploaded

Case study on tata clothing brand zudio in detail
Case study on tata clothing brand zudio in detailCase study on tata clothing brand zudio in detail
Case study on tata clothing brand zudio in detailAriel592675
 
NewBase 22 April 2024 Energy News issue - 1718 by Khaled Al Awadi (AutoRe...
NewBase  22 April  2024  Energy News issue - 1718 by Khaled Al Awadi  (AutoRe...NewBase  22 April  2024  Energy News issue - 1718 by Khaled Al Awadi  (AutoRe...
NewBase 22 April 2024 Energy News issue - 1718 by Khaled Al Awadi (AutoRe...Khaled Al Awadi
 
Tech Startup Growth Hacking 101 - Basics on Growth Marketing
Tech Startup Growth Hacking 101  - Basics on Growth MarketingTech Startup Growth Hacking 101  - Basics on Growth Marketing
Tech Startup Growth Hacking 101 - Basics on Growth MarketingShawn Pang
 
Keppel Ltd. 1Q 2024 Business Update Presentation Slides
Keppel Ltd. 1Q 2024 Business Update  Presentation SlidesKeppel Ltd. 1Q 2024 Business Update  Presentation Slides
Keppel Ltd. 1Q 2024 Business Update Presentation SlidesKeppelCorporation
 
rishikeshgirls.in- Rishikesh call girl.pdf
rishikeshgirls.in- Rishikesh call girl.pdfrishikeshgirls.in- Rishikesh call girl.pdf
rishikeshgirls.in- Rishikesh call girl.pdfmuskan1121w
 
Investment analysis and portfolio management
Investment analysis and portfolio managementInvestment analysis and portfolio management
Investment analysis and portfolio managementJunaidKhan750825
 
(8264348440) 🔝 Call Girls In Keshav Puram 🔝 Delhi NCR
(8264348440) 🔝 Call Girls In Keshav Puram 🔝 Delhi NCR(8264348440) 🔝 Call Girls In Keshav Puram 🔝 Delhi NCR
(8264348440) 🔝 Call Girls In Keshav Puram 🔝 Delhi NCRsoniya singh
 
Non Text Magic Studio Magic Design for Presentations L&P.pptx
Non Text Magic Studio Magic Design for Presentations L&P.pptxNon Text Magic Studio Magic Design for Presentations L&P.pptx
Non Text Magic Studio Magic Design for Presentations L&P.pptxAbhayThakur200703
 
Marketing Management Business Plan_My Sweet Creations
Marketing Management Business Plan_My Sweet CreationsMarketing Management Business Plan_My Sweet Creations
Marketing Management Business Plan_My Sweet Creationsnakalysalcedo61
 
CATALOG cáp điện Goldcup (bảng giá) 1.4.2024.PDF
CATALOG cáp điện Goldcup (bảng giá) 1.4.2024.PDFCATALOG cáp điện Goldcup (bảng giá) 1.4.2024.PDF
CATALOG cáp điện Goldcup (bảng giá) 1.4.2024.PDFOrient Homes
 
/:Call Girls In Indirapuram Ghaziabad ➥9990211544 Independent Best Escorts In...
/:Call Girls In Indirapuram Ghaziabad ➥9990211544 Independent Best Escorts In.../:Call Girls In Indirapuram Ghaziabad ➥9990211544 Independent Best Escorts In...
/:Call Girls In Indirapuram Ghaziabad ➥9990211544 Independent Best Escorts In...lizamodels9
 
Vip Dewas Call Girls #9907093804 Contact Number Escorts Service Dewas
Vip Dewas Call Girls #9907093804 Contact Number Escorts Service DewasVip Dewas Call Girls #9907093804 Contact Number Escorts Service Dewas
Vip Dewas Call Girls #9907093804 Contact Number Escorts Service Dewasmakika9823
 
Vip Female Escorts Noida 9711199171 Greater Noida Escorts Service
Vip Female Escorts Noida 9711199171 Greater Noida Escorts ServiceVip Female Escorts Noida 9711199171 Greater Noida Escorts Service
Vip Female Escorts Noida 9711199171 Greater Noida Escorts Serviceankitnayak356677
 
Call Girls in DELHI Cantt, ( Call Me )-8377877756-Female Escort- In Delhi / Ncr
Call Girls in DELHI Cantt, ( Call Me )-8377877756-Female Escort- In Delhi / NcrCall Girls in DELHI Cantt, ( Call Me )-8377877756-Female Escort- In Delhi / Ncr
Call Girls in DELHI Cantt, ( Call Me )-8377877756-Female Escort- In Delhi / Ncrdollysharma2066
 
2024 Numerator Consumer Study of Cannabis Usage
2024 Numerator Consumer Study of Cannabis Usage2024 Numerator Consumer Study of Cannabis Usage
2024 Numerator Consumer Study of Cannabis UsageNeil Kimberley
 
Islamabad Escorts | Call 03274100048 | Escort Service in Islamabad
Islamabad Escorts | Call 03274100048 | Escort Service in IslamabadIslamabad Escorts | Call 03274100048 | Escort Service in Islamabad
Islamabad Escorts | Call 03274100048 | Escort Service in IslamabadAyesha Khan
 
Intro to BCG's Carbon Emissions Benchmark_vF.pdf
Intro to BCG's Carbon Emissions Benchmark_vF.pdfIntro to BCG's Carbon Emissions Benchmark_vF.pdf
Intro to BCG's Carbon Emissions Benchmark_vF.pdfpollardmorgan
 
(8264348440) 🔝 Call Girls In Hauz Khas 🔝 Delhi NCR
(8264348440) 🔝 Call Girls In Hauz Khas 🔝 Delhi NCR(8264348440) 🔝 Call Girls In Hauz Khas 🔝 Delhi NCR
(8264348440) 🔝 Call Girls In Hauz Khas 🔝 Delhi NCRsoniya singh
 
Progress Report - Oracle Database Analyst Summit
Progress  Report - Oracle Database Analyst SummitProgress  Report - Oracle Database Analyst Summit
Progress Report - Oracle Database Analyst SummitHolger Mueller
 
Call Girls In ⇛⇛Chhatarpur⇚⇚. Brings Offer Delhi Contact Us 8377877756
Call Girls In ⇛⇛Chhatarpur⇚⇚. Brings Offer Delhi Contact Us 8377877756Call Girls In ⇛⇛Chhatarpur⇚⇚. Brings Offer Delhi Contact Us 8377877756
Call Girls In ⇛⇛Chhatarpur⇚⇚. Brings Offer Delhi Contact Us 8377877756dollysharma2066
 

Recently uploaded (20)

Case study on tata clothing brand zudio in detail
Case study on tata clothing brand zudio in detailCase study on tata clothing brand zudio in detail
Case study on tata clothing brand zudio in detail
 
NewBase 22 April 2024 Energy News issue - 1718 by Khaled Al Awadi (AutoRe...
NewBase  22 April  2024  Energy News issue - 1718 by Khaled Al Awadi  (AutoRe...NewBase  22 April  2024  Energy News issue - 1718 by Khaled Al Awadi  (AutoRe...
NewBase 22 April 2024 Energy News issue - 1718 by Khaled Al Awadi (AutoRe...
 
Tech Startup Growth Hacking 101 - Basics on Growth Marketing
Tech Startup Growth Hacking 101  - Basics on Growth MarketingTech Startup Growth Hacking 101  - Basics on Growth Marketing
Tech Startup Growth Hacking 101 - Basics on Growth Marketing
 
Keppel Ltd. 1Q 2024 Business Update Presentation Slides
Keppel Ltd. 1Q 2024 Business Update  Presentation SlidesKeppel Ltd. 1Q 2024 Business Update  Presentation Slides
Keppel Ltd. 1Q 2024 Business Update Presentation Slides
 
rishikeshgirls.in- Rishikesh call girl.pdf
rishikeshgirls.in- Rishikesh call girl.pdfrishikeshgirls.in- Rishikesh call girl.pdf
rishikeshgirls.in- Rishikesh call girl.pdf
 
Investment analysis and portfolio management
Investment analysis and portfolio managementInvestment analysis and portfolio management
Investment analysis and portfolio management
 
(8264348440) 🔝 Call Girls In Keshav Puram 🔝 Delhi NCR
(8264348440) 🔝 Call Girls In Keshav Puram 🔝 Delhi NCR(8264348440) 🔝 Call Girls In Keshav Puram 🔝 Delhi NCR
(8264348440) 🔝 Call Girls In Keshav Puram 🔝 Delhi NCR
 
Non Text Magic Studio Magic Design for Presentations L&P.pptx
Non Text Magic Studio Magic Design for Presentations L&P.pptxNon Text Magic Studio Magic Design for Presentations L&P.pptx
Non Text Magic Studio Magic Design for Presentations L&P.pptx
 
Marketing Management Business Plan_My Sweet Creations
Marketing Management Business Plan_My Sweet CreationsMarketing Management Business Plan_My Sweet Creations
Marketing Management Business Plan_My Sweet Creations
 
CATALOG cáp điện Goldcup (bảng giá) 1.4.2024.PDF
CATALOG cáp điện Goldcup (bảng giá) 1.4.2024.PDFCATALOG cáp điện Goldcup (bảng giá) 1.4.2024.PDF
CATALOG cáp điện Goldcup (bảng giá) 1.4.2024.PDF
 
/:Call Girls In Indirapuram Ghaziabad ➥9990211544 Independent Best Escorts In...
/:Call Girls In Indirapuram Ghaziabad ➥9990211544 Independent Best Escorts In.../:Call Girls In Indirapuram Ghaziabad ➥9990211544 Independent Best Escorts In...
/:Call Girls In Indirapuram Ghaziabad ➥9990211544 Independent Best Escorts In...
 
Vip Dewas Call Girls #9907093804 Contact Number Escorts Service Dewas
Vip Dewas Call Girls #9907093804 Contact Number Escorts Service DewasVip Dewas Call Girls #9907093804 Contact Number Escorts Service Dewas
Vip Dewas Call Girls #9907093804 Contact Number Escorts Service Dewas
 
Vip Female Escorts Noida 9711199171 Greater Noida Escorts Service
Vip Female Escorts Noida 9711199171 Greater Noida Escorts ServiceVip Female Escorts Noida 9711199171 Greater Noida Escorts Service
Vip Female Escorts Noida 9711199171 Greater Noida Escorts Service
 
Call Girls in DELHI Cantt, ( Call Me )-8377877756-Female Escort- In Delhi / Ncr
Call Girls in DELHI Cantt, ( Call Me )-8377877756-Female Escort- In Delhi / NcrCall Girls in DELHI Cantt, ( Call Me )-8377877756-Female Escort- In Delhi / Ncr
Call Girls in DELHI Cantt, ( Call Me )-8377877756-Female Escort- In Delhi / Ncr
 
2024 Numerator Consumer Study of Cannabis Usage
2024 Numerator Consumer Study of Cannabis Usage2024 Numerator Consumer Study of Cannabis Usage
2024 Numerator Consumer Study of Cannabis Usage
 
Islamabad Escorts | Call 03274100048 | Escort Service in Islamabad
Islamabad Escorts | Call 03274100048 | Escort Service in IslamabadIslamabad Escorts | Call 03274100048 | Escort Service in Islamabad
Islamabad Escorts | Call 03274100048 | Escort Service in Islamabad
 
Intro to BCG's Carbon Emissions Benchmark_vF.pdf
Intro to BCG's Carbon Emissions Benchmark_vF.pdfIntro to BCG's Carbon Emissions Benchmark_vF.pdf
Intro to BCG's Carbon Emissions Benchmark_vF.pdf
 
(8264348440) 🔝 Call Girls In Hauz Khas 🔝 Delhi NCR
(8264348440) 🔝 Call Girls In Hauz Khas 🔝 Delhi NCR(8264348440) 🔝 Call Girls In Hauz Khas 🔝 Delhi NCR
(8264348440) 🔝 Call Girls In Hauz Khas 🔝 Delhi NCR
 
Progress Report - Oracle Database Analyst Summit
Progress  Report - Oracle Database Analyst SummitProgress  Report - Oracle Database Analyst Summit
Progress Report - Oracle Database Analyst Summit
 
Call Girls In ⇛⇛Chhatarpur⇚⇚. Brings Offer Delhi Contact Us 8377877756
Call Girls In ⇛⇛Chhatarpur⇚⇚. Brings Offer Delhi Contact Us 8377877756Call Girls In ⇛⇛Chhatarpur⇚⇚. Brings Offer Delhi Contact Us 8377877756
Call Girls In ⇛⇛Chhatarpur⇚⇚. Brings Offer Delhi Contact Us 8377877756
 

This is a lirature review sourced from Internet. It is not mine

  • 1. 1 THE TWO-GAP MODEL OF ECONOMIC GROWTH IN NIGERIA: VECTOR AUTOREGRESSION (VAR) APPROACH Abstract This paper explores the relevance and application of the theoretical prescriptions of the Two-Gap model to the Nigerian economic growth situation from 1970-2007. A co- integration test confirmed that long run relationship exists among the variables, giving an indication that they have the tendency to reach equilibrium in the long run. It was apparent from the results of the autoregression analysis that foreign aid does not give clear evidence of an imperative growth factor in Nigeria, FDI does but is volatile. This further confirmed the transfer paradox – which posits that foreign aid tends to immiserate the recipient country. The endogeneity of aid on real GDP re-emphasizes the imperative of economic reforms as a condition for aid. The study found no theoretical or empirical justification for the assumption that filling a “trade gap” determined by “aid requirements” will boost trade and growth in the Nigerian economy. JEL Classification: F13; O11; C01 Key Words: Two-Gap Model, Economic Growth, Foreign Aid and FDI, Vector Autoregression, Co integration. 1. Introduction Nigeria with a population of over 150 million people, endowed with human and natural resources, has agriculture as its mainstay and was the largest exporter of cocoa, coffee, and rubber to mention but a few. Paradoxically, the oil boom of 1970s was a period when the revenue realized from oil should have improved the lives of many Nigerians, but alas reverse was the case. The huge revenue from oil resulted in the neglect of the agricultural sector such that Nigeria’s economy was reduced to a mono-cultural economy. Our pattern of production also become faulty to the extent that the ripple effect of the economic* problem resulting from oil as a main source of export led to the collapse of the textile and some industries; most especially the manufacturing industry. Consequently, Nigerian economy productive capacity runs below expectation. From the foregoing, two major economic problems emerge and these are inadequate savings and a deteriorating terms of trade. At the time when other countries in the world were expanding, Nigerian economy remained anaemic, with the growth rate of the economy remaining sluggish and stunted, thus raising the number of poor people astronomically. The misappropriation of the oil proceeds pushed many into the dark and eventually led to the Dutch Disease; evidenced by poor economic performance and increased poverty rate. Since the return to democratic rule in 1999, the economy has been trying to pick up from the doldrums which was caused by the military mismanagement. In year 2000 and 2001 alone, GDP rose by 3.83% and 4.21% respectively; a record above the average growth rate of 2.6% recorded *
  • 2. 2 from 1992 to 1998. Despite this increase, Nigeria still records a considerably high proportion of poor people in the world, having over 60% of the population living below the poverty line. The bane of Nigeria's underdevelopment has been attributed to the lack of infrastructural facilities, wrong policy frameworks, hostile environment, backwardness in technology, problem of unemployment and over-dependence on imported products amongst other factors. The National Economic Empowerment Development Strategy (NEEDS) document a blueprint for improving the economy. For instance, The NEEDS program targeted minimum annual GDP growth rates of 5% in 2004 but achieved 4.2%, while 6% growth rate was targeted in 2005 and 2006 but realized 4.5% and 6.1% growth rates respectively. Also, 7% growth rate was targeted in 2007 but realized 7.4% which is above the targeted growth, in year 2008, GDP growth rate of 11% was targeted. On the whole, the average growth rate of the economy between 2003 and 2006 hover around 6%. These statistics actually show an improvement in the economic output, but to what extent does this statistics affect the living standard of the people considering the different and relative economic variables used as a tool for driving growth in Nigeria. Though much attention had focused on domestic savings and export earnings (especially oil export), the duo have not justified Nigeria’s economic growth pattern as there exists some inherent developmental rigidities which encumber their usefulness. Foreign aid should be channeled to those countries that have a balance of payments constraint while foreign direct investment should be directed to augment the domestic savings. Foreign aid and foreign direct investment will therefore be reviewed to palliate the short comings of export earnings and domestic savings respectively. Two-Gap Models of development are contained in the Post-Keynesian growth models for closed economies as designed by Harrod (1939) and Domar (1946). They tried to identify the pre-conditions for the economic growth of market economies. These two pre- conditions are essentially rooted in the Nigerian economy and these are (1) Internally: inadequate savings would definitely translate to investment. The GAP between these two is called saving constraints (SAVING GAP). Closing this gap requires foreign direct investment (FDI). (2) Externally: inadequate foreign exchange arising from inability to export vis-à-vis high importation will lead to short fall in foreign exchange. The GAP between this duo is called foreign exchange constraints (TRADE GAP) which can be corrected by foreign aid. Nigerian leaders resorted to foreign aid assistance from developed countries, multilateral and bilateral international organizations to salvage the economy from total collapse. Therefore, to emphasize the need for economic growth and development, there is need to diversify the economy from oil exploration and exploitation to productive effort of agricultural and other real sectors. However, inability to revive these sectors spells doom to the trade and investment platform of Nigeria. The two-gap model of growth has been adopted as a tool to bring the economy to bear on the path of growth and if possible, salvage the economy. This paper aims at establishing whether or not the theoretical prescription that the two-gap model of economic growth purports holds in Nigeria. The rest of the paper is structured as follows. Section 2 explicates the theoretical background of the two-gap model, while Section 3 discusses the
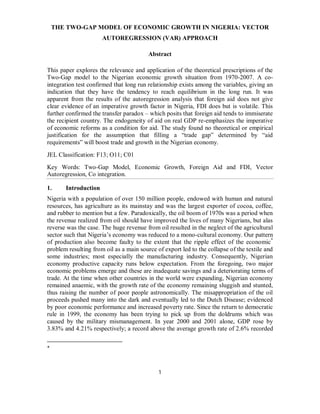
  • 3. 3 methodology. Empirical results are presented in Section 4, while the conclusion and policy recommendations are contained in the last section. 2. Theoretical Underpinnings and Literature Review 2.1. Review of Foreign Direct Investment and Economic Growth It has been observed that domestic savings, if properly mobilized, can encourage an improvement in the economic activities through investment. One of the major economic problems of any developing and underdeveloped countries is inadequate savings. Inadequate domestic savings or inappropriate mobilization of savings for investment purposes is what is termed in the literature as savings constraint (SAVING GAP). This gap can be corrected by encouraging the foreign direct investment (FDI) otherwise known as foreign capital inflow. The major focus of this section is to indicate the effect of FDI on economic growth in Nigeria. Attracting foreign direct investment would tend to improve economic conditions while its volatility can trigger macro economic instability in the country, especially Nigeria. From the literature, FDI is an investment made to acquire a lasting management interest (normally 10% of voting stock) in a business enterprise operating in a country other than that of the investor as defined by the residency (World Bank,1996). One of the purposes for which the New Partnership for Africa’s development (NEPAD) was established is to encourage the inflow of FDI inform of new technology, refined marketing strategy and management. Asiedu (2001) submits that the determinants of FDI in one region may not be the same for other regions. In that case, the major source of FDI in countries within a region may be different from one another with time variance. Hanson (2001) argues that the evidence that FDI generates positive spillovers for host countries is weak. In a review of micro data on spillovers from foreign-owned to domestically owned firms, Gorg and Greenwood (2002) conclude that the effects are mostly negative. Basu and Srinivasan (2002) analyzed FDI in African countries and argued that the main determinants of FDI flows in Africa can be divided into four categories – natural resource, specific locational advantage, policies towards FDI and economic reforms. Meanwhile, the ratio of FDI to GDP is captured in figure 1. Figure 1: FDI as a percentage of GDP in Nigeria .0 .1 .2 .3 .4 .5 .6 .7 .8 1970 1975 1980 1985 1990 1995 2000 2005 FDI RGDP It is instructive to note that successive Nigerian governments reckoned with FDI as a vehicle for political and economic domination. Figure 1 clearly depicts spiral movement of the ratio of FDI inflow to real GDP in Nigeria. In 1983, 1993, 1995 and 1999 (four years), Nigeria witnessed higher ratio of FDI to real GDP. This relationship occupies the
  • 4. 4 central impact of FDI to the Nigerian economy; one could adjudge this spiral movement, especially from 1970 to 1999, to instability of FDI resulting from unstable political structures of the economy. However, from 1999 to 2007, the ratio is consistent and almost stable; this could have been attributed to the impact of return to democracy in which the governments (both federal and state) woos the foreign investors of the need to invest in Nigeria economy. This effort no doubt, impacts positively on the economy making the growth in both FDI and real GDP move by almost the same proportion. Success was recorded by embarking on various micro and macroeconomic policies, projects and programmes that facilitated FDI attraction initiatives. No foreign investors would dare to risk his life by investing in a country whose economy is shaky, stunted, and unstable (e.g military rule). But, the success of FDI is determined majorly by the political and economic factors prevailing in that country. The collapse of the world oil prices of the 1980s due to the glut in the international market accounted for investment withdrawals and thus a low level of FDI inflow. Company Taxes Act 1961, Exchange Control Act and Immigration Act could also have contributed largely in the discouragement of FDI inflows. Basically, the adoption of the Structural Adjustment Programme in 1986 sparked off the journey towards the termination of FDI-hostile policies; given that the elements in the implementation of the Programme were creative steps geared towards encouraging FDI inflow. However, the inflow seemed unsustainable as the period 1990–1993 witnessed a characteristic drop in the rate of inflow which may be attributed to a political stalemate that disrupted productive activities, procured uncertainty and promoted capital flight. The repeal of the NEPAD and its replacement with the Nigerian Investment Promotion Commission (NIPC) restored life to the investment climate as the NIPC provided an opportunity for foreign investors to set up businesses in Nigeria with 100% ownership. This in conjunction with other investment-friendly policies served to promote FDI inflow especially and increasingly to the non-oil sector of the economy. Political factors such as the democratic transition of 1999 introduced some measures aimed at improving the efficiency and productivity of the economy. Notable among this was the privatization and commercialization of public enterprises which contributed greatly to the sustained inflow of FDI over from 1999 to date. A classic example is the deregulation of the telecommunications sector of the economy by granting operating licenses to Global System for Mobile communications operators which has increased FDI inflow in the telecommunication sector of the economy (Ayanwale 2007). The theoretical work of Findlay (1978) and Wang and Bloomstrom (1992) examined the importance of FDI as a conduit pipe for transferring technology. They warned that in the absence of linkages, foreign investments could have limited effect in spurring growth in an economy. Hirschman (1958:109) emphasized that not all sectors have the same potential to absorb foreign technology or to create linkages with the rest of the economy. He noted, for example, “Linkages are weak in agriculture and mining sectors. Markusen and Venables (1999) analyzed the effect of foreign firms on the development of domestic firms in the industrial sector. In their model, foreign companies compete with domestic producers while creating additional demand for domestically produced intermediate goods through linkages with local suppliers. De Gregorio (1992) by examining the experiences of 12 Latin American countries over the period 1950-85,
  • 5. 5 found that FDI provides three times the boost to economic growth as compared with aggregate investment. Blomstrom et al (1992) arrived at a similar conclusion using a larger sample of developing countries. They also found that FDI has a strong impact on the economic growth of developing countries. However, they also find that this effect is limited to higher-income developing countries. On the contrary, Carkovic and Levine (2002) used macro level data to find little support for the importance of FDI in stimulating growth. They argue that previous studies showing the benefit of FDI on economic growth has not fully taken into account the endogeneity problem. It has been observed that FDI which repose the inadequate domestic savings might be exogenous, showing that FDI might be absolutely exogenous implying that deficient domestic savings might not be FDI determining factor. The relationship between FDI and economic growth has become increasingly endogenous. Both Zhang (2002) and Zhang (1999) find evidence of a two-way Granger causality in the relationship between FDI and China’s economic growth. Similarly, Choe (2003) in a large sample of 80 countries finds evidence of two-way causality between FDI and economic growth. In addition, he also finds that the effects are more apparent from economic growth to FDI. Human capital can also play an important role in turning the FDI resources to economic growth, Borensztein et al (1998) shows that the country needs a certain level of human capital in order for the country to benefit fully from FDI. They performed cross-country regressions on a sample of 69 developing countries and found that FDI contributes more to growth than domestic investment. Balasubramanayam et al. (1996) found that FDI flows were associated with faster growth than in those developing countries that pursued inward oriented trade policies. Asiedu (2001) found a positive relationship between the return on capital and FDI, suggesting that higher GDP per capita implies a brighter prospect for FDI in the host economy. Aluko (1961), Brown (1962) and Obinna (1983) report positive linkages between FDI and economic growth in Nigeria. Endozien (1968) discusses the linkage effects of FDI on the Nigerian economy and submits that these have not been considerable and that the broad linkage effects were lower than the Chenery–Watanabe average (Chenery and Watanabe, 1958). Oseghale and Amonkhienan (1987) found that FDI is positively associated with GDP, concluding that greater inflow of FDI will spell a better economic performance for the country. Investment (both foreign and domestic) as a percentage of GDP and trade openness is expected to rise as countries pass through higher stages of development and experience faster growth rates. 2.1.1 Determinants of Foreign Direct Investment The role of foreign direct investment in growth acceleration and economic transformation has increased interest and drive towards the attraction of foreign exchange. FDI is an intervention that seeks to bridge the gap between domestic savings and investment; while encouraging diffusion of latest technology and management approaches from developed region, it thus plays a vital role in promoting rapid economic growth in developing countries. Determinants of FDI have been identified as size of the market, openness (Lim 2001). The study further identified infrastructure ability, political/economic stability and free trade zones as important avenues for FDI but had mixed results for fiscal incentives, the
  • 6. 6 business or investment climate, labour cost and openness. Edozien (1968) in an appraisal of the relationship between FDI and economic growth recognizes that it generates an inflow of capital technical knowhow and managerial capacity. In addition, Loius (1998) employing error correction specification identified both economic and political factors as the major determinants of FDI in Nigeria. Using panel data for 22 countries over 1984-2000, Asiedu (2005) found that the presence of natural resource and large markets promote foreign direct investment. The study found that lower inflation, good infrastructure, educated population, openness to FDI, less corruption, political stability and a reliable legal system promote FDI. Differentiating the types of FDI into resource seeking, market seeking and efficiency seeking FDI, Nunnenkamp and Spatz (2003) analysed the effect of an interplay of industry and host country characteristics has on the growth of FDI in developing countries. The strategic role of FDI in augmenting domestic investment intensified effort of democratic governments at attracting FDI. From the foregoing it is established that foreign direct investment produces economic benefits to the recipient countries by providing capital, foreign exchange, technology, competition and enhanced access to foreign markets. It also serves to promote domestic investment and innovation. Thus, we may identify the determinants of Foreign Direct Investment in Nigeria as follows, FDI = f ( FDIt-1 ,HUMAN CAPITAL, NR, IFA, OP, REXR ,GDP, POL) Where: NR = Presence of Natural Resources; IFA = Infrastructural Ability; OP = Openness; REXR = Real Exchange Rate; POL = Political Factors 2.2 Review of Foreign Aid and Economic Growth While FDI is a long-term capital transfer to finance investment, foreign aid is an official development assistance (ODA) which is monitored and administered by the Development Assistance Committee (DAC) consisting of grants or loans that one government or multilateral organization gives to a developing country to promote economic development and welfare. By concessionary terms, considering loans; it means 25% of ODA must be in the form of grants which includes exports credits and debt forgiveness etc. The aid resources of bilateral donors tend to follow the donor’s political and strategic priorities and not those countries that have the greatest need from a development perspective. In his works, Bauer (1991) argued that aid has serious, distorting consequences on the political life of recipient countries. Bauer, one of the critics of foreign aid, claimed that foreign aid has sustained governments in their pursuit of economically counterproductive political and economic policies; such policies include the persecution of particular groups, restriction on private trade and the inflow of private capital and enterprises, price policies that discourage agricultural production. Papers by Svensson (2000a, 2000b) and Collier and Dollar (2004), among others do not only explicitly address the economic growth problems but also explored the channels
  • 7. 7 through which foreign aid may deteriorate economic policy. The conjectures are such that foreign aid may partially substitute for sound economic policies, or that large aid payments induce wasteful rent-seeking activities. The ‘Fischer-Easterly model’ (Fischer, 1991, 1993; Easterly, 1993) provides a natural context within which the aid-growth relationship can be emphasized. Since 1980s, much aid from the multilateral lending agencies has been linked explicitly to macroeconomic policy reforms and structural adjustment programs (see Krueger 1997, Greenaway 1998, McGillivray and Morrissey 1998). The aid-growth literature has been dominated by cross-sectional studies using single- equation estimation techniques, producing mixed empirical results. Among early investigations for example, Papanek (1973) appeared to overturn the negative results of Griffin (1970) and Griffin and Enos (1970) by disaggregating capital flows into foreign aid, private capital and other inflows, reporting a positive and significant aid coefficient on economic growth. On the other hand, Voivodas (1973) obtained a negative impact of aid on growth (although not significant) for a sample of 22 LDCs for the period 1956- 1968. The ambiguity of these results may have, however, risen at least in part from the poor quality of the data for these early periods. For Sub-Saharan Africa, Levy (1988) reports a significant positive relationship in a regression model including aid (as a ratio of GDP) and income per capita, for 1968-82. Also, Hadjimichael et al. (1995) found positive evidence for the period 1986 to 1992 using a sample of 41 countries. Their model is more sophisticated than most predecessors by attempting to capture potential side effects of foreign aid (such as ‘Dutch-Disease’ effects) and other policy variables that are hypothesised to affect growth. Similarly, Burnside and Dollar (1997), using a model including a variety of policy variables, finds that though the ratio of aid to GDP often does not significantly affect growth in LDCs, aid interacted with policy variables does. Boone (1996) however has cast doubt on the growth effects of aid, arguing that, for a sample of LDCs, aid has had no impact on either investment or income growth. In another development, Knack (2000) shows that aid flows (relative to GDP and to government spending) are significantly correlated with a worsening of political risks for external investors, implying a deterioration in economic institutions. Djankov, Montalvo, and Reynal-Querol (2005) study changes in the quality of political rather than economic institutions. Their results revealed that on the average, countries with above average aid receipts relative to GDP promptly show a political deterioration. The effect of aid over the long run is substantial. While Rajan and Subramanian (2005) find that aid appears to slow the growth of labor intensive industries in developing countries, consistent with a “Dutch disease” effect caused by an appreciating exchange rate. World Bank (2000) on the other hand, finds that Africa’s exchange rates seem to be overvalued—an effect that may be due to a combination of aid flows and natural resource earnings. Mosley (1980), using a simultaneous equation model, found a weak, negative correlation between aid and growth, though he did find a positive, significant relationship for the ‘poorest’ countries in his sample. In this paper, we have concluded that political instabilities, some fundamental rigidities, misappropriation of public funds, amongst others, hinder growth of third world countries of which Nigeria forms a part: which is why foreign aid inflows has not been a determinant of growth. This has been widely supported by many writers. The figure below shows the ratio of AID to GDP from 1970 to 2007.
  • 8. 8 Figure 2: Aid as a ratio of GDP in Nigeria 0.0 0.4 0.8 1.2 1.6 1970 1975 1980 1985 1990 1995 2000 2005 AI DRGDP A working knowledge of the saying that, 'poverty anywhere being a threat to prosperity everywhere', has been the propelling force behind the commitment of developed countries and international organisations in providing development assistance to developing countries. However, a typical observation of the Official Development Assistance directed to Nigeria has been low over the years 1970-1987; a considerable rise occur consequent to adoption of the Structural Adjustment Programme (SAP) in 1986: this confirmed the relative importance of economic reform in the determination of aid. A sharp increase was recorded in the 2005 and 2006; a period when Nigeria was relieved of $18 billion debt out of a total debt of $30 billion. This debt was converted to foreign aid of which $9billion each was estimated for year 2005 and 2006 and in year 2005 alone, the foreign aid worth about 150% of the real GDP. International organisations and developed countries probably grew more confident in the ability of democratic government to manage aid funds to improve the economy and living standards of her people as against the mismanagement vanguard by the military warlords. Nigeria has received more than enough foreign development assistance, yet the economy remained stunted and sticky. Different reforms have been put in place but none have solved the problems of growth of the economy, the growth statistics have not affected the common man on the street. Knack (2000) argues that high level of aid erodes institutional quality, increases rent- seeking and corruption, thereby negatively affecting growth. Papanek (1973), in a cross- country regression analysis of 34 countries in the 1950s and 51 countries in the1960s, treating foreign aid, foreign investment, other flows and domestic savings as explanatory variables, finds that foreign aid has a substantially greater effect on growth than the other variables. He explains, “Aid, unlike domestic savings, can fill the foreign exchange gap as well as the savings gap”. Fayissa and El-Kaissy (1999), in a study of 77 countries over sub-periods 1971-1980, 1981-1990 and 1971-1990, show that foreign aid positively affects economic growth in developing countries. Using modern economic growth theories, they point out that foreign aid, domestic savings, human capital and export are
  • 9. 9 positively correlated with economic growth in the countries studied. This is consistent with the economic theory of foreign aid, which asserted that overseas development assistance accelerates economic growth by supplementing domestic capital formation (Chenery and Strout, 1966). Burnside and Dollar (1997), in their well-known paper “Aid, Policies, and Growth”, find that aid has a positive impact on growth in developing countries with good fiscal, monetary and trade policies but has little impact on countries where such policies are poor. To some, economic growth is elusive because different factors are responsible for growth in different economies of the world. 2.2.1 Determinants of Foreign Aid Given the high level of unemployment, poverty and poor economic performance of developing countries in general, foreign aid should represent an important source of foreign exchange for most countries of sub-Saharan Africa because it serves as a supplement of their low savings, export earnings and thin tax revenues. The concern for Africa can be seen in the commitment of the Economic Commission on Africa to raise over $50billioin annually to fuel Africa’s growth. Also, the shriveling state of the African economy with a hope for rejuvenation by aid influences the UN to increasingly advocate for rich countries to raise the ratio of foreign aid to 0.7% of GDP by 2015. Studies have shown that aid, other than fuel development, has made budget of most of the African countries being aid dependent. Thus, the paradox is observed that the more aid is been redirected to Africa, the more its living standards plummet. This is because aid tends to underwrite misguided policies and is an incentive for the corrupt and bloated institutions which characterize most African countries. Poor countries that are substantial aid recipients have been known with records of negative growth trends. Corruption tends to increase with foreign aid and is negatively related to trade. However, the systematic failure and inefficiency of aid (due largely to weak and unproductive institutions) is not only related to Africa but also to countries of Latin America. Total foreign inflows to a country could be in form of foreign aid, foreign borrowing and foreign investment. However, aid, as distinct from other forms does not cause an outflow of funds to pay back debt or repatriation of profits. Thus, the potential positive effect of foreign aid should however, be more plausible than the general effect of all foreign inflows. Though we need to know how beneficial or harmful aid is, much more we need to establish why different countries receive or attract aid in different amounts. Ali and Isse (2006) employed a panel approach to establish determinants of aid. The study specified and estimated a model explaining foreign aid allocation among 151 countries over the period 1975-1998. Trade, private credit, foreign direct investment, GDP per worker and government consumption were established as important determinants of foreign aid. From the analysis, factors appearing to decrease aid were years of schooling, private credit, trade and GDP per worker. While the factors appearing to increase foreign aid include taxes on international trade, ethnicity, government consumption. Following is a description of determinants of foreign aid (Economic Development Assistance) EDA = f (GDPW, TRADE, ETHNO, TOT, CREDIT, EDU, LAND AREA, GOV)
  • 10. 10 Taxes on trade, (TOT), capture the paradox that characterises the provision of foreign aid on one hand and protective trade policy on the other hand. There is interdependence between foreign aid and a country's tax policies. A rise in trade protection is usually associated with a rise in foreign aid provision. Nugent (1999). The countries that depend greatly on private capital (CREDIT) attract less aid; it fosters institutions and productive ventures and is likely to drive out overly managed government-to-government aid. Krueger (1993) Government spending (GOV) is the ratio of government consumption expenditure to GDP controlling for size and scope of government. Since aid goes to government and increased government spending amplifies aid, it tends to deter economic performance. The comparison between trade and aid sheds light on how competition and efficiency of each affect resource allocation. Another determinant of aid is GDP per worker (GDPW). Nugent and Krueger established that ethnic diversity (ETHNO) attracts aid for two crucial reasons; the more interest groups are seeking funding for their pet projects, governments may use foreign aid to obtain interest group supports, political undertones. 2.2.2 The International Organizations and Foreign Aid in Africa From the birth of international organizations, sub-Saharan Africa has been a region of particular interest in the realm of development. The region has been plagued by high economic volatility, extreme poverty, political instability and social unrest. According to the United Nations Industrial Development Organization (UNIDO), sub- Saharan Africa is the only world region where extreme poverty has grown for the past 20 years and is currently at a rate of nearly 50 percent (WB Intranet). While the greatest amount of aid per capita has gone to this region, it has seen the weakest reform (Devarajan et al. 2001). The International Monetary Fund and the World Bank have contributed the largest amount of aid to the region. These two lenders offer lower interest rates than private donors with the intent of aiding nations in financial crisis. Structural adjustment measures, however, are imposed to create greater assurance of debt repayment and stabilization of the development process. The lack of development despite increased foreign capital assistance as well as a heavy debt crisis between 1970 and 1985 resulted in strategic conditionality requirements for borrowing countries as stipulated by international lenders. From 1989-1999, the number of loans with attached structural adjustment requirements increased from 60 percent to 100 percent and the average number of conditions increased from three to 12 (Santiso 2001:11). This notion of conditionality is important for both borrowing countries and international lending organizations because donors develop a vested interest in successful reform and stabilization of finances. Conditionality and surveillance make them active participants in internal policy reform. The expansion of conditionality during the 1990s is notable especially for the IMF in that where it had previously focused on macroeconomic reform; it began to target microeconomic policies (Eldar 2005:511). The most prevalent reform measures include trade reform, price liberalisation and privatisation, promotion of central bank independence, strengthening of financial sector regulations, devaluation of currency, and decentralisation of agencies and national enterprises (IMF 2005). In addition, many of the changes in the 1990s are a reflection of increased attention to internal social and political factors in borrowing nations, including a good governance emphasis. The World Bank, for example, has significantly expanded its commitment to government related programs. Between 1996 and 2005, more than 600 programs and
  • 11. 11 initiatives have been created with focus on public sector reform (Santiso 2001:3). The area of sub-Saharan Africa also falls under the category of low-income which makes its countries eligible for the Poverty Reduction and Growth Facility (PRGF) loans. This program is designed for low-income countries because it offers low-interest loans supported by programs with poverty reduction strategies (IMF 10.2007). The World Bank also offers interest-free lending for the poorest countries through its International Development Agency (IDA) (WB Group 2008). Despite these programs, however, sub- Saharan Africa has seen little progress, thereby underscoring the need for a new approach to developmental assistance. 2.3 Review of the Two-Gap Model and the Theoretical Framework When external finance either grants or loans supplement domestic resources, then we have “the Two-Gap model” the major assumption of this model is that most developing countries either face a shortage of domestic savings to augment for investment opportunities or they (developing countries) are faced with foreign exchange constraints to finance the needed capital and intermediate goods. In their book, Economic Development Todaro and Smith (2004) claimed that most Two-Gap models assume that the savings gap and the foreign-exchange gap are unequal in magnitude and independent in nature. The implication of this is that one of the Two-Gaps would be “binding” or “dominant” for any less developed country at any point in time. McKinnon (1964), Chenery and Strout (1966), Findlay (1973), and others applied the Harrod- Domar growth model to show that foreign capital can raise the growth rate by raising the availability of capital for production, where the capital-output ratio is held constant. The two-gap approach introduces the assumption that an imported commodity not produced domestically is essential for the production of investment goods. On one hand, if the availability of foreign exchange (if trade gap exist) to purchase these imported capital goods constrains or expands (when the economy has human resources and technology of its own) the growth of the economy, the growth would be exogenous of foreign exchange, since it does not depends on foreign investment goods and technology. On the other hand, foreign capital can be introduced in the form of official flows, or FDI (provided saving gap exist). If the availability of foreign capital to compensate for the lack of domestic savings constrains or expands the growth of the economy, we may call the growth endogenous of FDI, since the economy does not have technology and human resources of its own. The Two-Gap Model Essentially, the two gap model is based on the gap between a country's own provision of resources and its absorptive capacity. These two gaps are known as the Savings Gap and the Foreign Exchange Gap. Whichever of the two gaps is binding (or is the greatest) will constrain the amount of investment and capital formation, which can be undertaken. (1) The Savings Gap Where savings fall short of what can be effectively and productively invested. (2) The Foreign Exchange Gap Where earnings of foreign exchange fall short of the amounts needed to purchase the necessary foreign materials, components, etc.
  • 12. 12 Derivation of the Two-Gap Model We start with the basic Macroeconomic Identity where Aggregate Output = Aggregate Expenditure. Thus, assuming that there is no government sector Y = C + I + (X - M) where: Y = GNP Where Y= GNP; C= Consumption; I= Investment (or Domestic Capital formation) X = Exports; M = Imports M = Imports Subtracting C from both sides we get: Since Y – C = S Where: S = Savings (domestic) Then, This relationship can be restated as follows = These two constitute two separate constraints. Eliminating one does not get rid of the other. Note: The analysis rests on the premise that domestic investment can be financed by domestic saving as well as through inflows of capital. If we let (M – X) = F, then we can represent the above as follows F = I – S or as in the text I = F + S Possible Scenarios Using the relationship posited above, the following scenarios may arise: S may be too small to permit the amount of I that the country would otherwise have the capability to undertake. Therefore, a SAVINGS GAP would exist. X may be too small to permit the M required to make full use of the resources of the economy. Therefore a FOREIGN EXCHANGE (or TRADE) GAP would exist. Now, (Sources of Resources used in the economy = Uses of Resources in the Economy: expenditure Targets Y + M = C + I + X Y – C + M = I + X M – X = I – S (Foreign Exchange Gap) (Savings Gap) S + M = I + X (Withdrawals) (Injections)
  • 13. 13 Additional Discussion While the two gaps are distinct and separate ones, international transfers can, in fact, be used to fill both. For example, a machine given to a country represents both an import for which no resources need to be exported (thus alleviating the foreign exchange gap) and an investment good which does not have to be offset by domestic saving (thus alleviating the savings gap). We should also note that the notion of two gaps is not consistent with neo-classical economic theory. Neo-classical economics assumes that resources can be easily shifted between different employments. Thus, whenever idle resources (excess capacity) exist, these idle resources can be used to produce exports, and exports can be increased by simply altering the exchange rate - i.e., by devaluing. Conversely, idle resources can be used to produce capital goods, intermediate inputs and the like, so that foreign exchange constraints can be eliminated. Concerning the latter, excess labour can, for example, be put to work to create labour intensive capital goods. Proponents of the two-gap model contend that imperfections and rigidities exist which preclude the economy from working according to the neo-classical edicts. For example, many governments may not think it desirable to do what neo-classical economics suggests they ought to do. As well, actions which may be theoretically proper may simply not be effective since they are implemented in an environment totally different from that perceived by neo-classical economics. Assessment of the Two Gaps In some of the work done on the two-gap model, it is suggested not only that they exist but that, most often; the trade gap exceeds the savings gap. This suggests that the trade gap is more powerful - i.e. is the binding constraint. An early UNCTAD study suggests that the two gaps are about equal. 3. Methodology and Data In the Harrod-Domar model, where production technology and the capital-labor ratio are fixed, capital accumulation is essential for growth. In the neoclassical Solow-Swan model, on the other hand, the capital-labor ratio changes to accommodate technology innovation, which is the source of growth. Barro (1990) and others, who advocate the endogenous growth theory, assert that the government policies, such as open trade and education, could stipulate the country’s long-term growth rate. In the course of this paper, we shall refer to the impact of time series data on the model used, in response to the influence of time series data, we shall conduct unit root tests using augmented Dickey-Fuller (ADF) and Philip Perron (PP) and the empirical examination of vector autoregressive analysis would be made to explain the Two-Gap model. 3.1 Time Series Data Analysis Empirical analysis using time-series data requires that each variable xt is stationary, meaning that: 1) its mean E(xt) and variance V(xt) are constant over time t, and 2) the value of covariance Cov(xt, xt-k) between two time periods t and t-k depends only on the
  • 14. 14 lag k and not on the actual time t at which the covariance is computed. The problem of spurious regression is likely to arise, when two time-series exhibit both strong upward or downward trends. In this case the high R2 could be due to the presence of the trend, not due to any meaningful relationship between the two. It is known that if a time-series model includes one non-stationary variable, then the regression could be spurious, even though it exhibits a high R2 and significant t-values, Yamachita and Khachi (2003). In the course of this paper, time series secondary data obtained from the Central Bank of Nigeria (CBN) statistical bulletin, International Financial Statistics, African Development Bank volume on selected statistics, National Bureau of Statistics and other conference papers. 3.2 Unit Root Test Let us denote the stochastic error term by ut, which has zero mean, constant variance, and is not autocorrelated. Such an error term is called white noise. If Δxt = xt - xt-1 is stationary, where Δis the first-difference operator, the original series xt is called integrated of order 1, and denoted by I(1). In general, if a time series has to be differenced r times before it becomes stationary, it is integrated of order r, or I(r). Consider the autoregressive model xt = r xt-1+ ut, where ut is white noise. If r =1, then xt is a non-stationary time-series known as a random walk, and we say that xt has a unit root. The model can be modified as Δ xt = ( r - 1) xt-1+ ut = a xt-1+ ut, where a = r - 1. The unit root is tested for xt under the null hypothesis that a = 0. More generally, the unit root is tested for xt under the null hypothesis that a = 0 in the time series model Δxt =a xt-1+ b t +g + ut, where t is a time trend, and g is a drift parameter (intercept). If the error term ut is autocorrelated, then the model is modified to include more lags:               m i t t t t t t i .(3.1) u .. .......... .......... .......... .......... .......... 1 1    The number of lagged difference terms to include m is determined empirically by Akaike information criterion (AIC), or Schwarz criterion (SC). The unit root test for xt under the null hypothesis a = 0 applied to the model (1) is called Augmented Dickey-Fuller (ADF) test. However, we shall consider ADF unit root and Phillips-Perron (PP) test appropriate for this research work. The finding that many macro time series may contain a unit root has spurred the development of the theory of non-stationary time series analysis. Engle and Granger (1987) pointed out that a linear combination of two or more non-stationary series may be stationary. 3.3 Vector Autoregressive Analysis (VAR)Model Consider a VAR of order P: 1 1 1 ... ..............................................................3.2 t t y t t t y A Apy Bx e       
  • 15. 15 Where: yt is a k-vector of non-stationary I(1) variables, xt is a d vector of deterministic variables, and et is a vector of innovations. We can rewrite the VAR as: 1 1 1 ........................................................3.3 p i t i t t t t i T Dy Bx e Dy Hy          Since VAR models do not distinguish the dependent variables from the independent variables, the notation of Yt and Xt is conventional. Under the assumption that et is neither autocorrelated nor correlated with any of the right-hand side variables, we can appropriately estimate the coefficients by OLS. The number of lags m is again determined by Akaike information criterion (AIC), or Schwarz criterion (SC). a) Impulse Response Analyses An impulse response function is created by converting the VAR model (1) to the vector moving average model of infinite order VMA (∞). It traces the effects of one standard deviation shock to one of the impulses ut on current and future values of the endogenous variables Yt in the converted form. The impulses are usually correlated, so that they have a common component which cannot be associated with a specific variable. A common method of dealing with this issue is to attribute all of the effects of any common component to one variable that comes first in the VMA(∞) model. More technically, the error terms are orthogonalized by Cholesky decomposition, so that the covariance matrix of the resulting impulses is diagonal. While this method is widely used, it is rather arbitrary, and changing the Cholesky ordering of the variables could dramatically change the impulse responses. b) Variance Decompositions Variance decomposition provides a different method of depicting the system dynamics. It decomposes variation in a targeted endogenous variable Yt into the component shocks to all endogenous variables in the VMA(∞) model, and provides information about the relative importance of each random impulse ut to the targeted variable. 4. Estimation 4.1 Data Description and Unit Root Test Data are prescribed from established theoretical framework of two-gap model. Annual time series data (from 1970-2007) that include real GDP, domestic investment, foreign direct investment (FDI), export, import and aid are all consider germane to this research work. The log form of these variables are represented as LRGDP, LDINV, LFDI, LEXP, LIMP and LAID respectively and on these log form will unit root test be conducted. The result of both augmented Dickey-Fuller (ADF) and Philip Perron (PP) unit root test are shown in Appendix 1. We reject the null hypothesis of unit root at first difference for all variables except PP unit root test of LFDI. By implication, all variables except LFDI—PP are stationary at critical values -4.23, -3.54 and -3.2 at 1% , 5% and 10%
  • 16. 16 respectively, though LDINV-ADF is stationary at I(2) thus, we classify it a non stationary variable. 4.2 Vector Autoregression Analysis The crux of this research is the vector autoregression analysis which represents the impulse response and variance decomposition of the variables. In the context of this research work, the shock of the economic growth will be examined through the innovation of the error term and a recursive VAR was found suitable for this purpose. Evidently, the result of the recursive VAR depends on the order of the variables: changing the order changes the VAR equations, coefficients, and residuals, and there are n! recursive VARs, representing all possible orderings. The cholesky orderings is as follows KLRGDP KLFDI KLAID KLDINV KLEX KLIMP making real GDP the most important variable among the variables. Both impulse response and variance decomposition are observed through the stationary status of the variables. 4.2.1 Impulse Response Appendix 2 gives the result of the impulse response of the VAR method: in this regard, since, we are more interested in the factor(s) that influence real GDP therefore; we shall consider the real GDP shock through the other variables. The response of KLRGDP to one standard deviation innovation or impulse of KLFDI is volatile as the result indicates both positive and negative response. The volatility nature of KLFDI over the ten year period is relaxed in year nine and ten. The response of KLRGDP to one standard deviation innovation of KLAID is flat, negative and zero. Whereas: the response of KLRGDP to one impulse of KLDINV is consistently positive. Unfortunately, the response of KLRGDP to one standard shock of KLEX and KLIMP revealed negative impact for many years. However, the response of KLAID to one impulse of KLRGDP is positive for many periods. 4.2.2 Variance Decomposition Variance decomposition results of the VAR approach is explicitly displayed in Appendix 3. At this point, we shall determine vividly factors that influenced real GDP in Nigeria for ten period horizon. 50% of the variation in real GDP is determined by its lagged values starting from horizon one to six. And down the horizon, KLFDI, KLDINV and KLIMP explain at least 10% of the variation in real GDP while KLAID and KLEX have a very low impact on real GDP. More interestingly, KLAID is determined by KLRGDP; this is because more than 20% of the variation in KLAID is consistently explained by KLRGDP. Moreover, over 28% of the variation in KLEX is consistently explained by KLDINV while over 45% of the factors affecting KLIMP can be traced to KLDINV. No doubt, these results did not only indicate the dominant factors affecting the growth in real GDP in Nigeria but also revealed the necessity and importance of general equilibrium theory of the economy.
  • 17. 17 Conclusion. We conduct various tests using the VAR model analysis to identify the factors that promote or restrain economic growth based on the two-gap model. The results of the unit root test confirm that all the variables are absolutely nonstationary except for (LFDI) which is stationary at levels using Phillip Peron test. From the VAR analysis, Foreign aid does not give clear evidence of an imperative growth factor in Nigeria while FDI does but volatile. This confirmed the transfer paradox –a condition under which foreign aid immiserates the recipient country. The implication of this is that once a country attains high economic growth, it could resolve the gap by itself and tread a sustainable growth path. This could be achieved through first, increase in exporting commodities, secondly diversification of the economy from oil-which has remained a Dutch disease to the Nigerian economy. Third, import substitution items should be encouraged among the local producers and lastly, trade liberalization should be the key policy thrust to complement foreign aid if aid is needed at all. Either aid conditionality or non-conditionality, the analysis confirmed that aid can distort the welfare of Nigerian citizens. Moreover, there is no theoretical or empirical justification (by this research) for the assumption that filling a “trade gap” determined by “aid requirements” will boost trade and growth in the Nigerian economy. From the variance decomposition of VAR, foreign direct investment is determined by its past levels while aid is determined by real GDP. The policy implication of endogeneity of aid on real GDP re-emphasizes the imperative of economic reforms as a condition for aid. Aid tying may alter the allocation of resources from an efficient position to an inefficient position of the recipient countries; In this case, aid will deteriorate and immiserate the living well being of the citizen. The fact is that the donor may advise Nigeria to increase her imports by the amount of aid provided and as such, an appropriate import policy to match this requirement may remains sacrosanct to Africa’s developmental problem. Moreover, if the government marginal propensity to spend associated with tying is higher and more than the private agents, then deterioration of the terms of trade may be powerful enough to induce the transfer paradox. There are two interesting notable results from the variance decomposition result; first about 60% of the variation in import has been consistently explained by foreign direct investment and domestic investment. Hence, investment resources have been channeled to importation which in turn deteriorates Nigeria terms of trade. Secondly, more than 28% of the variation in exportation is constantly determined by domestic investment. This is robust enough to indicate the economic justification of domestic investment designing a development trajectory through a refine economic policy that will enhance domestic investment. Thus, relying solely on FDI in closing the savings gap can cause more harm than good to Nigerian economy. The two-gap model of Chenery and Strout (1966) showed that developing countries are constrained with little domestic savings and foreign exchange earnings. The model predicted that foreign aid and foreign direct investment are an optimal means to break the poverty circle and solve the two gaps simultaneously. Except the fundamental rigidities which includes, among other things, inappropriate economic policies, corruption, mismanagement of resources and overreliance on oil resources, the vicious circle of poverty in Nigeria economy cannot be broken by attracting foreign aid and foreign direct investment alone.
  • 18. 18 References Aluko, S.A. (1961). “Financing Economic Development in Nigeria”. The Nigerian Journal of Economic and Social Studies, 3(1): 39–67. Asiedu, E. (2001). “On the Determinants of Foreign Direct Investment to Developing Countries: Is Africa Different?” World Development, 30(1): 107–19. Balasubramanyan, V., N. Mohammed, A. Salisu and David Sapsford. (1996). “Foreign Direct Investment and Growth in EP and IS Countries”, Economic Journal, 106: 92–105. Barro, R.J. (1990), “Economic Growth in a Cross Section of Countries”, Quarterly Journal of Economics, 106(2), 407-433 Basu, Anupam, and Krishna Srinivasan, (2002), “Foreign Direct Investment in Africa— Some Case Studies,” IMF Working Paper No. 02/61 (Washington, International Monetary Fund). Bauer, P. T. (1991). The Development Frontier: Essays in Applied Economics. Cambridge, MA: Harvard University Press. Blomström, M., Lipsey, R. and Zejan, M. (1992), “What Explains Developing Country Growth?” NBER Working Paper, n. 4132. Cambridge, Mass. Boone, P. (1996), “Politics and the Effectiveness of Foreign Aid”, European Economic Review, Vol. 40, pp. 289-328. Borensztein, E., J. De Gregoria and J. Lee. (1998). “How Does Foreign Investment Affect Economic Growth?” Journal of International Economics, 45(1): 115–35. Burnside and Dollar (1997) Aid, Policies, and Growth. Policy Research Working Paper No. 1777, Washington, World Bank. Brown, C.V. (1962). “External Economies and Economic Development”. The Nigerian Journal of Economic and Social Studies, 4(1): 16–22. Carkovic, M. and R. Levine. (2002). “Does Foreign Direct Investment Accelerate Economic Growth?” University of Minnesota, Working Paper. Chenery, H. B. and A. Stout (1966). “Foreign Assistance and Economic Development”. American Economic Review Vol. 55 pp.679-733. Chenery, H. B. and T. Watanabe. (1958). “International Comparisons of the Structure of Production”. Econometrica XXVI 487-521.
  • 19. 19 Choe, J.I. (2003). Do Foreign Direct Investment and Gross Domestic Investment Promote Economic Growth? Review of Development Economics, 7(1), 44-57 Collier, Paul, and David Dollar. (2002). “Aid Allocation and Poverty Reduction.” European Economic Review 46(8): 1475-1500. ————. 2004. “Development Effectiveness.” Economic Journal 114(496): F244-F271. De Gregorio, J. (1992),“Economic Growth in Latin America”. Journal of Development Economics 39, pp. 59-83. Devarajan Shantayanan, Collier, Paul and David Dollar. (2001). "Measuring IDA's Effectiveness." Processed. World Bank, Washington, D.C. Djankov, Simeon, Jose G. Montalvo, and Marta Reynal- Querol. (2005). “The Curse of Aid.” World Bank, Washington, D.C. Domar, Evsey. (1946), “Capital Expansion, Rate of Growth, and Employment”, Econometrica, Vol. 14, pp. 137-47. Easterly, William and Sergio Rebelo. (1993). “Fiscal Policy and Economic Growth: An Empirical Investigation.” NBER Working Paper No. 4499. Eldar, O. (2005). “Reform of IMF Conditionality: A Proposal for Self Imposed Conditionality”. Journal of International Economic Law 8, 2: 511. Endozien, E.G. (1968). “Linkages, Direct Foreign Investment and Nigeria’s Economic Development”. The Nigerian Journal of Economic and Social Studies, 10(2): 119–203. Fayissa, Bichaka and El-Kaissy, Mohamed I. (1999). “Foreign Aid and Economic Growth of Developing Countries (LDCs): Further Evidence.” Studies in Comparative International Development Findlay, R. (1978). “Relative Backwardness, Direct Foreign Investment and the Transfer of Technology: A Simple Dynamic Model”. Quarterly Journal of Economics, 92: 1–16. Fischer, Stanley. (1991). “Growth, Macroeconomics and Development.” NBER Working Paper No. 3702. ————. (1993). “The Role of Macroeconomic Factors in Growth.” Journal of Monetary Economics 32(3): 485-512 Gorg, H. and D. Greenaway (2002). “Much Ado About Nothing? Do Domestic Firms Really Benefit from Foreign Direct Investment?” Research Paper 2001/37, Globalisation and Labour Markets Programme, at Leverhulme Centre for Research on Globalisation and Economic Policy, Nottingham.
  • 20. 20 Greenaway, D. (1998), “Does Trade Policy Reform Improve Economic Performance?” Scottish Journal of Political Economy, Vol. 45, forthcoming. Griffin, K. (1970). “Foreign Capital, Domestic Savings and Economic Development”. Bulletin of the Oxford University Institute of Economics and Statistics, 32 (2): 99-112. Griffin, K. and J. L. Enos (1970). “Foreign Capital, Domestic Savings and Economic Development,” Oxford Bulletin of Economics and Statistics, vol. 32, pp. 99-112. Gujarati, D.N. (1995), Basic Econometrics, McGraw-Hill, 3rd edition Development,” Oxford Bulletin of Economics and Statistics, vol. 32, pp. 99-112. Hadjimichael, M.T et al. (1995), Sub-Saharan Africa Growth, Savings, and Investment, 1986-1993, International Monetary Fund Occasional Paper No. 118, Washington D.C. Hanson, G.H. (2001). “Should Countries Promote Foreign Direct Investment?” G-24 Discussion Paper No. 9. UNCTAD Geneva. Harrod, R., (1939). “An Essay in Dynamic Theory”, Economic Journal 49, pp.14-33. Hirschman, A. (1958). The Strategy of Economic Development. New Haven: Yale University Press. Knack, S., (2000). Does Foreign Aid Promote Democracy. World Bank, Washington, DC. Krueger, A.E. (1997), “Trade Policy and Economic Development: How We Learn”, American Economic Review, Vol. 87, pp. 1-22. Levy, V. (1988), “Aid and Growth in Sub-Saharan Africa: The Recent Experience”, European Economic Review, Vol. 32, pp. 1777-1795. Markusen, J. and K. Maskus. (1999). “Discrimination among Alternative Theories of FDI.” NBER Working Paper 7164. McGillivray, M. and Morrissey, W.O. (eds) (1998), Liberalisation and Adjustment (London, Macmillan), forthcoming. McKinnon, R.E. (1964), “Foreign Exchange Constraints in Economic Development and Efficient Aid Allocation”, Economic Journal, 74, 388-409 Mosley, P. (1980), “Aid, Savings and Growth Revisited”, Bulletin of the Oxford University Institute of Economics and Statistics, Vol. 42, pp. 79-85. Obinna, O.E. (1983). “Diversification of Nigeria’s External Finances through Strategic Foreign Direct Investment”. Nigerian Economic Society Annual Conference Proceedings, Jos, 13-16th May.
  • 21. 21 Oseghale, B.D. and E.E. Amonkhienan. (1987). “Foreign Debt, Oil Export, Direct Foreign Investment (1960-1984)”. The Nigerian Journal of Economic and Social Studies, 29(3): 359–80. Papanek, G. F. (1973). “Aid, Foreign Private Investment, Savings and Growth in Less Developed Countries”. Journal of Political Economy, 81 (1): 120-30. Rajan, Raghuram, and Arvind Subramanian. (2005). “What Might Prevent Aid from Enhancing Growth?” International Monetary Fund, Washington, D.C. Svensson, J. (2000a) “Foreign Aid and Rent Seeking”, Journal of International Economics 51 (2): 437-61. Santiso, Carlos. (2000). “Towards Democratic Governance: The Contribution of the Multilateral Development Banks in Latin America”, in Peter Burnell, ed., Democracy Assistance: International Cooperation for Democratization (London: Frank Cass Publishers), 150-190. ___________. 2001. “International Co-operation for Democracy and Good Governance: Moving Toward a Second Generation?” European Journal of Development Research 13(1):154-180. Stiglitz, Joseph. (1999). “The World Bank at the Millennium,” The Economic Journal 109 (November), F577-597. Svensson, J. (2000b) “When is Foreign Aid Policy Credible? Aid Dependence and Conditionality”, Journal of Development Economics 61 (1): 61-84. Voivodas, C.S. (1973). “Exports, Foreign Capital Inflow and Economic Growth”. Journal of International Economics, 3 (4): 337-49. Wang, J.Y. and M. Blomstrom. (1992). “Foreign Investment and Technology Transfer: A Simple Model.” European Economic Review 36: 137-155. Zhang, Kevin Hongli (1999). “Hod does FDI interact with economic growth in a large developing country? The case of China”. Economic Systems, 21(4): 291-304. Zhang, K. (2001) “Does Foreign Direct Investment promote growth? Evidence from East Asia and Latin America”, Contemporary Economic Policy 19, 2, 175-85. World Bank “Extreme Poverty Spreading in Sub-Saharan Africa”. The Internet <http://go.worldbank.org/7U5V8V9TU0> World Bank. (1996). World Debt Tables: External Finance for Developing Countries, Vol. 1 (Analysis and Summary Tables). Washington, D.C.: The World Bank.
  • 22. 22 World Bank. 2000. Can Africa Claim the 21st Century? New York: Oxford University Press. APPENDIX 1: UNIT ROOT TESTS Augmented Dickey Fuller (ADF) Phillip Perron (PP) Variable Level 1st Difference Order of Integration Level 1st Difference Order of Integration LRGDP -0.5837 *(0.9740) -4.2573 (0.0097) I(1) -0.6151 (0.9721) -5.787 (0.0002) I(1) LEXP -2.851 (0.1896) -3.966 (0.0194) I(1) -2.9475 (0.1602) -6.0502 (0.0001) I (1) LIMP -2.62 (0.2751) -3.874 (0.0240) I(1) -2.4776 (0.3367) -5.0721 (0.0011) I(1) LAID -2.67 (0.255) -4.83 (0.002) I(1) -2.1625 (0.4955) -4.7354 (0.0028) I(1) LFDI -2.218 (0.4658) -6.5427 (0.6000) I(1) -4.0106 (0.0170) -13.1793 (0.000) I(0) LDINV -1.9370 (0.6147) -2.9203 (0.1687) I(2) -1.7686 (0.6995) -4.2547 (0.0095) I(1) Critical Values: 1% - 4.23 5% - 3.54 10%- 3.20 () are the P-values
  • 24. 24 -.05 .00 .05 .10 .15 1 2 3 4 5 6 7 8 9 10 Response of KLRGDP to KLRGDP -.05 .00 .05 .10 .15 1 2 3 4 5 6 7 8 9 10 Response of KLRGDP to KLFDI -.05 .00 .05 .10 .15 1 2 3 4 5 6 7 8 9 10 Response of KLRGDP to KLAID -.05 .00 .05 .10 .15 1 2 3 4 5 6 7 8 9 10 Response of KLRGDP to KLDINV -.05 .00 .05 .10 .15 1 2 3 4 5 6 7 8 9 10 Response of KLRGDP to KLEX -.05 .00 .05 .10 .15 1 2 3 4 5 6 7 8 9 10 Response of KLRGDP to KLIMP -.8 -.4 .0 .4 .8 1 2 3 4 5 6 7 8 9 10 Response of KLFDI to KLRGDP -.8 -.4 .0 .4 .8 1 2 3 4 5 6 7 8 9 10 Response of KLFDI to KLFDI -.8 -.4 .0 .4 .8 1 2 3 4 5 6 7 8 9 10 Response of KLFDI to KLAID -.8 -.4 .0 .4 .8 1 2 3 4 5 6 7 8 9 10 Response of KLFDI to KLDINV -.8 -.4 .0 .4 .8 1 2 3 4 5 6 7 8 9 10 Response of KLFDI to KLEX -.8 -.4 .0 .4 .8 1 2 3 4 5 6 7 8 9 10 Response of KLFDI to KLIMP -.2 -.1 .0 .1 .2 .3 .4 .5 .6 1 2 3 4 5 6 7 8 9 10 Response of KLAID to KLRGDP -.2 -.1 .0 .1 .2 .3 .4 .5 .6 1 2 3 4 5 6 7 8 9 10 Response of KLAID to KLFDI -.2 -.1 .0 .1 .2 .3 .4 .5 .6 1 2 3 4 5 6 7 8 9 10 Response of KLAID to KLAID -.2 -.1 .0 .1 .2 .3 .4 .5 .6 1 2 3 4 5 6 7 8 9 10 Response of KLAID to KLDINV -.2 -.1 .0 .1 .2 .3 .4 .5 .6 1 2 3 4 5 6 7 8 9 10 Responseof KLAIDtoKLEX -.2 -.1 .0 .1 .2 .3 .4 .5 .6 1 2 3 4 5 6 7 8 9 10 Response of KLAID to KLIMP -.2 -.1 .0 .1 .2 .3 .4 1 2 3 4 5 6 7 8 9 10 Response of KLDINV to KLRGDP -.2 -.1 .0 .1 .2 .3 .4 1 2 3 4 5 6 7 8 9 10 Response of KLDINV to KLFDI -.2 -.1 .0 .1 .2 .3 .4 1 2 3 4 5 6 7 8 9 10 Response of KLDINV to KLAID -.2 -.1 .0 .1 .2 .3 .4 1 2 3 4 5 6 7 8 9 10 Response of KLDINV to KLDINV -.2 -.1 .0 .1 .2 .3 .4 1 2 3 4 5 6 7 8 9 10 Responseof KLDINV toKLEX -.2 -.1 .0 .1 .2 .3 .4 1 2 3 4 5 6 7 8 9 10 Response of KLDINV to KLIMP -.2 -.1 .0 .1 .2 .3 .4 1 2 3 4 5 6 7 8 9 10 Response of KLEX to KLRGDP -.2 -.1 .0 .1 .2 .3 .4 1 2 3 4 5 6 7 8 9 10 Response of KLEX to KLFDI -.2 -.1 .0 .1 .2 .3 .4 1 2 3 4 5 6 7 8 9 10 Response of KLEX toKLAID -.2 -.1 .0 .1 .2 .3 .4 1 2 3 4 5 6 7 8 9 10 Responseof KLEX to KLDINV -.2 -.1 .0 .1 .2 .3 .4 1 2 3 4 5 6 7 8 9 10 Responseof KLEX toKLEX -.2 -.1 .0 .1 .2 .3 .4 1 2 3 4 5 6 7 8 9 10 Response of KLEX toKLIMP -.2 -.1 .0 .1 .2 .3 1 2 3 4 5 6 7 8 9 10 Response of KLIMP to KLRGDP -.2 -.1 .0 .1 .2 .3 1 2 3 4 5 6 7 8 9 10 Response of KLIMP to KLFDI -.2 -.1 .0 .1 .2 .3 1 2 3 4 5 6 7 8 9 10 Response of KLIMP to KLAID -.2 -.1 .0 .1 .2 .3 1 2 3 4 5 6 7 8 9 10 Response of KLIMP to KLDINV -.2 -.1 .0 .1 .2 .3 1 2 3 4 5 6 7 8 9 10 Response of KLIMP to KLEX -.2 -.1 .0 .1 .2 .3 1 2 3 4 5 6 7 8 9 10 Response of KLIMP to KLIMP ResponsetoCholesky OneS.D. Innovations APPENDIX 3: VARIANCE DECOMPOSITION Variance Decomposition
  • 25. 25 of KLRGDP: Period S.E. KLRGDP KLFDI KLAID KLDINV KLEX KLIMP 1 0.123798 100.0000 0.000000 0.000000 0.000000 0.000000 0.000000 2 0.154767 65.76889 8.437530 8.394068 7.951837 8.013316 1.434354 3 0.169900 54.70480 9.663150 7.122894 12.01037 7.320184 9.178597 4 0.174252 52.01832 11.25674 6.774977 11.58932 7.012901 11.34774 5 0.184054 51.59011 13.70808 6.272471 10.39486 7.621239 10.41323 6 0.185859 50.60722 14.34517 6.356272 10.69483 7.608001 10.38851 7 0.190519 48.50369 14.39567 6.094540 12.28790 7.551852 11.16635 8 0.192010 47.82272 14.97355 6.248031 12.24025 7.684088 11.03136 9 0.192624 47.75430 14.95117 6.211043 12.24017 7.877443 10.96587 10 0.193044 47.55079 14.88652 6.197314 12.36713 8.078873 10.91936 Variance Decomposition of KLFDI: Period S.E. KLRGDP KLFDI KLAID KLDINV KLEX KLIMP 1 0.740623 1.862669 98.13733 0.000000 0.000000 0.000000 0.000000 2 1.073082 1.819130 92.94011 0.431305 3.732261 1.066408 0.010789 3 1.181349 5.973889 87.72340 0.895938 4.232394 0.933037 0.241343 4 1.229572 5.864214 82.32918 3.358659 4.464488 3.620799 0.362660 5 1.278164 6.372320 76.38298 3.494073 6.586062 6.472452 0.692112 6 1.303195 6.944384 75.26702 3.532195 6.811668 6.727778 0.716953 7 1.320870 6.963542 75.01657 3.556731 6.819805 6.588578 1.054779 8 1.328086 7.014028 74.88016 3.520794 6.764158 6.554648 1.266210 9 1.329049 7.019998 74.79121 3.562936 6.765637 6.589367 1.270852 10 1.333349 6.977578 74.63190 3.560927 6.853429 6.642822 1.333340 Variance Decomposition of KLAID: Period S.E. KLRGDP KLFDI KLAID KLDINV KLEX KLIMP 1 0.597454 22.91558 1.221771 75.86265 0.000000 0.000000 0.000000 2 0.620065 21.57543 1.171983 71.32712 0.026677 0.270875 5.627909 3 0.630620 22.88262 1.715176 68.98936 0.703197 0.263567 5.446085 4 0.642386 23.84216 1.652921 66.48559 1.176643 1.509897 5.332788 5 0.650401 23.26748 2.088046 64.86107 2.426237 1.845343 5.511824 6 0.653767 23.24746 2.078224 64.20376 2.515282 1.844644 6.110630 7 0.655418 23.51617 2.102919 63.93372 2.503889 1.863389 6.079914 8 0.657358 23.47424 2.090708 63.55713 2.693975 2.139840 6.044109 9 0.658506 23.39338 2.149365 63.33591 2.840421 2.146238 6.134683 10 0.659074 23.46026 2.148080 63.22837 2.844137 2.143608 6.175539 Variance Decomposition
  • 26. 26 of KLDINV: Period S.E. KLRGDP KLFDI KLAID KLDINV KLEX KLIMP 1 0.380951 5.201617 7.435944 0.165153 87.19729 0.000000 0.000000 2 0.467856 5.037329 13.28741 0.186418 75.16507 4.002808 2.320969 3 0.493946 8.348750 12.93663 0.527585 71.66756 3.591229 2.928241 4 0.500376 8.166133 13.76463 1.617058 69.92908 3.558631 2.964460 5 0.515652 7.699576 14.55753 1.791411 68.10465 4.418139 3.428699 6 0.517731 7.693714 15.08331 1.780115 67.55868 4.463366 3.420816 7 0.519094 7.968375 15.09438 1.836357 67.21150 4.486486 3.402906 8 0.520926 7.995779 15.01115 1.826053 67.03685 4.747592 3.382574 9 0.521489 8.015348 15.05349 1.834015 66.91229 4.751038 3.433820 10 0.522102 8.012437 15.16254 1.832271 66.76261 4.740464 3.489676 Variance Decomposition of KLEX: Period S.E. KLRGDP KLFDI KLAID KLDINV KLEX KLIMP 1 0.405345 0.521838 0.664525 2.336485 28.67826 67.79890 0.000000 2 0.484393 4.873610 1.811576 3.371461 35.53521 47.69339 6.714751 3 0.522384 6.262767 12.73033 3.008580 30.88581 41.00888 6.103627 4 0.529897 6.087949 13.98512 3.576571 30.31819 39.85655 6.175610 5 0.534328 6.740631 13.96541 3.664868 30.10218 39.28478 6.242128 6 0.539818 6.662690 14.58828 4.018201 29.49420 39.05117 6.185453 7 0.546461 6.556713 15.94324 3.944771 29.17291 38.20116 6.181211 8 0.549874 6.480671 16.92692 3.914999 28.82299 37.73785 6.116565 9 0.550716 6.490750 16.96336 3.906661 28.83054 37.70889 6.099803 10 0.551891 6.584809 16.92255 3.939603 28.78152 37.69396 6.077557 Variance Decomposition of KLIMP: Period S.E. KLRGDP KLFDI KLAID KLDINV KLEX KLIMP 1 0.390089 2.294448 8.281972 0.441789 50.21157 12.22034 26.54989 2 0.538937 1.468271 16.75705 0.395878 54.54992 9.307551 17.52133 3 0.553262 1.686748 17.33250 1.080213 52.36193 10.09890 17.43971 4 0.571545 1.751751 20.34410 1.218479 50.01776 10.08007 16.58784 5 0.586251 1.828539 22.00813 1.641319 48.05927 10.57450 15.88823 6 0.589491 1.817416 22.57070 1.714995 47.53710 10.64315 15.71664 7 0.593562 1.793692 22.72343 1.837123 46.97646 11.16747 15.50182 8 0.594728 1.842128 22.71172 1.830129 46.82011 11.30467 15.49124 9 0.596426 2.211073 22.67156 1.832362 46.59052 11.28334 15.41115 10 0.597759 2.205563 22.86573 1.889806 46.39031 11.23378 15.41481 Cholesky Ordering: KLRGDP KLFDI KLAID KLDINV KLEX KLIMP
  • 27. 27 DATA SOURCES Variable Description Source EXP Exports of Goods and Services International Financial Statistics IMP Imports of Goods and Services International Financial Statistics AID Official Development Assistance, ODA Quality of Government Data set June 17, 2009 FDI Net Foreign Direct Investment Quality of Government Data set June 17, 2009 RGDP Real Gross Domestic Product Quality of Government Data set June 17, 2009 DIV Domestic Investment International Financial Statistics