Statistical Updates of SRSP
•
0 likes•370 views

Statistical Updates of May and june, 2014 of Sarhad Rural Support Programme (SRSP)

Recommended
Recommended
More Related Content
Viewers also liked
Viewers also liked (11)
Similar to Statistical Updates of SRSP
Similar to Statistical Updates of SRSP (20)
More from SRSP
More from SRSP (20)
Recently uploaded
Recently uploaded (20)
Statistical Updates of SRSP
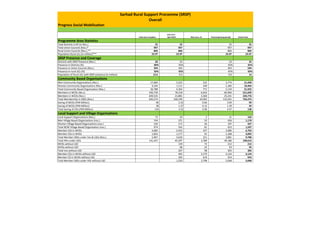
- 1. Total since inception July 13 to - April 2014 May-June, 14 Total (reporting period) Grand Total Programme Area Statistics Total Districts in KP (in Nos.) 25 25 25 25 Total Union Councils (Nos.)* 997 997 997 997 Rural Union Councils (Nos.) ** 866 866 866 866 Population Rural Ucs (in million)*** 23.97 23.97 23.97 23.97 SRSP Presence and Coverage Districts with SRSP Presence (Nos.) 20 23 23 23 Presence in Districts (%) 80% 92% 92% 92% Presence in Union Councils (Nos.) 594 393 393 594 Presence in rural UCs (%) 69% 45% 45% 69% Population of Rural UCs with SRSP presence (in million) 13.6 9.0 9.0 14 Community Based Organisations Men Community Organisations (Nos.) 17,684 3,252 522 3,774 21,458 Women Community Organisations (Nos.) 9,104 1,111 249 1,360 10,464 Total Community Based Organisation (Nos.) 26,788 4,363 771 5,134 31,922 Members in MCOs (No.s) 436,739 78,318 6,642 84,960 521,699 Members in WCOs (Nos.) 209,535 21,881 3,360 25,241 234,776 Total Membership in CBOs (Nos.) 646,274 100,199 10,002 110,201 756,475 Saving of MCOs (PKR Million) 96 2.25 0.84 3.09 99 Saving of WCOs (PKR Million) 38 1.27 0.12 1.39 39 Total Saving of COs (PKR Million) 134 3.52 0.96 4.47 138 Local Support and Village Organisations Local Support Organizations (Nos.) 72 29 2 31 103 Men Village Based Organisations (nos.) 744 371 55 426 1,170 Women Village Based Organisations (nos.) 230 171 26 197 427 Total M/W Village Based Organisation (nos.) 974 542 81 623 1,597 Member COs in MVOs 4,083 2,453 227 2,680 6,763 Member COs in WVOs 1,824 1,177 91 1,268 3,092 Total Member CBOs under Vos & LSOs (Nos.) 5,907 3,630 251 3,881 9,788 Total HHs under LSOs 141,427 45,397 3,789 49,186 190,613 MVOs without LSO 139 73 212 212 WVOs without LSO 68 25 93 93 Total Vos without LSO 207 98 305 305 Member COs in MVOs without LSO 945 3,179 4,124 4,124 Member CO in WVOs without LSO 305 619 924 924 Total Member CBOs under VOs without LSO 1,250 3,798 5,048 5,048 Progress Social Mobilisation Sarhad Rural Support Proramme (SRSP) Overall
- 2. Total since inception July 13 to - April 2014 May-June, 14 Total (reporting period) Grand Total Initiation & Implementation CPIs initiated In MCOs 6,187 672 - 672 6,859 CPIs initiated In WCOs 1,381 211 - 211 1,592 CPIs initiated jointy (m and women COs) 148 114 - 114 262 Total CPIs initiated 7,716 997 - 997 8,713 CPIs completed in MCOs 6,209 409 - 409 6,618 CPIs completed in WCOs 1,318 160 - 160 1,478 Joint CPIs completed 140 114 - 114 254 Total CPIs completed 7,667 683 - 683 8,350 CPIs droped 2 - - - 2 Completed PI's as Percent of the Total PI's Initiated 99% 69% - 1 2 Cost Total Cost of CPIs (Rs. in million) 3,921 1,090 - 1,090 5,011 SRSP's Share (Rs. in million) 3,268 976 - 976 4,244 MCOs Share (Rs. in million) 526 87 - 87 613 WCOs Share (Rs. in million) 106 28 - 28 134 Joint Share of men and women (Rs. in million) 21 - - - 21 Average Project Cost (Rs in Million) 0.42 0.98 - 1 1 Average MCO contribution (in PKR) 85,017 129,464 - 129,464 214,481 Average WCO contribution (in PKR) 76,756 133,308 - 133,308 210,064 Average Joint contribution (in PKR) 141,892 - - - 141,892 Total Average Cost of a CPI(Rs in Million) 0.51 1.09 - 1 2 Beneficiaries Beneficiaries (HHs) men 1,169,573 109,112 - 109,112 1,278,685 Beneficiaries (HHs) women 312,820 53,676 - 53,676 366,496 Beneficiaries (HHs) men and women in case of joint CPIs 21,090 10,223 - 10,223 31,313 Total CPI Beneficiaries 1,503,483 173,011 - 173,011 1,676,494 Types of Physical Infrastructure Schemes Drinking Water Supply Schemes 3,195 476 - 476 3,671 Suspension Bridges - 33 - 33 33 Link Roads 1,019 44 - 44 1,063 Irrigation Channels 952 106 - 106 1,058 Protection Works 364 48 - 48 412 IAUP 89 - - - 89 Sanitation and Drainage Schemes 1,883 129 - 129 2,012 Micro Hydro Projects 95 56 - 56 151 Schools Repaired 108 67 - 67 175 Health Centers Repaired 11 14 - 14 25 Other Govt and public facilities repaired - 24 - 24 24 Progress Physical Infrastructure & Water Enviromental Sanitation
- 3. Total since inception July 13 to - April 2014 May-June, 14 Total (reporting period) Grand Total Managerial and Leadership Trainings Members Trained in CMST (Male) 25,638 7,813 1,824 9,637 35,275 Members Trained in CMST (Female) 19,026 3,312 1,300 4,612 23,638 Total Members Trained in CMST 44,664 11,125 3,124 14,249 58,913 Members Trained in LMST (Male) 12,320 2,564 366 2,930 15,250 Members Trained in LMST (Female) 8,978 1,043 330 1,373 10,351 Total Members Trained in LMST 21,298 3,607 666 4,273 25,571 Community Resource Persons (CRPs) No. of Male CRPs (Trained) 448 249 73 322 770 No. of Female CRPs (Trained) 248 203 20 223 471 Managers' Conferences and Exposure Visits Managers' Conferences of Men COs 135 37 60 97 232 Male Participitants in Manager Conferences 8,207 2,149 373 2,522 10,729 Managers' Conferences of Women COs 89 35 86 121 210 Female Participitants in Manager Conferences 5,401 1,906 331 2,237 7,638 MCO Members given Exposure Visits 1,327 538 167 705 2,032 WCO Members given Exposure Visits 665 214 20 234 899 Technical Vocational Trainings Female Members Trained in Embroidry/Tailoring etc. (Tye & Dye, Stiching, Ada Work, Winta Wool, Abbaya Making, Crochea, Thread work, Block Printing, Salma Sitara, Ribbon work, Cutting & Sewing, Dress Making, Knitting, Beeds Work) 4,165 964 294 1,258 5,423 Female Members Trained in Trades (Candle Making, Hand Bag/Purse making, Decoration Pieces making, Dough Flower Making, Beautician, Surf Making, Mazri Product, Quilting, Food Preservations, Home Appliances) 1,168 40 - 40 1,208 Male Members Trained in Auto/Motor Cycle Repair Trades (Mechanic, Electrician, Welding) 351 270 - 270 621 Male Members Trained in Trades (Car Driving, Heavy Machinery, Computer Software, Tailoring, Cooking, Food Preservation) 1,923 450 237 687 2,610 Male Members Trained in Repair Works (Mobile, UPS, AC & Refrigrator, Washing Machine, Home Appliances, Energy Savers, Generator, Solar Panel Installation) 1,455 200 75 275 1,730 Male Members Trained in Building Trades (Plumbing, Welding, Carpentry, Masonery, Steel Fixing, Furniture Polish, Wood Work, Electrician) 2,564 253 6 259 2,823 Specialzed Trainings Disaster Management (Male) - 106 30 136 136 Disaster Management (Female) - 100 - 100 100 Conflict Management (Male) - 95 18 113 113 Conflict Management (Female) - 75 7 82 82 Participatory Hygiene & Sanitation Transformation (PHAST) Male 543 74 - 74 617 Participatory Hygiene & Sanitation Transformation (PHAST) Female 870 75 - 75 945 Appreciative Inquiry (male) - 76 - 76 76 Appreciative Inquiry (female) - 75 - 75 75 Livestock Emergency Guidelines & Standards (Male) - 11 - 11 11 Rights & Obligations (male) - 68 50 118 118 Project Oversight Committees Training 275 - - - 275 Community Activists Training (male) - - - Community Activists Training (Female) - - - FEGs Training - - - Operation Mantinance (DRR, DWSS, Irrigation) 77 77 77 Progress Human Resource Development
- 4. Total since inception July 13-June 14 Total (reporting period) Grand Total Program Outreach (MC) Districts (No.) 5 7 7 7 Union Councils (No.) 27 47 47 47 Village Banks (No.) 13 32 32 32 Program Outreach (CIF) Districts (No.) 7 8 8 8 Union Councils (No.) 62 66 66 66 Village Organizations (No.) 312 320 320 320 Disbursements (MC) Amount Disbursed (Rs. million) 601 65 65 667 Disbursement in Women (Rs. million) 327 58 58 385 Clients Served (No.) 53,878 5,031 5,031 58,909 Women Clients (No.) 28,665 4,603 4,603 33,268 Disbursements (CIF) Amount Disbursed (Rs. million) 313 90 90 402 Disbursement in Women (Rs. million) 313 90 90 402 Beneficiaries Served (No.) 27,041 9,941 9,941 36,982 Women Beneficiaries (No.) 27,041 9,941 9,941 36,982 Portfolio (MC) Active Clients (No.) 3,838 4,770 4,770 4,770 Portfolio Outstanding (Rs. million) 32 37 37 37 Recovery Rate (percentage) 100% 100 100 100% Component-wise Disbursements Urban Retail: Target Group PSC 23+ (MC) 159 21 21 181 Rural Retail: Target Group: PSC 23+ (MC) 326 - - 326 Village Banking: Credit Line (MC): Target Group: PSC 23+ 116 44 44 160 Credit Revolving Fund (CIF): Target Group: PSC 0-23 313 90 90 402 Sector-wise Disbursements (MC and CIF) Agriculture e.g. seeds, fertilizers etc (Rs. million) 18 3 3 21 Livestock e.g. goats for milching or raring etc (Rs. million) 320 54 54 374 Trading e.g. grocery stores, ladies shops etc (Rs. million) 494 84 84 577 Production e.g. vocational work (Rs. million) 55 9 9 64 Services e.g. parlors, canteens, vocational centers etc (Rs. million) 27 5 5 32 Others that ain't listed above (Rs. million) - - - - Progress Microfinance
- 5. Total since inception July 13 to - April 2014 May-June, 14 Total (reporting period) Grand Total Enterprise Development Number of Enterprises Established 459 2,910 400 3,310 3,769 Market Survey and Research Number of Trades Identified 11 228 13 241 252 Number of Value Chains Identified 4 14 7 21 25 Men and Women Enterprise Groups Men Clients (in nos.) 1,290 1,365 207 1,572 2,862 Women Clients (in nos. ) 510 390 140 530 1,040 Total Clients selected (in nos.) 1,800 1,755 347 2,102 3,902 Men Enterprise Groups (in nos.) 100 154 11 165 265 Women Enterprise Groups (in nos.) 34 24 22 46 80 Total Enterprise Groups (in nos.) 134 178 33 211 345 Enterprise Development Training Basic EDT Courses/Events (in nos.) 127 187 43 230 357 Participants (Male) in nos. 1,290 2,828 592 3,420 4,710 Participants (Female) in nos. 510 1,007 550 1,557 2,067 Total Members/Clients Trained (in nos.) 1,800 3,974 1,051 5,025 6,825 Skill Trainings Skill Training Events (in nos.) 58 14 16 30 88 Participants (Male) in nos. 5,610 6,714 851 7,565 13,175 Participants (Female) in nos. 2,460 2,098 275 2,373 4,833 Total Members/Clients Trained (in nos.) 8,070 8,812 1,066 9,878 17,948 Master Trainers Men Trained as Master Trainers (in nos.) 6 16 - 16 22 Women Trained as Master Trainers (in nos.) 22 8 15 23 45 Total Master Trainers (in nos.) 28 8 15 23 51 Exposure Visits Business Exposure Visits for Male (in nos.) 1 14 5 19 20 Male Participants in BEV (in nos.) 12 225 152 377 389 Business Exposure Visits for Female (in nos.) 8 12 1 13 21 Female Participants in BEV (in nos.) 42 99 25 124 166 Total Business Exposure Visits (in nos.) 9 26 6 32 41 Total Participants (in nos.) 54 398 177 575 629 Linkage Development Meetings for Linkage Development (in nos.) 64 16 6 22 86 Ent. groups participating in Linkages meetings (in nos.) 28 21 12 33 61 Ent. groups linked with service providers (in nos.) 28 24 3 27 55 Number of Enterpreneurs in commercial market 390 90 18 108 498 Progress Enterprise Development
- 6. Total since inception July 13 to - April 2014 May-June, 14 Total (reporting period) Grand Total Education Community Based Schools Community-Based Schools established (in nos.) 88 - - - 88 Boys enrolled (in nos.) 2,576 - 7 7 2,583 Girls enrolled (in nos.) 2,178 - 4 4 2,182 Total Enrollment (in nos.) 4,754 - 11 11 4,765 Girls Percentage 49 - - - 49 No of Boys Drop out - - 2 2 2 No of Girls Drop out - - 2 2 2 Adult Literacy Centers Women ALCs established (in nos.) 129 16 145 145 Men ALCs established (in nos.) - - - - Total ALCs established (in nos.) 129 16 145 145 Women Enrollment (in nos.) 3,192 797 3,989 3,989 Men Enrollment (in nos.) - - - - - Total Enrollment (in nos.) - 3,192 797 3,989 3,989 Parent Teacher Association Men PTAs formed (in Nos.) 65 1 66 66 Women PTAs formed (in Nos.) 40 5 45 45 Total PTAs formed (in nos.) 100 6 106 106 PTAs Trained (in nos.) 100 - 100 100 Members trained (men) 220 - 220 220 Members trained (women) 120 - 120 120 Capacity Building of Teachers Male teachers trained (in nos.) 946 - - - 946 Female teachers trained (in nos.) 1,400 130 44 174 1,574 School Repair/Reconstruction Boys Schools Repaired/Reconstructed (in nos.) 5 13 18 18 Girls Schools Repaired/Reconstructed (in nos.) - 5 5 5 Health Repair of Health Units Health Units Repaired (in nos.) 4 5 9 9 Health Committees Formed (in nos.) 4 3 7 7 Health Committee Members Trained (in nos.) 32 - 32 32 Female Health Workers Trained (in nos.) 16 - 16 16 Male Health Motivators Trained (in nos.) 16 - 16 16 Gender Workshops and Trainings (in nos.) 3 - 3 3 Legal Empowerment - Communities/Villages given Legal Literacy (in nos.) 212 267 105 372 584 Beneficiaries of Legal Literacy (in nos.) 22,000 10,539 875 11,414 33,414 Male paralegals trained (in nos.) 435 43 18 61 496 Female paralegals trained (in nos.) 429 40 22 62 491 Total Paralegals Trained (in nos.) 957 83 20 103 1,060 Beneficiaries of Paralegal services (in nos.) 1,298,066 82,729 19,471 102,200 1,400,266 Progress Social Sectors
- 7. Total since inception July 13 to - April 2014 May-June, 14 Total (reporting period) Grand Total Orientation Training Organizational Orientation for male staff (in nos.) 2,296 20 7 27 2,323 Organizational Orientation for female staff (in nos.) 1,454 13 4 17 1,471 Technical Training Male Staff trained in (in Nos.) Social Mobilization 475 35 26 61 536 Engineering 465 24 6 30 495 Micro Hydro Projects 84 15 2 17 101 Planning, Monitoring and Evaluation 182 19 - 19 201 Financial Management 114 5 - 5 119 Gender and Development 735 10 - 10 745 CIF Management 44 5 2 7 51 Accountability (Sphere Standards) 20 - - - 20 Code of Conduct/Ethics 46 - - - 46 Team Building 89 - - - 89 Training of Trainers 198 30 30 228 Rights Based Concepts 86 - - - 86 Security Measures 1 - - - 1 Female Staff trained in (in Nos.) Social Mobilization 316 3 3 319 Engineering 2 1 1 3 Micro Hydro Projects 5 1 1 6 Planning, Monitoring and Evaluation 114 5 - 5 119 Financial Management 36 - - 36 Gender and Development 294 10 3 13 307 CIF Management 21 6 - 6 27 Accountability (Sphere Standards) 5 - - 5 Code of Conduct/Ethics 24 - - 24 Team Building 36 3 3 39 Training of Trainers 76 2 2 78 Rights Based Concepts 46 - - 46 Security Measures - - - - Exposure Visits Exposure Visits for Male (in nos.) 348 5 5 10 358 Exposure Visits for female (in nos.) 140 1 - 1 141 International Training International Training for Male (in nos.) 123 - - - 123 International Training for Female (in nos.) 35 - - - 35 Progress Human Resource Development - Staff
- 8. Total since inception July 13 to - April 2014 May-June, 14 Total (reporting period) Grand Total Professional Staff Regular Staff Male regular professional staff (in nos.) 13 16 1 17 30 Female regular professional staff (in nos. ) 1 3 - 3 4 Total Regular Professional Staff (in nos.) 14 19 - 19 33 Project Staff Male project professional Staff (in nos.) 634 127 4 131 765 Female project professional Staff (in nos.) 176 23 - 23 199 Total Project Staff (in nos.) 810 150 - 150 960 New Staff Hiring (in reporting period) Male Staff (in nos.) 593 142 - 142 735 Female Staff (in nos.) 149 26 - 26 175 Total New Staff Hired (in nos.) 742 168 - 168 910 Affiliates, Interns and Consultants Male Professional Affiliates (in nos.) 44 12 15 27 71 Female Professional Affiliates (in nos.) 11 2 4 6 17 Total Professional Affiliates (in nos.) 55 14 - 14 69 Male Interns (in nos.) 39 2 - 2 41 Female Interns (in nos.) 12 - 3 3 15 Total Interns (in nos.) 51 2 - 2 53 Consultants- men (in nos.) 18 - - - 18 Consultants- women (in nos.) 2 2 - 2 4 Total Consultants (in nos.) 20 2 - 2 22 Support Staff Male Support Staff (in nos.) 358 62 5 67 425 Female Support Staff (in nos.) 5 - - - 5 Total Support Staff (in nos.) 363 62 - 62 425 Staff Turnover (in reporting period) Male Staff Turnover (in nos.) 88 351 12 363 451 Female Staff Turnover (in nos.) 33 103 4 107 140 Total Staff Turnover (in nos.) 120 454 - 454 574 Probation, Confirmation and EOBI - - Pending Probation Cases (in nos.) 1031 62 4 66 1,097 Confirmation cases (in nos.) 819 32 5 37 856 Staff having EOBI (in nos.) 967 355 4 359 1,326 Insurance Staff with Medical Cover (in nos.) 967 296 1 297 1,264 Staff having Health Insurance Cover (in nos.) 967 280 4 284 1,251 Staff with EFU Group Life Assurance (in nos.) 1638 - 8 8 1,646 Human Resources and Administration - Staff
- 9. Total since inception July 13 to - April 2014 May-June, 14 Total (reporting period) Grand Total NRM Trainings MCO Members Trained as LEWs (in nos. ) 3,980 - - - 3,980 WCO Members Trained as LEWs (in nos. ) 1,706 - - - 1,706 Total Members Trained as LEWs (in nos. ) 5,686 - - - 5,686 MCO Members Trained as AEWs. (in nos. ) 3,680 - - - 3,680 WCO Members Trained as AEWs (in nos. ) 1,577 - - - 1,577 Total Members Trained as AEWs (in nos. ) 5,257 - - - 5,257 MCO Members Trained as PEWs (in nos. ) - 15 - 15 15 WCO Members Trained as PEWs (in nos. ) 11,088 30 - 30 11,118 Total Members Trained as PEWs (in nos. ) 11,088 45 - 45 11,133 Demonstrations & Adoption Demo Plots in MCOs (in nos. ) 24,451 49 - 49 24,500 Demo Plots in WCOs (in nos. ) 5,357 29 - 29 5,386 Total Demos (in nos. ) 29,808 78 - 78 29,886 Farmer Field School(FFS) MCO Members Trained in FFS (in nos. ) 10,597 30 45 75 10,672 WCO Members Trained in FFS (in nos. ) 6,541 15 - 15 6,556 Total Memebrs Trained in FFS (in nos. ) 17,138 45 45 90 17,228 Improved Seed & Fertlizer Distribution - Improved Seed&Fertlizer Distribution to MCO (in nos. ) 10,600 27 - 27 10,627 Improved Seed & Fertlizer Distribution to WCO (in nos. ) 5,722 - - - 5,722 Total No. of the Farmers Benefitted (in nos. ) 16,322 27 - 27 16,349 Vaccination &Deworming Compaigns Total No. of Animal Vaccinated & Dewormed (in nos. ) 502,084 2,642 7,729 10,371 512,455 * Source : KP bureau of statistics, 2008-09 ** Source KP bureau of statistics, 2008-09 *** Source KP bureau of statistics, 2008-09 ****In addition in Social Cohesion and Resilience Unicef Swat project, they have established 80 child protection committees(2o men, 20 women, 20 boys and 2 girls members) *****In addition in Social Cohesion and Resilience Unicef Swat project, they have established 20 child protection centers(including 5990 enrollment) A project of "Take a Child to School", SRSP has enrolled 420 female and 547 male studenst in different Govt. Schools in two districts Swat and Chitral.(During last six months) Natural Resource Management