UiPath manufacturing technology benefits and AI overview
Day 6 interpreting graphs
1. NAME: __________________________ DATE: ___________
DAY 6 – Interpreting Graphs
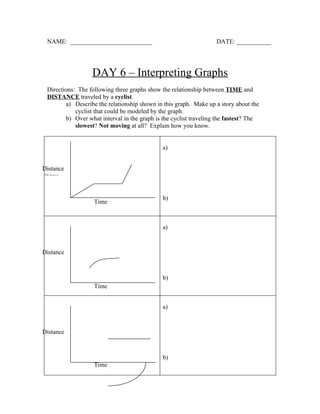
Directions: The following three graphs show the relationship between TIME and
DISTANCE traveled by a cyclist.
a) Describe the relationship shown in this graph. Make up a story about the
cyclist that could be modeled by the graph.
b) Over what interval in the graph is the cyclist traveling the fastest? The
slowest? Not moving at all? Explain how you know.
a)
Distance
Distance
ce
b)
Time
a)
Distance
b)
Time
a)
Distance
b)
Time
2. 2) Directions: Read the story about Mr. T. Go back, read the story a second time and
sketch a graph that matches Mr. T’s race.
Mr. T ran a 10 mile race last weekend. He paced himself, running
at a good but steady pace for the first 5 miles. He increased his pace
during the next 4 miles. For the last mile, he was tiring but kept moving
and managed to come in second place!
Now that you’re an expert, study the graph below!………..
car
bus
a. Label the x and y-axis. Describe why you chose each label.
b. Write a short story about the car and bus that matches the information given in the
graph.