SlideShare a Scribd company logo
1 of 126
Writekraft Research & Publications LLP
(All Rights Reserved)
Writekraft Research & Publications LLP
(Regd. No. AAI-1261)
Corporate Office: 67, UGF, Ganges Nagar (SRGP), 365 Hairis Ganj, Tatmill Chauraha, Kanpur, 208004
Phone: 0512-2328181
Mobile: 7753818181, 9838033084
Email: info@writekraft.com
Web: www.writekraft.com
Trading volume and stock return volatility in
Indian Stock Market
Introduction-
Investors, Policy makers, Portfoliomanagers, Brokers, Academicians and Regulators
alike are now intensively focusedupon understanding the volatility of asset returns and
its relationship to trading volume. Stockmarket plays an important role in the economic
development of a country because its performance has direct impact on capital market
growth. Trading volumeand stock returns are the twomajor pillars of the stock market
that possess the explanatory power to provide a transparent map of the capital market
microstructure in more depth. However,these factorsmay contain valuable information
about securities and provide guidelines to investors, policy makers, portfolio managers,
brokers, etc., for taking various decisions on the stockmarket’s volatility.Volatility
always creates a challenging environment in frontof investors, policy makers, brokers,
portfoliomanagers, brokers, etc. because almost every interesting financial decision
revolvesaround this element in the capital market. Since volatility is a standard
measure of financial vulnerability, it plays a key role in assessing risk/return trade-offs.
Investors always have some expectation from their investment decision and wish to fill
up the gap between expectations and actual return from the securities they hold. The
arrival of new information alwayscauses volatility in the stock market. All investors
are heterogeneous in their nature and alwaystake position as per their interpretations.
Therefore, analyzing volatility is essential in order to know the seasonal and causal
Writekraft Research & Publications LLP
(All Rights Reserved)
Writekraft Research & Publications LLP
(Regd. No. AAI-1261)
Corporate Office: 67, UGF, Ganges Nagar (SRGP), 365 Hairis Ganj, Tatmill Chauraha, Kanpur, 208004
Phone: 0512-2328181
Mobile: 7753818181, 9838033084
Email: info@writekraft.com
Web: www.writekraft.com
relationship between trading volumeand stock return. An investor’s objective
achievement thus depends upon the rationality behind trading - volumerelationships
and stockreturn volatility of the stockmarket. Therefore, in order to grow,succeed and
survive in the dynamic environment, investors should develop certain basis regarding
trading volume and stockreturn volatility whichmust be followedwhentaking rational
investment decision.
Through this study, an attempt has been made by the researcher to present a practical
point of view over the trading volume and stockreturn volatility statuses in Indian
stockmarket along withinvestors’ perceptions on the topic.
To get conclusiveresults on the subject we first analyzed secondary data of sensitive
index (SENSEX)and S&P CNX Nifty during the period of April 2002 to March 2012.
After this weconducted a survey in the market to study investors’ perceptions on this
subject. It is pertinent to reiterate here that our study deals with an important issue
134
whichhas not been adequately investigated witha long-term perspective by other
studies. Most of the earlier studies have taken only one aspect into consideration, the
relationship between trading volumeand stock return volatility.Investors’ perceptions,
however,have not been considered in any of the studies. Moreover,the studies have
been done on NSE, BSE and still there is no comprehensive study available on Indian
stockmarket whichis to consider every type of market.
6.2 Findings of the Study
Various statistical tests have been applied to extract vital information regarding the
purpose of the study in previous chapters. A summary of the findings has been
presented witha view to answering the research questions raised in the study.
Writekraft Research & Publications LLP
(All Rights Reserved)
Writekraft Research & Publications LLP
(Regd. No. AAI-1261)
Corporate Office: 67, UGF, Ganges Nagar (SRGP), 365 Hairis Ganj, Tatmill Chauraha, Kanpur, 208004
Phone: 0512-2328181
Mobile: 7753818181, 9838033084
Email: info@writekraft.com
Web: www.writekraft.com
First Research Objective
To examine the causal relationship between trading volume and stock return
volatility.
For this question we reviewed the literature on causal relationship between trading
volume and stockreturn volatility.It did not give conclusiveresults. Past literature
pointed out that the movement in the stockmarket is affected by the arrival of new
information into the market. Whenever the information is positive it takes upward
movement and vice-versa.Strong relationships have alwaysbeen found by various
researchers between trading volumeand stock return, whenever the flow of information
is most volatile. Lawrence and Makridakis (1989) suggests that the volatility of past
price series might have a significant impact on investors' forecasting behaviour. The
effectsof volatility on the market level have been widely researched in the finance
literature, but the results have been inconclusive. Some of the studies have suggested a
positive relationship between volatility (stockvariance) and stockreturns (Goyaland
Santa- Clara, 2003; Malkiel and Xu, 2002); while others have found the opposite. For
example, Ang, Hodrik, Xing, and Zhang (2004) demonstrated that stockswith a
relatively high past volatility tend to have lowerfuture returns than those with a low
past volatility.Granger Causality test is very sensitive forpredicting one variable by
employing another variable of time series. The study has employed the Granger
Causality Test for discovering the causal relationship between trading volume and
stockreturn volatility.The movement in stock market can only be decided, when
trading volume and stockreturns will consider simultaneously. The study of both
135
variables was required to find out the transparent map of the movement in the stock
Writekraft Research & Publications LLP
(All Rights Reserved)
Writekraft Research & Publications LLP
(Regd. No. AAI-1261)
Corporate Office: 67, UGF, Ganges Nagar (SRGP), 365 Hairis Ganj, Tatmill Chauraha, Kanpur, 208004
Phone: 0512-2328181
Mobile: 7753818181, 9838033084
Email: info@writekraft.com
Web: www.writekraft.com
market. The studyR Rof one indicator always conveysvague information about stock
market activity and cannot be used as an information signal. Therefore, studying the
causal relationship between stockreturns and trading volume improves the
understanding of the microstructure of the stock market. The basic purpose of this
relationship study is to provide protection against movement in future, in order to
reduce the extent of financial risks.
Campbell and Hentschel (1992)theoretically show that if expected future stockreturns
increase when volatility increases, then current stockprices (and hence returns) will fall
to adjust to this change in future expectations. Thus, an increase to volatility causes
negative returns. The volatility feedbackhypothesis relies on the existence of timevarying
risk premiums similar to the link between changes in volatility and returns
(Poterbaand Summers, 1986).
To know the relationship between trading volume and stockreturn volatility in stock
markets is very important for investors, brokers, researchers, policy makers and
portfoliomanagers for shifting their positions as per the movement of market. It
provides guidelines for taking rational investment decisions to meet their expectation
level with actual return fromthe securities they hold. Investors, brokers, policy makers
and portfoliomanagers willbenefit in modeling and forecasting short-run returns and
volatility.The dependence of return on past returns, past volumeand current volume
always raises questions regarding investors’ decisions. The dynamic and causal
relationship between trading volumeand stock return volatility helps in understanding
the future movement of the market.
Granger causality test provide the transparent map of causal relationship between
trading volume and stockreturn volatility in Indian stock market. Based on the
Writekraft Research & Publications LLP
(All Rights Reserved)
Writekraft Research & Publications LLP
(Regd. No. AAI-1261)
Corporate Office: 67, UGF, Ganges Nagar (SRGP), 365 Hairis Ganj, Tatmill Chauraha, Kanpur, 208004
Phone: 0512-2328181
Mobile: 7753818181, 9838033084
Email: info@writekraft.com
Web: www.writekraft.com
probability values reported in Table 3.8, the hypothesis that return does not Granger
cause volume can be rejected in sensitive index (SENSEX) as well as S&P CNX Nifty.
So, it can be inferred that returns contain significant information forvolume. But the
hypothesis that volume does not Granger cause return can be rejected only in sensitive
index (SENSEX).Thus, it appears in S&P CNX Nifty that causality runs one way but
not other way. However,bi-directional causality does not exist. But in sensitive index
(SENSEX)causality runs in both directions such as return causes volumeand volume
causes return. Therefore,bi-directional causality exists in sensitive index (SENSEX).
136
The hypothesis that previo
137
Correlation values in respect of sensitive Index (SENSEX) and S&P CNX Nifty are
0.001 and 0.002, which are positioned at a 1% level of significance. It is found that
previous day’s return and current stockreturns are positively correlated and strongly
supporting of one another. From this result it can be inferred that the indices do not
vary significantly while making strategies regarding previous day’s return and current
stockreturns. The significance correlation between previous day’s return and current
stockreturns is higher than the results of the correlation between previous day’s trading
volume and current stockreturns. Correlation values in respect of sensitive Index
(SENSEX)and S&P CNX Nifty are 0.012 and 0.018, whichare insignificant at a 5%
level of significance. It is found that previous day’s returns and current trading volume
are in an insignificant positive correlation. The correlation between previous day
returns and current trading volumes is lesser than the results of the correlation between
previous day returns and current stock returns. Previousday’s trading volume and
Writekraft Research & Publications LLP
(All Rights Reserved)
Writekraft Research & Publications LLP
(Regd. No. AAI-1261)
Corporate Office: 67, UGF, Ganges Nagar (SRGP), 365 Hairis Ganj, Tatmill Chauraha, Kanpur, 208004
Phone: 0512-2328181
Mobile: 7753818181, 9838033084
Email: info@writekraft.com
Web: www.writekraft.com
current trading volumes are in a significant positive correlation. From this result it can
be inferred that the indices do not vary significantly while making strategies regarding
previous day’s trading volume and current trading volume. Thus the strategies
regarding previous day’s trading volume and current trading volume for these stock
indices should be the same.
Correlation results provide the degree of linear relationship between two or more
variables, but it does not tell anything about the cause-effectrelationship between them.
Correlation results have found that an asymmetric relationship exists between trading
volume and stockreturn whichmeans that the change in one indicator does not have an
equal impact on the other variable.
Third Research Objective
To find out seasonality effectson trading volume and stockmarket returns.
This objective analyzed the pattern of volatility in the Indian stock market during April
1, 2002 to March 31, 2012 in terms of its time varying nature, presence of certain
characteristics such as volatility clustering and ‘calendar month effect,’and whether
there exists any conditional volatility in the Indian stockmarket. The estimation of
volatility is made at the macro level on two major market indices, namely, S&P CNX
Nifty and Sensitive Index (SENSEX).Volatility always creates challenging
environment in front of investors, policy makers, brokers, portfoliomanagers, etc.
138
because almost every interesting financial decision revolvesaround the volatility in the
capital market. Investors alwayshave some expectation fromtheir investment decision
and wish to fill up the gap between expectations and actual return from the securities
they hold. They want to increase return with an expected level of risk. Risk is always
Writekraft Research & Publications LLP
(All Rights Reserved)
Writekraft Research & Publications LLP
(Regd. No. AAI-1261)
Corporate Office: 67, UGF, Ganges Nagar (SRGP), 365 Hairis Ganj, Tatmill Chauraha, Kanpur, 208004
Phone: 0512-2328181
Mobile: 7753818181, 9838033084
Email: info@writekraft.com
Web: www.writekraft.com
associated with return. Investors seeking to avoidrisk, forexample, may choose to
adjust their portfolios by reducing their commitments to assets whose volatilities are
predicted to increase or by using more sophisticated dynamic diversification
approaches to predicted hedge volatility increase.
The arrival of new information always causes volatility in the stock market. If the
volatility is high, risk tends to go high. Volatility shows risk in returns. All investors are
heterogeneous in their nature and always take position as per their interpretations.
When all investors observe similar kinds of signal, good or bad, trading volume
relatively tends to go low because all investors have similar perceptions about the
trading volume of the stock.Whenever information is positive then stockprice will
have upward movement and vice-versa. Therefore,analyzing volatility is essential to
knowing the seasonal and conditional movement in stock return. The objective
achievement of an investor thus depends upon the rationality behind stock market
volatility.Therefore, in order to grow, succeed and survive in this dynamic
environment, investors develop a certain basis regarding volatility whichthey must
choose fortaking rational investment decisions. This contributes to the body of
knowledge by providing a holistic treatment to the subject of stockmarket volatility in
India and providing evidence on its main characteristic features withthe help of
econometric techniques and employing GARCH models.
In S&P CNX Nifty returns, it is found that there is a negative mean in case of January
and October.In the other months namely February, March, April, May June, July,
August, September, November and December a negative mean is not present.
Therefore, this shows that negative returns are always associated withhigh volatility.
Moreover, high volatility is the indication of negative return. Standard deviation shows
Writekraft Research & Publications LLP
(All Rights Reserved)
Writekraft Research & Publications LLP
(Regd. No. AAI-1261)
Corporate Office: 67, UGF, Ganges Nagar (SRGP), 365 Hairis Ganj, Tatmill Chauraha, Kanpur, 208004
Phone: 0512-2328181
Mobile: 7753818181, 9838033084
Email: info@writekraft.com
Web: www.writekraft.com
more volatility in case of Octoberand January. It shows the deviations fromthe mean
values. Therefore, these twomonths are highly volatile, whichis indicated by the
results of standard deviation. It highlights that festival and new years’ always have
impact on stock market. In S&P CNX Nifty volume,it is found that there is high
volume in case of January and Octoberwhichagain highlights the effectof New Year
139
and Diwaliand for the remaining ten months volume does not produce any significant
difference.
From both the indices it appears that the months of January and Octoberhave the
highest volatility in the period under study. Therefore, the results suggest that the
volatility in the Indian stockmarket exhibits the persistence of volatility and mean
revolving behaviour. Moreover,the study reveals that much of the movement in stock
market return volatility is explained by descriptive statistics. In general, volatility
seems to be of a persistent nature.
Fourth Research Objective
To analyze investors’ perceptions on the relationship between trading volume and
stockreturn volatility.
The analysis of trading volumeand stock return volatility relationship in Indian stock
market is only one aspect of study. To know the investors, brokers, policy makers and
portfoliomanagers’ perception on the volatility in the stock market is considered to be
an important part towards meeting the gap between their expectation and the actual
position on the market. The present study carried out a survey to gather the opinion of
investors, brokers, portfoliomanagers, financial experts on the relationship between
trading volume and stockreturn volatility in India. For this a sensitive questionnaire
Writekraft Research & Publications LLP
(All Rights Reserved)
Writekraft Research & Publications LLP
(Regd. No. AAI-1261)
Corporate Office: 67, UGF, Ganges Nagar (SRGP), 365 Hairis Ganj, Tatmill Chauraha, Kanpur, 208004
Phone: 0512-2328181
Mobile: 7753818181, 9838033084
Email: info@writekraft.com
Web: www.writekraft.com
was developed. Since study on this subject has never been done using primary data, the
present study framed the statements forthe questionnaire from theory and review of
empirical studies related to the topic. 993 questionnaires were found fit forthe data
analysis, whichleads to a final sample size of 993. To make the current study holistic in
nature, data was collectedfrom market participants of all demographic profiles.
Factor analysis was used to divide these statements into ten factors.The ten factors
whichwere extracted were named as importance of volume and return, perceived
information, cause-effectrelationship, anxiety, risk management, projection, anomalies,
inclination,
140
similarities or differences in their investors’ perceptions. A total of 993 respondents
were divided into fivegroups according to respondents’ age. The age of the
respondents ranges from 18 to 81 years old, with 10.5 percent between 18 to 25 years
old (n= 104), 25.3 percent between 25 to 35 years old (n=251), 34.1 percent between 35
to 50 years old (n=339), 24.2 percent between 50 to 70 years old (n=240) and 5.9
percent above 70 years old (n=59). This shows that the majority of respondents in the
first set are middle-aged. All respondents completely agree that trading volumes and
stockreturn have importance while making investment. There is no complete
agreement on the tactics they follow formaking strategy regarding financial decisions.
It signifies that the respondents of different age groups have diverse views on ‘tactics’
and the perception of respondents of different educational groups is not different to a
large extent on “volumeimportance and return”, ‘perceive’, ‘information’, ‘anxiety’,
‘projection’, ‘inclination’, ‘cause-effectrelationship’, ‘anomalies’ and ‘risk
management’ dimensions. Therefore, all respondents completely agree that causal
Writekraft Research & Publications LLP
(All Rights Reserved)
Writekraft Research & Publications LLP
(Regd. No. AAI-1261)
Corporate Office: 67, UGF, Ganges Nagar (SRGP), 365 Hairis Ganj, Tatmill Chauraha, Kanpur, 208004
Phone: 0512-2328181
Mobile: 7753818181, 9838033084
Email: info@writekraft.com
Web: www.writekraft.com
relationships exist between trading volume and stock return volatility.Moreover,all
age groups of respondents agree that causal relationships exist between trading volume
and stockreturn volatility but their opinions do not strongly agree on such kind of
relationship. Some of the respondents in favourof one way causal relationship exist
between trading volume and stockreturn volatility.Rest of them are in favourof
bidirectional causal relationship exists between trading volumeand stock return
volatility.
Education gives knowledge and a knowledgeable person becomes more aware and
concerned forthe financial decision they make. Therefore,investors’ perceptions are
also influenced by education. The sample was divided into fiveeducational categories
on the basis of the pilot study. In the sample, 3.07 percent respondents were educated
upto 12P
thP standard, 33.9 percent respondents were qualified upto graduation. Post
graduate respondents were 45.6 percent and only 15.6 percent were doctorates. After
analyzing the respondents’ responses on the basis of education groups, it has been
observed that most of the respondents have a graduation or post graduation
qualification. There is no complete agreement on three factorswith respect to
education, ‘cause-effectrelationship’, ‘risk management’ and ‘anomalies’ and the
perception of respondents of different educational groups is not different to a large
extent on ‘importance of volume and return’, ‘perceive’, ‘information’, ‘anxiety’,
141
‘projection’, ‘inclination’ and ‘tactics’ dimensions. Investors have different kinds of
perceptions on volume cause returns, return cause volume,previous day volume cause
current return, previous day return cause current return. Itshows that the investors’
Writekraft Research & Publications LLP
(All Rights Reserved)
Writekraft Research & Publications LLP
(Regd. No. AAI-1261)
Corporate Office: 67, UGF, Ganges Nagar (SRGP), 365 Hairis Ganj, Tatmill Chauraha, Kanpur, 208004
Phone: 0512-2328181
Mobile: 7753818181, 9838033084
Email: info@writekraft.com
Web: www.writekraft.com
education level has an impact on their strategy regarding the causal relationship
between trading volume and stockreturn volatility.Perceptions on risk management
also differ as per the education level of the investors. Risk plays an important role for
getting return. It is directly associated withreturn. It shows that risk management
techniques of the investors change as per the change in their education level.
Respondents strongly disagree that volatility was also high in festivaland other
occasions. The results also indicate that undergraduate respondents think festival and
seasons don’t have impact on increasing volatility while other respondents agree with
this. Moreover,the study has found that respondents of all education groups agree that
trading volume and stockreturn volatility have an importance while making investment
decisions. Therefore, volumes and returns are two important indicators forknowing the
capital market’s microstructure.
Investors’ investment is based on their income. Volume and frequency of earnings
influence the investment decision. Therefore, the monthly income of the respondents is
a vital component of investor’s demographics. It is recorded and categorized into six
groups. 10.5 percent (n=104) respondents earn less than twenty thousand rupees in a
month. 12 percent (119) respondents have monthly income between twenty to twenty
fivethousands. 10.06 percent (105) earn between twenty fiveto thirty thousand rupees.
15.3 percent (152) earn between thirty to thirty five thousand rupees. 25 percent (248)
earn between thirty fiveto forty thousand rupees and remaining 26.7 percent (265)
respondents earn more than forty thousand rupees in a month. After analysing the data
it was found that respondents do not have the same kind of perception regarding
anxiety whereas the rest of the factorsnamely importance of volumeand return,
perceive, information, cause-effectrelationship, risk management, projection,
Writekraft Research & Publications LLP
(All Rights Reserved)
Writekraft Research & Publications LLP
(Regd. No. AAI-1261)
Corporate Office: 67, UGF, Ganges Nagar (SRGP), 365 Hairis Ganj, Tatmill Chauraha, Kanpur, 208004
Phone: 0512-2328181
Mobile: 7753818181, 9838033084
Email: info@writekraft.com
Web: www.writekraft.com
anomalies, inclination and tactics do not show any significant differencein their
perception. So foronly one dimension namely anxiety, income is contributing
significant variation among investors perception whereas there is no difference in the
opinion of investors regarding trading volume and stockreturn volatility relationship.
Moreover, the study has found that investors whohave low incomes feel unsure and are
142
worried and anxious about investment decisions. They have unstable preferences while
making investment decisions.
Occupationis an important determinant foranalysis. Investor perceptions on trading
volume and stockreturn volatility is also affectedby their occupation. Majority
(39.4%) of respondents are in private services followedby the respondents who were in
government services (25.9%), 24.6 percent were found engaged in any business activity
or profession and 3.6 percent were found associated with agriculture and remaining
(6.5%) categorized as any other whowere either students or housewives. Scrutinizing
the results fromthe perspective of respondents’ occupation revealed that investors’
occupationdoes not bring any change in their opinion on volume and return, perceive,
cause-effectrelationship, anxiety, risk management, projection, anomalies and tactics
importance. It highlights that respondents of all occupationalgroups agree that trading
volume and stockreturn volatility is important while making investment decisions.
Moreover, they all have the same kind of opinion regarding cause-effectrelationships.
Respondents disagreed regarding information and inclination. The study also revealed
that it includes only business men and farmers whohave different opinions; else the
combinations of other occupational groups were not noticeably different from each
other.
Writekraft Research & Publications LLP
(All Rights Reserved)
Writekraft Research & Publications LLP
(Regd. No. AAI-1261)
Corporate Office: 67, UGF, Ganges Nagar (SRGP), 365 Hairis Ganj, Tatmill Chauraha, Kanpur, 208004
Phone: 0512-2328181
Mobile: 7753818181, 9838033084
Email: info@writekraft.com
Web: www.writekraft.com
Investors’ experience plays an important role in taking rational investment decisions.
Therefore, the respondents’ responses vary as per their experience. The experience of
participants ranges from 0 to 56 years, with 29.2 percent between 0 to 05 years (n=
290), 46.2 percent between 05 to 10 years (n=459), 16.9 percent between 10 to 15 years
(n=168) and 7.7 percent above 20 years (n=76). There is no complete agreement in case
of anxiety and perceive and for the remaining eight factors age does not produces any
difference in the opinion of the investors regarding trading volume and stockreturn
volatility.Moreover, the study has found that highly experienced investors don’t fear
while investing funds into the market. Therefore, they are fully confidentabout their
investment decisions.
In investment objective,20.3 percent (n=202) want safety of principal, whereas 26.1
percent (n= 259) participants want to generate income. There are 25.4 percent
participants (n=252) want to accomplish particular investment goal, whereas 23.2
percent participants (n=65) want growth. There are 5.5 percent (n=50) participants have
any other objective.After examining the data it was foundthat investors’ investment
143
objectivedoes not bring any change in their opinion on the importance of volumeand
return, perceive, information, cause-effectrelationship, projection, anomalies,
inclination and tactics. This highlights that all respondents completely agree that
trading volume and stockreturn volatility are important while making investment
decisions. Moreover,they all have same kind of opinion regarding the casual
relationship between trading volumeand stock return volatility.Respondents have
different kinds of perception regarding anxiety and risk management.
The natural demographic balance of male and female is reflected in the sample with
Writekraft Research & Publications LLP
(All Rights Reserved)
Writekraft Research & Publications LLP
(Regd. No. AAI-1261)
Corporate Office: 67, UGF, Ganges Nagar (SRGP), 365 Hairis Ganj, Tatmill Chauraha, Kanpur, 208004
Phone: 0512-2328181
Mobile: 7753818181, 9838033084
Email: info@writekraft.com
Web: www.writekraft.com
73.9 per cent male (n=734) and 26.1 per cent female (n=259). After examining the data
it was found that male and female opinion on the dimension anxiety differs. Gender
does not bring any significant difference regarding the remaining dimensions namely
importance of volume and return, perceive, information, cause-effectrelationship, risk
management, projection, anomalies, inclination and tactics. In case of respondents’
residence statuses, it was found that urban and rural respondents opinions have
significant variation forthe information and inclination dimensions but when it comes
to the remaining dimensions investors’ responses do not have any significant variation.
It was found that there is no variation in the respondents’ responses on the basis of their
marital status.
Regression results exemplified that information is the most important dimension while
making decisions on trading volume and stock return volatility importance, followedby
risk management, perceive, anxiety, projection, anomalies and inclination. All above
dimensions influence investors’ perceptions on trading volume and stockreturn
volatility importance. Therefore,the importance of trading volume and stock return is
associated with risk management, anxiety, anomalies, etc.
Risk management is the most important aspect whichinfluences investors’ perceptions
on the cause-effectrelationship, followedby projection and tactics. Negative
coefficientsforinformation show that investors’ decisions are affectedby information.
Negative coefficientsfor anxiety show that when investors have low anxiety then they
will perceive casual relationship. Moreover, when investors have high anxiety then they
will not show interest in the casual relationship. Therefore, when investors’ don’t have
a stable mind then it is negatively affectinginvestors’ perceptions on the causal
relationship between trading volumeand stock return. So results show that risk, tactics,
Writekraft Research & Publications LLP
(All Rights Reserved)
Writekraft Research & Publications LLP
(Regd. No. AAI-1261)
Corporate Office: 67, UGF, Ganges Nagar (SRGP), 365 Hairis Ganj, Tatmill Chauraha, Kanpur, 208004
Phone: 0512-2328181
Mobile: 7753818181, 9838033084
Email: info@writekraft.com
Web: www.writekraft.com
projections and information will exhibits higher impact on cause-effectrelationships
144
between trading volume and stockreturn volatility i.e., that investors willexhibits
higher tendency towards a cause-effectrelationship.
6.3 Suggestions
After completing all the analysis and highlighting the major results that are emerging
out of the study, this current section strives to suggest some innovations on the basis of
the study’s findings for making the bridge between their perceptions and actual
relationship exist between trading volume and stockreturn volatility in Indian stock
market. These innovations are made on the basis of the identified difference between
investors’ opinion and the actual relationship whichexists between trading volumeand
stockreturn volatility.
The result is summarized in the form of suggestions as under:
1. Investors, brokers, portfoliomanagers should acceptand adopt some strategies for
making investment decision in order to achieve maximum return at expected level
of risk from the securities held by them. The field of trading volume and stock
return volatility is universal and has to be adopted by all kind of investors
irrespective of their size, experience, income, etc. The relevance of trading volume
and stockreturn volatility should not be ignored as it is the only way through which
an investor can grow, succeed and survive in this dynamic environment. Investors,
brokers, portfolio managers must understand trading volume and stockreturn
volatility is not just for investment, on the contrary, it is a way of getting
speculative profit from their investment. Speculative profit means which weget in
short run due to volatility in stock market.
Writekraft Research & Publications LLP
(All Rights Reserved)
Writekraft Research & Publications LLP
(Regd. No. AAI-1261)
Corporate Office: 67, UGF, Ganges Nagar (SRGP), 365 Hairis Ganj, Tatmill Chauraha, Kanpur, 208004
Phone: 0512-2328181
Mobile: 7753818181, 9838033084
Email: info@writekraft.com
Web: www.writekraft.com
2. There is no causal relationship exists between previous day’s volume to current
return and previous day’s return to current volume. A causal relationship exists
between previous day’s return to current return. Moreover,a causal relationship
exists between current returns to current volume but the relationship does not exist
between current volumes to current returns. Therefore, returns contain significant
information for volume but volume does not contain significant information for
return. So it is suggested that investors, brokers and portfoliomanagers may use
current return for predicting current volumeand previous day’s return forpredicting
current return. Therefore, current return and current volume may be predicted only
through aforementioned indicators. They should not follow other indicators for
145
predicting the current return and current volume because there is no causal
relationship exists among them.
3. All respondents completely agree that trading volumes and stock return both have
importance while making investment decisions. The perceptions of respondents of
different groups are not differentto a large extent regarding the importance of
trading volume and stockreturn volatility,and a causal relationship exists between
trading volume and stockreturn volatility.Moreover, all groups of respondents
agree that a causal relationship exists between trading volume and stockreturn
volatility but their opinions do not strongly agree on such kind of relationship.
Mean of current return always cause current volumeand current volume always
cause current returns is 3.15. Mean of previous day’s volume alwayscause current
return is 3.04 and in case of previous day’s return alwayscause current volume is
3.38. It indicates that market participants give more importance to previous day’s
Writekraft Research & Publications LLP
(All Rights Reserved)
Writekraft Research & Publications LLP
(Regd. No. AAI-1261)
Corporate Office: 67, UGF, Ganges Nagar (SRGP), 365 Hairis Ganj, Tatmill Chauraha, Kanpur, 208004
Phone: 0512-2328181
Mobile: 7753818181, 9838033084
Email: info@writekraft.com
Web: www.writekraft.com
return and less importance to previous day’s volume. They have the same opinion
on the causal relationship between current return and current volume. Therefore,it
shows that investors, brokers and portfoliomanagers have equal perceptions
towards the aforementioned relationship but actually this does not exist. Therefore,
it can be concludedthat investors should change their perceptions forgetting high
return with expected level of risk. They should follow different kind of strategies
for differentinvestment decisions. They should use return and previous day’s return
for predicting current volumeand current return. Therefore, the gap exist between
the actual relationship exist between trading volume and stockreturn volatility and
their perceptions towards trading volume and stockreturn volatility.They should
try to make a bridge between their perceptions and the actual relationship existing
between trading volume and stockreturn volatility.Therefore, they can achieve
expected levels of return with the minimum risk.
4. All kind of investors give importance to trading volume and stock return volatility
for taking rational investment decisions but they do not follow the right directions.
So it is suggested that investors should conducta comprehensive analysis in order
to have a true picture of the complex environment.
5. The seasonality aspect of stock market cannot be ignored. There was a negative
mean in case of January and October.The other months namely February, March,
April, May June, July,August, September, November and December do not show
negative returns. Therefore, it shows that negative return is always associated with
146
high volatility.Moreover,high volatility is the indication of negative return.
Standard deviation shows more volatility in case of October and January. It shows
Writekraft Research & Publications LLP
(All Rights Reserved)
Writekraft Research & Publications LLP
(Regd. No. AAI-1261)
Corporate Office: 67, UGF, Ganges Nagar (SRGP), 365 Hairis Ganj, Tatmill Chauraha, Kanpur, 208004
Phone: 0512-2328181
Mobile: 7753818181, 9838033084
Email: info@writekraft.com
Web: www.writekraft.com
the deviations from the mean values. Therefore, these two months are highly
volatile, indicated by the results of standard deviation. This highlights that festivals
and new years’ always have impact on the stockmarket. In S&P CNX Nifty
volume, it is found that there is high volume in case of January and Octoberwhich
again highlights the effectof New Year and Diwaliand for the remaining ten
months volume does not produce any significant difference. Therefore,it is
suggested that investors should consider month of the year volatility in the stock
market. They should be more aware in January and Octoberwhile making
investment decision.
6. From both indices it appears that the months of January and Octoberhave the
highest volatility in the period under study. Therefore, the results suggest that the
volatility in the Indian stockmarket exhibits the persistence of volatility and mean
revolving behaviour. Moreover,the study reveals that much of the movement in
stockmarket return volatility is explained by the descriptive statistics. In general,
volatility seems to be of a persistent nature. Investors should be aware about all
kinds of volatility whichexists in stock market. They should analyze their
investment objectivefor the purpose of achieving objectiveswith expected level of
risk.
7. Trading volume and stockreturn volatility are the twomajor pillars of the stock
market through whichinvestors can understand the whole structure of the capital
market. The investors must understand that it is not enough to blindly follow an
investment decision making process. Investors should also keep a checkon real
time changes in situation like festivals, new years, recession, etc. whichnormally
finds many of the investors unprepared. Also, investors should workto improve
Writekraft Research & Publications LLP
(All Rights Reserved)
Writekraft Research & Publications LLP
(Regd. No. AAI-1261)
Corporate Office: 67, UGF, Ganges Nagar (SRGP), 365 Hairis Ganj, Tatmill Chauraha, Kanpur, 208004
Phone: 0512-2328181
Mobile: 7753818181, 9838033084
Email: info@writekraft.com
Web: www.writekraft.com
their understanding of the model on trading volume and stock return volatility.
They should not follow the direction of others.
8. Success of an investor is dependent upon the understanding of trading volume and
stockreturn volatility.Investors should incorporate a strong base when they make
an investment decision. Strategies may be followedby all kinds of investors with
the view of creating a bridge between their expected return and actual return from
the securities they hold. Overall the concept of trading volume and stock return
volatility should be incorporated while making investment decisions.
147
9. Undoubtedly, investors are most responsible for the success and failure to achieve
the investment objective.Investors may be individual or institutional, brokers,
portfoliomanagers, and should be clearly aware of their investment objective. They
should also consider the expected levelof risk which they expect fromtheir
investment. They should also consider the changing requirement of their
investment. A willingness and eagerness to consider new information, new
viewpoints, new ideas and new possibilities are essential. Another area of concern
is essential, whichshould be considered at the time of investment. Eachlevel of
investment should be well-cleared about investment objectives,direction of
investment and progress toward achieving one’s objective.
10. The investor should avoid ‘All Strategies forAll kind of Investment Decisions’.
Investors may avoid making the critical mistake of going fortoo many investment
strategies at a given point of time. Keeping in view the long-term success, investors
should read news papers and try to keep as informed as possible. Most individual
investors still believe that they only have to do what is required in order to achieve
Writekraft Research & Publications LLP
(All Rights Reserved)
Writekraft Research & Publications LLP
(Regd. No. AAI-1261)
Corporate Office: 67, UGF, Ganges Nagar (SRGP), 365 Hairis Ganj, Tatmill Chauraha, Kanpur, 208004
Phone: 0512-2328181
Mobile: 7753818181, 9838033084
Email: info@writekraft.com
Web: www.writekraft.com
their objectives.All possible investment outcomes have to be understood return at
the expected level of risk has to be increased.
11. Although the present study highlights only trading volume and stockreturn
volatility,there are lots of other indicators that require investor attention. Investors
may consider the viewsof financial experts whoare posing challenges to the Indian
stockmarket. Investors should give stress on previously ignored issues regarding
trading volume and stockreturn volatility.Investors are realizing that it is foolish to
blindly follow others. Understanding the changing investment issues may help the
investors in taking better decisions.
12. Understanding volatility in stockreturn and its relationship with trading volume is
the foundation of every successful investor. Investors should understand the actual
volatility in asset return series and its relationship with trading volume. Moreover,
investors should also analyze their business environment comprehensively.
Although the investors are aware of external and internal factorsaffecting
investment decisions, more focusis given to limited external and internal factors.
Therefore, it is suggested that investors may conducta comprehensive investment
situational diagnosis in order to have a true picture of the complex environment. So
investors, especially individual investor should consider trading volume and stock
return volatility seriously and ensure that they strongly follow it.
148
13. For effectiveinvestment, investors in the capital market should be more focused on
investment objective.Retail investors are more active in investing their fund into
the market as compared to institutional investors and proprietary investors.
However,they are governed by emotions and evaluate returns using shorter and
Writekraft Research & Publications LLP
(All Rights Reserved)
Writekraft Research & Publications LLP
(Regd. No. AAI-1261)
Corporate Office: 67, UGF, Ganges Nagar (SRGP), 365 Hairis Ganj, Tatmill Chauraha, Kanpur, 208004
Phone: 0512-2328181
Mobile: 7753818181, 9838033084
Email: info@writekraft.com
Web: www.writekraft.com
shorter intervals without any policy statement (Benos, 1998; Odean, 1998; Wang,
2001). Most of these investors lack knowledge and take the advice of financial
advisors and lose money in the process. It is, therefore, suggested that they should
try to identify the gap between their perceptions’ on trading volume and stock
return volatility,and the actual relationship that exists between trading volume and
stockreturn volatility.The majority of Indian retail investors lost money due to
their investment in stockmarket. As a result, they have again started shifting to
safer avenues of savings in banks whichhas further increased the dominance of
banks in India. Returns of retail investors are the key to the Indian stock market’s
development. The investors need long term capital gains to invest in the markets. A
lot of efforts are required to instill the trust and confidencein them so as to ensure
the well functioning of the markets. Our survey also supports this view.
14. Trading strategies of individual investors should be differentfrom those of
institutional investors foraccomplishing the objectiveof investment. Individual
investors are necessary to test many important theories, more attention needs to be
devoted to developing appropriate methods of studying them.
6.4 Concluding Remarks
Based on the findings, the study concludes that a significant one way relationship exists
between trading volume and stockreturn volatility.Overall, trading volume and stock
return volatility indicators play an important role while making investment decision.
With the help of these two indicators we may know the transparent map of the capital
market. But there is a gap that exists between the actual relationship between trading
volume and stockreturn volatility and the perceptions of investors on such kind of
relationship. Second aspect is the seasonality effectthat should be considered while
Writekraft Research & Publications LLP
(All Rights Reserved)
Writekraft Research & Publications LLP
(Regd. No. AAI-1261)
Corporate Office: 67, UGF, Ganges Nagar (SRGP), 365 Hairis Ganj, Tatmill Chauraha, Kanpur, 208004
Phone: 0512-2328181
Mobile: 7753818181, 9838033084
Email: info@writekraft.com
Web: www.writekraft.com
making an investment decision. Investors should try to estimate the volatility in January
and October.
149
Figure 6.1 Investors’ perceptions on trading volume and stock return volatility
and the actual relationship existing between trading volume and stock
return volatility.
6.5 Research Implication
Given the anticipated high growth of the economy and increasing interest of foreign
investors towards the country,it is important to understand the pattern of stock market
volatility in India whichis time-varying, persistent, and predictable. This may helps in
diversify international portfolios and formulate hedging strategies. Investors, Policy
makers, Portfoliomanagers, Brokers, Academicians and Regulators alike are now
intensively focused upon understanding the volatility of asset returns and its
relationship to trading volume. The various GARCH models provide good forecasts of
volatility and are useful forportfolio allocation,performance measurement, option
Relationship between
Trading Volume and Stock Return Volatility in Indian StockMarket Gap exist between actual
relationship and Investors’ Perceptions on Trading Volume and Stock Return Volatility in Indian
StockMarket Investors’ Perceptions on Trading Volume and Stock Return Volatility in Indian Stock
Market Increase Investors understanding on the relationship between Trading Volume and Stock
Return Volatility in Indian Stock Market Returns contain significant information for Volume but
Volume does not contain significant information forReturn January and Octobermonths are highly
volatile and have negative Returns Increase Profitsat expected level of Risk 150
valuation, etc. It has been observed that a more serious view is taken at the time of
investment in comparison to subsequent phases. Retail investors are the biggest part of
investors when talking about national development. Investment strategies are adopted
Writekraft Research & Publications LLP
(All Rights Reserved)
Writekraft Research & Publications LLP
(Regd. No. AAI-1261)
Corporate Office: 67, UGF, Ganges Nagar (SRGP), 365 Hairis Ganj, Tatmill Chauraha, Kanpur, 208004
Phone: 0512-2328181
Mobile: 7753818181, 9838033084
Email: info@writekraft.com
Web: www.writekraft.com
to a great extent but in several cases it is observed that the desired returns are not
achieved due to volatility in the market. There is a need to improve investment decision
making at all phases of investment for enhancing effectivereturns. The effectivenessof
an investor’s decision can further improve if the investor increases the level of focus
and understanding on the relationship between trading volume and stockreturn
volatility.
The comparison of investors’ perceptions on trading volume and stock return volatility,
and actual relationship exists between trading volumeand stock return volatility is
necessary for taking rational investment decisions. There is a gap between investors’
perceptions and the actual relationship existing between trading volume and stock
return volatility.Investors lack knowledgeand awareness on the relationship between
trading volume and stockreturn volatility.They are trading as speculators where they
more often lose money than gain. The returns can be estimated by volume but due to
the lack of proper education, awareness and knowledge of the relationship between
trading volume and stockreturn volatility,the desired volumes resulting into profitable
activity is yet to occur.It is, therefore, suggested that investors should have knowledge
on the relationship between trading volume and stockreturn volatility for
accomplishing their desired objectives. Our study also provides concreteevidence on
volume-return relationship in Indian market. An aware investor will be better equipped
to take risk and benefit fromparticipating in the stock market.
Although our government is spending vast sums of money on research in financial
markets, retail investors do not understand complex models that the researches talk
about. Research in the field of investor education should be promoted. This will also
help in increasing the investor base in India whichis currently minimal compared to
Writekraft Research & Publications LLP
(All Rights Reserved)
Writekraft Research & Publications LLP
(Regd. No. AAI-1261)
Corporate Office: 67, UGF, Ganges Nagar (SRGP), 365 Hairis Ganj, Tatmill Chauraha, Kanpur, 208004
Phone: 0512-2328181
Mobile: 7753818181, 9838033084
Email: info@writekraft.com
Web: www.writekraft.com
develop countries. As mentioned earlier, our study gives evidence of trading volume
and stockreturn volatility in the Indian stockmarket. Investors can take better
advantage after knowing the actual relationship that exists between trading volume and
stockreturn volatility.
151
6.6 Limitations of the Study
The study has concentrated on trading volume and stockreturn volatility in Indian
stockmarket along withinvestors’ perceptions on trading volume and stockreturn
volatility.
Second, S&P CNX Nifty and Sensitive Index (SENSEX) are considered as
representative indexes of the Indian stock market because the turnover of National
StockExchange is higher as compared to other stockexchange markets. Moreover
Bombay StockExchange is the premier stockexchange of India. The study does not
coverindividual stocksdue to it becoming unwieldy and requiring much more time.
Further, index being aggregative and representative in its nature, the usefulness of the
study does not get much affectedby not taking individual stocks into consideration.
Third, primary data was collected through a structured questionnaire given to the
investors, brokers, policy makers and portfoliomanagers involvedin the study. The
researcher had an intention to reach a larger sample but paucity of time, the attitude of
investors, brokers, policy makers and portfoliomanagers fromthe capital market
towards research resulted in limiting the size of sample to the present one. As the study
is also based upon primary data, the possibility of personal bias of the respondents
cannot be ruled out.
Fourth, the study uses only daily data and does not use high frequency data. The study
Writekraft Research & Publications LLP
(All Rights Reserved)
Writekraft Research & Publications LLP
(Regd. No. AAI-1261)
Corporate Office: 67, UGF, Ganges Nagar (SRGP), 365 Hairis Ganj, Tatmill Chauraha, Kanpur, 208004
Phone: 0512-2328181
Mobile: 7753818181, 9838033084
Email: info@writekraft.com
Web: www.writekraft.com
undertaken, however,unique as no comprehensive study of this nature coveringsuch a
long period making a detailed analysis seems to have been undertaken by any other
research scholar.
6.7 Agenda forFuture Research
In India, the status of research in the trading volume and stock return field is still at its
nascent stage. It is also felt that foreign researchers have made maximum contribution
to the field of trading volume and stockreturn volatility,whereas in India, there is
ample scope for further research. The present study has mainly explored the
relationship between trading volumeand stock return volatility along with investors’
perceptions on such relationship issues between these variables in depth. The modelling
effortin the present study is mainly exploratory, revealing many possible extensions for
future research. The areas for further research include, forexample, the following:
152
1. The study has analyzed the relationship between trading volume and stock
return volatility by taking S&P CNX Nifty and Sensitive Index (SENSEX) as
proxy forthe market. The relationship study can further be evaluated on various
sectors by using sectoral indices. One study can be carried out to examine the
election affecton the volatility of the stock market. Moreover, the volatility
relationship can be examined with political changes. Volatility was very high in
May, 2014 during the election of Lok Sabha in India.
2. This empirical research can be further expanded by selecting and analyzing high
frequency intra-day data and inclusion of additional economic variables in the
GARCH conditional variance equation. Multivariate GARCH can also be
employed for this purpose.
Writekraft Research & Publications LLP
(All Rights Reserved)
Writekraft Research & Publications LLP
(Regd. No. AAI-1261)
Corporate Office: 67, UGF, Ganges Nagar (SRGP), 365 Hairis Ganj, Tatmill Chauraha, Kanpur, 208004
Phone: 0512-2328181
Mobile: 7753818181, 9838033084
Email: info@writekraft.com
Web: www.writekraft.com
3. Trading hours, in India should be increased to facilitate alignment of Indian
market with international market forbetter assimilation of any economic
development in the global market. For example, a longer market is necessary to
know the status of market demands for new global products, export of Indian
products by foreign exchanges, easing of foreign investment by RBI, etc. The
extension of trade timings willnot only increase cross-country trade but will
also reduce end of the day volatility,i.e., volatility generated after the closing of
markets in India and their opening on the next day,on accountof foreign
markets that are open during this time. Further research can be carried out to
find a suitable extension of these timings.
4. A comparative study can be carried out between the Indian and international
stockmarkets. Research can also be carried out to identify the investors’
perceptions at an international level. Through the present study, an attempt has
been made to provide a direction, which may be followedto reach new
milestone in trading volume and stock return volatility.
Writekraft Research & Publications LLP
(All Rights Reserved)
Writekraft Research & Publications LLP
(Regd. No. AAI-1261)
Corporate Office: 67, UGF, Ganges Nagar (SRGP), 365 Hairis Ganj, Tatmill Chauraha, Kanpur, 208004
Phone: 0512-2328181
Mobile: 7753818181, 9838033084
Email: info@writekraft.com
Web: www.writekraft.com
5.1 CONCLUSION
Investors always have expectation of some positive rate of return. They always try to
accomplish the higher return with lower risk. Therefore, to achieve this objective they
observe market continuously. Based on their perception they carefully plan, evaluate and
allocate funds in various investible instruments, which offer safety of principal and
continuous return. Investment in equity shares is one of the avenues which offer greater
benefits, along with higher risks (Bharathi, 2009). Investors’ perception is defined as the
process by which an investor selects, organizes, and interprets market data into meaningful
information. Two investors if exposed to the same stock market under the same apparent
condition, but how each person recognizes, selects, organizes, and interprets these market
is a highly individual process base on each person’s own needs, experience, and
expectations. To know the influence that each of these variables on the investment decision
is very important for every investor.
However, we will examine some of the basic concepts that highlight the perceptual
process in context of investor behaviour. Investors act and react on the basis of their
perceptions, not on the basis of objective reality. For each investor, reality is a totally
personal phenomenon, based on that person’s needs, wants and personal experiences. Thus,
investors’ perceptions are much more important than their knowledge of objective reality.
For if one thinks about it, it’s not what actually so is, but what investors think is so, that
affects their actions, their investment, their reinvestment and so forth and because investor
make decision and take actions based on what they perceive to be reality, it is important to
understand the whole notion of perception and its related concepts to more readily
determine what factors influence investors’ investment decision.
Writekraft Research & Publications LLP
(All Rights Reserved)
Writekraft Research & Publications LLP
(Regd. No. AAI-1261)
Corporate Office: 67, UGF, Ganges Nagar (SRGP), 365 Hairis Ganj, Tatmill Chauraha, Kanpur, 208004
Phone: 0512-2328181
Mobile: 7753818181, 9838033084
Email: info@writekraft.com
Web: www.writekraft.com
Poterba and Summers (1986) and Campbell and Hentschel (1992) present the volatility
feedback hypothesis, where any innovations to volatility (especially positive ones) lead to a
decrease in returns. The leverage hypothesis has few supporters (see e.g. Low, 2004),
while the volatility feedback hypothesis involves a complicated economic process that
passes through expectations and dividends to validate the negative relationship and only
(weakly) explains the long term return–volatility relationship.
85
Writekraft Research & Publications LLP
(All Rights Reserved)
Writekraft Research & Publications LLP
(Regd. No. AAI-1261)
Corporate Office: 67, UGF, Ganges Nagar (SRGP), 365 Hairis Ganj, Tatmill Chauraha, Kanpur,
208004
Phone: 0512-2328181
Mobile: 7753818181, 9838033084
Email: info@writekraft.com
Web: www.writekraft.com
5.2 Methodologyand Results
5.2.1 Sampling and Data Collection
The study was conducted using convenience sampling making the overall sampling
criteria. Strict statistical sampling cannot be applied in selecting the respondents here as
we did not had exhausted list of investors. In such cases, Cadler, Phillips and Tybout
(1981) advocated the use of convenience sampling keeping in mind the important
dimensions of the market participants. The present study is based on empirical analysis
of investors’ perceptions on the relationship between trading volume and stock return
volatility. The current study is based on the primary data. The respondents of this study
are investors, brokers, portfolio managers, financial experts in India. A total of 1100
questionnaires were distributed in these areas. 993 questionnaire were found fit for the
data analysis, which leads to final sample size of 993. To make the current study
holistic in nature, data were collected from the market participants of all demographic
profiles.
5.2.2 Questionnaire formulation
Table 5.1: List of Variables regarding Investors’ Perceptions
S. No. Statements
V01 I get unsure by the views of financial experts.
V02 I am anxious about financial and money affairs.
V03 After making a decision, I am anxious whether I was right or wrong.
V04 I read the business section of the newspaper attentively.
V05 I like to join conversations about financial matters.
Writekraft Research & Publications LLP
(All Rights Reserved)
Writekraft Research & Publications LLP
(Regd. No. AAI-1261)
Corporate Office: 67, UGF, Ganges Nagar (SRGP), 365 Hairis Ganj, Tatmill Chauraha, Kanpur,
208004
Phone: 0512-2328181
Mobile: 7753818181, 9838033084
Email: info@writekraft.com
Web: www.writekraft.com
V06 I see the volume when I take decisions about investment.
V07 I see the returns when I take decisions about investment.
V08 Market participants are aware of all kinds of relationship between trading
volume and stock return volatility.
V09 Trading volume and stock return volatility help in determining future
price.
V10 Majority of market participants invest in market to earn quick money.
V11 Volume always higher in the month of October.
V12 Volumes always lower in the month of March.
V13 I see the relationship between trading volume and stock return when I take
decisions about investment.
V14 Trading volume and stock returns are two major pillars of the stock
market which have explanatory power to provide the transparent map of
86
Writekraft Research & Publications LLP
(All Rights Reserved)
Writekraft Research & Publications LLP
(Regd. No. AAI-1261)
Corporate Office: 67, UGF, Ganges Nagar (SRGP), 365 Hairis Ganj, Tatmill Chauraha, Kanpur,
208004
Phone: 0512-2328181
Mobile: 7753818181, 9838033084
Email: info@writekraft.com
Web: www.writekraft.com
the microstructure of the capital market.
V15 Volatility always creates challenging environment because almost every
interesting financial decision revolves around the volatility in the capital
market.
V16 Arrival of new information always causes the volatility in stock market.
V17 Managing risks in the stock market is difficult task because it has
movement as per the information flows into the market.
V18 It is very important to know the relationship between trading volume and
stock return volatility in stock markets for shifting the position as per the
movement of market.
V19 I have some expectation from my investment decision and wish to fill up
the gap between expectations and actual return from the securities.
V20 The dependence of return on past returns, past volume and current volume
always raise questions for me.
V21 I always take position as per my understanding about the market.
V22 Analyzing the stock return and trading volume is essential to know the
causal relationship between these two indicators.
V23 In order to succeed, grow and survive, I have to adopt various strategies
regarding trading volume and stock return volatility.
V24 A good knowledge of the relationship between trading volume and stock
return is necessary for gaining profit in the era of globalization.
V25 Current returns always cause current volume.
V26 Current volume always causes current returns.
V27 Previous day volume always causes current returns.
Writekraft Research & Publications LLP
(All Rights Reserved)
Writekraft Research & Publications LLP
(Regd. No. AAI-1261)
Corporate Office: 67, UGF, Ganges Nagar (SRGP), 365 Hairis Ganj, Tatmill Chauraha, Kanpur,
208004
Phone: 0512-2328181
Mobile: 7753818181, 9838033084
Email: info@writekraft.com
Web: www.writekraft.com
V28 Previous day returns always cause current volume.
V29 A large positive or large negative return lead future forecasts of the
variance.
V30 I follow others or depend on the directions of others when I invest my
fund into the market.
V31 I look at investment prepositions and apply my own judgment while
investing.
V32 I prefer to invest in domestic market.
V33 I dislike ambiguous situations where I feel that I am not in a better
position than others to evaluate investment in a given stock.
V34 I traded on the basis of superior information about the market but earned
lower return.
V35 I feel regret when I realize a loss and stock prices rise subsequently.
V36 I feel pride when I realize a gain and so sell the winners.
V37 I understand that in order to achieve higher returns, it is necessary to take
some risk.
(Source: Primary Data)
87
Writekraft Research & Publications LLP
(All Rights Reserved)
Writekraft Research & Publications LLP
(Regd. No. AAI-1261)
Corporate Office: 67, UGF, Ganges Nagar (SRGP), 365 Hairis Ganj, Tatmill Chauraha, Kanpur,
208004
Phone: 0512-2328181
Mobile: 7753818181, 9838033084
Email: info@writekraft.com
Web: www.writekraft.com
A pool of 41 simple understandable statements relating to investors’ perceptions on the
relationship between trading volume and stock return volatility was constructed, so that
their response on the same could be measured. These 41 statements were brain stormed
and out of these 41 statements 37 were finalized for the current study, which were
relating to measure investors’ perceptions on the relationship between trading volume
and stock return volatility. Participants were first asked to give their self-assessment by
answering 37 questions on their of investors’ perceptions on the relationship between
trading volume and stock return volatility shown in Table 5.1. The response format is a
five-point-Likert-type scale with “strongly disagree” and “strongly agree” at the two
ends of the question spectrum. Only essential variables were kept in the questionnaire
and number of items in scale was kept below 50 as asking too much from respondents
may give rise to unwillingness or inability of responding. As recommended by
Malhotra (2008), sensitive questions like income and demographics were kept in the
second part of questionnaire.
5.2.3 Demographic Analysis
Table 5.2: Demographic Profile of the Respondents
Demographics Frequency Proportion of the sample (%)
Gender
Male 734 73.9
Female 259 26.1
Total 993 100.0
18-25 104 10.5
25-35 251 25.3
Writekraft Research & Publications LLP
(All Rights Reserved)
Writekraft Research & Publications LLP
(Regd. No. AAI-1261)
Corporate Office: 67, UGF, Ganges Nagar (SRGP), 365 Hairis Ganj, Tatmill Chauraha, Kanpur,
208004
Phone: 0512-2328181
Mobile: 7753818181, 9838033084
Email: info@writekraft.com
Web: www.writekraft.com
Age
35-50 339 34.1
50-70 240 24.2
Above 70 59 5.9
Total 993 100.0
Up To 12P
th
37 3.7
Education
Graduation 337 33.9
P.G. 453 45.6
Doctorate 155 15.6
Any other 11 1.1
Total 993 100.0
88
Writekraft Research & Publications LLP
(All Rights Reserved)
Writekraft Research & Publications LLP
(Regd. No. AAI-1261)
Corporate Office: 67, UGF, Ganges Nagar (SRGP), 365 Hairis Ganj, Tatmill Chauraha, Kanpur,
208004
Phone: 0512-2328181
Mobile: 7753818181, 9838033084
Email: info@writekraft.com
Web: www.writekraft.com
0-20,000 (Rs)
Month
20,000-25,000 (Rs)
25,000-30,000 (Rs)
Per
30,000-35,000 (Rs)
Income
35,000-40,000 (Rs)
Above 40,000
Total
Govt. Services
Occupation
Private Services
Agriculture
Business
Any Other
Total
Residence
Urban
Total
Rural
MaritalStatus
Married
Unmarried
Total
0-5 yrs
InvestmentExperie
nce
5-10 yrs
Above 20 yrs
10-15 yrs
Total
Object
ives
Safety of the Principal
Generate Incom e
Achieve Particular
Investment
Investment Goal
Growth
Any Other
Total
(Source: Primary Data)
Writekraft Research & Publications LLP
(All Rights Reserved)
Writekraft Research & Publications LLP
(Regd. No. AAI-1261)
Corporate Office: 67, UGF, Ganges Nagar (SRGP), 365 Hairis Ganj, Tatmill Chauraha, Kanpur,
208004
Phone: 0512-2328181
Mobile: 7753818181, 9838033084
Email: info@writekraft.com
Web: www.writekraft.com
104 10.5
119 12.0
105 10.6
152 15.3
248 25.0
265 26.7
993 100.0
257 25.9
391 39.4
36 3.6
244 24.6
65 6.5
993 100.0
849 85.5
144 14.5
993 100.0
849 85.5
144 14.5
993 100.0
290 29.2
459 46.2
168 16.9
76 7.7
993 100.0
202 20.3
259 26.1
252 25.4
230 23.2
50 5.0
993 100.0
89
Writekraft Research & Publications LLP
(All Rights Reserved)
Writekraft Research & Publications LLP
(Regd. No. AAI-1261)
Corporate Office: 67, UGF, Ganges Nagar (SRGP), 365 Hairis Ganj, Tatmill Chauraha, Kanpur,
208004
Phone: 0512-2328181
Mobile: 7753818181, 9838033084
Email: info@writekraft.com
Web: www.writekraft.com
Table 5.2 delineates the demographic profile of the respondents. Total sample size is
993. Age, gender, educational qualification, occupation and monthly household
income constitute the demographic profile of the respondents. Demographic profile of
respondents was analyzed using frequency distribution. Although not every member of
the population is equally likely to be selected, the sample is composed of a wide variety
of backgrounds. The diversity came from such groups as participants in a study relating
to financial literacy, and from different sources such as a brokers, investors, finance
students, a group of finance teachers, etc.
Investors’ perceptions changes with according to their age. Therefore, the persons of
different age groups depict different kind of perception. Hence, it is of paramount
importance to study the perception of different age groups and try to understand the
similarities or differences in their investors’ perceptions. The age of participants ranges
from 18 to 81 years old, with 10.5 percent between 18 to 25 years old (n= 104), 25.3
percent between 25 to 35 years old (n=251), 34.1 percent between 35 to 50 years old
(n=339), 24.2 percent between 50 to 70 years old (n=240) and 5.9 percent above 70
years old (n=59).
The natural demographic balance of male and female is reflected in the sample with
73.9 per cent male (n=734) and 26.1 per cent female (n=259). Investors’ perceptions
are also influenced by education. Education gives knowledge and a knowledgeable
person becomes more aware and concerned for the investment. The sample is divided
into five educational categories on the basis of the pilot study. In the sample, 3.07
percent respondents were educated upto 12P
th
P standard, 33.9 percent respondents were
qualified upto graduation. Post graduate respondents were 45.6 percent and doctorates
were only 15.6 percent.
In investment objective, 20.3 percent (n=202) want safety of principal, whereas 26.1
percent (n= 259) participants want to generate income. There are 25.4 percent
participants (n=252) want to accomplish particular investment goal, whereas 23.2
Writekraft Research & Publications LLP
(All Rights Reserved)
Writekraft Research & Publications LLP
(Regd. No. AAI-1261)
Corporate Office: 67, UGF, Ganges Nagar (SRGP), 365 Hairis Ganj, Tatmill Chauraha, Kanpur,
208004
Phone: 0512-2328181
Mobile: 7753818181, 9838033084
Email: info@writekraft.com
Web: www.writekraft.com
percent participants (n=65) want growth. There are 5.5 percent (n=50) participants have
any other objective.
Investors experience play important role for taking rational investment decisions. The
experience of participants ranges from 0 to 56 years, with 29.2 percent between 0 to 05
90
Writekraft Research & Publications LLP
(All Rights Reserved)
Writekraft Research & Publications LLP
(Regd. No. AAI-1261)
Corporate Office: 67, UGF, Ganges Nagar (SRGP), 365 Hairis Ganj, Tatmill Chauraha, Kanpur,
208004
Phone: 0512-2328181
Mobile: 7753818181, 9838033084
Email: info@writekraft.com
Web: www.writekraft.com
years (n= 290), 46.2 percent between 05 to 10 years (n=459), 16.9 percent between 10
to 15 years (n=168) and 7.7 percent above 20 years (n=76).
Occupation is an important determinant for analysis. Investor perception on trading
volume and stock return volatility is also affected by their occupation. Majority
(39.4%) of respondents are in private services followed by the respondents who were in
government services (25.9%), 24.6 percent were found engaged in any business activity
or profession and 3.6 percent were found farmers and remaining (6.5%) categorized as
any other who were either students or housewives.
Investors’ investment is based on their income. Volume and frequency of earnings
influence the investment decision. Therefore, the monthly income of the respondents is
a vital component of investor’s demographics. It is recorded and categorized into six
groups. 10.5 percent (n=104) respondents earn less than twenty thousand rupees in a
month. 12 percent (119) respondents have monthly income between twenty to twenty
five thousands. 10.06 percent (105) earn between twenty five to thirty thousand rupees.
15.3 percent (152) earn between thirty to thirty five thousand rupees. 25 percent (248)
earn between thirty five to forty thousand rupees and remaining 26.7 percent (265)
respondents earn more than forty thousand rupees in a month.
5.2.4 Factor Analysis
Most practiced index of internal consistency in social sciences researches on multi-item
measures, the cronbach’s alpha (Schmitt, 1996) was used to check reliability in present
study. To bring down the statements to manageable level of dimensions, factor analysis
using principal components method of factor extraction with varimax rotation was
used. Besides these techniques, mean, variance, standard deviation was calculated and
used at various stages of data analysis. All the 37 statements of questionnaire were
subjected to alpha test of reliability; the cronbach’s alpha statistic for 37 statements was
showing that scale is reliable.
Writekraft Research & Publications LLP
(All Rights Reserved)
Writekraft Research & Publications LLP
(Regd. No. AAI-1261)
Corporate Office: 67, UGF, Ganges Nagar (SRGP), 365 Hairis Ganj, Tatmill Chauraha, Kanpur,
208004
Phone: 0512-2328181
Mobile: 7753818181, 9838033084
Email: info@writekraft.com
Web: www.writekraft.com
Investors’ perceptions on the relationship between trading volume and stock return
volatility was assessed through factor analysis. The application of factor analysis
resulted in to 10 dimensions concerning investors’ perceptions towards the relationship
between trading volume and stock return volatility. Principal component factor analysis
with Varimax rotation and Kaiser Normalization resulted into ten factor solution with
Eigen value more than 1. These factors explain 63.79 percent of total variance.
91
Writekraft Research & Publications LLP
(All Rights Reserved)
Writekraft Research & Publications LLP
(Regd. No. AAI-1261)
Corporate Office: 67, UGF, Ganges Nagar (SRGP), 365 Hairis Ganj, Tatmill Chauraha, Kanpur,
208004
Phone: 0512-2328181
Mobile: 7753818181, 9838033084
Email: info@writekraft.com
Web: www.writekraft.com
The value of KMO measure of sampling adequacy comes out to be 0.828 and Bartlett’s
test of sphericity was found to be significant, depicting that factor analysis can be
applied on this data. Factor analysis with principal component analysis and varimax
rotation was applied to find out the required dimensions. Principal component analysis
was used because the dimensions produced by factor analyses were to be further
subjected to multivariate analysis. The basis for factors extraction was kept as the eigen
value of 1.0 and rotated factor loading of at least 0.30 which is desirable (Costello and
Osborne, 2005). Principal component analysis extracted 10 factors explaining
approximately 63.79 per cent of variance.
Table 5.3: Communalities
Statements
I get unsure by the views of financial experts. 1.000 .700
I am anxious about financial and money affairs. 1.000 .726
After making a decision, I am anxious whether I was right or wrong. 1.000 .733
I read the business section of the newspaper attentively. 1.000 .580
I like to join conversations about financial matters. 1.000 .627
I see the volume when I take decisions about investment. 1.000 .558
I see the returns when I take decisions about investment. 1.000 .528
Market participants are aware of all kinds of relationship between trading 1.000 .677
volume and stock return volatility.
Trading volume and stock return volatility help in determining future price. 1.000 .652
Writekraft Research & Publications LLP
(All Rights Reserved)
Writekraft Research & Publications LLP
(Regd. No. AAI-1261)
Corporate Office: 67, UGF, Ganges Nagar (SRGP), 365 Hairis Ganj, Tatmill Chauraha, Kanpur,
208004
Phone: 0512-2328181
Mobile: 7753818181, 9838033084
Email: info@writekraft.com
Web: www.writekraft.com
Majority of market participants invest in market to earn quick money. 1.000 .641
Volume always higher in the month of October. 1.000 .741
Volumes always lower in the month of March. 1.000 .751
I see the relationship between trading volume and stock return when I take 1.000 .615
decisions about investment.
Trading volume and stock returns are two major pillars of the stock market
which have explanatory power to provide the transparent map of the 1.000 .793
microstructure of the capital market.
Volatility always creates challenging environment because almost every 1.000 .662
interesting financial decision revolves around the volatility in the capital market.
Arrival of new information always causes the volatility in stock market. 1.000 .573
92
Writekraft Research & Publications LLP
(All Rights Reserved)
Writekraft Research & Publications LLP
(Regd. No. AAI-1261)
Corporate Office: 67, UGF, Ganges Nagar (SRGP), 365 Hairis Ganj, Tatmill Chauraha, Kanpur,
208004
Phone: 0512-2328181
Mobile: 7753818181, 9838033084
Email: info@writekraft.com
Web: www.writekraft.com
Managing risks in the stock market is difficult task because it has movement as 1.000 .587
per the information flows into the market.
It is very important to know the relationship between trading volume and stock
return volatility in stock markets for shifting the position as per the movement of 1.000 .630
market.
I have some expectation from my investment decision and wish to fill up the gap 1.000 .539
between expectations and actual return from the securities.
The dependence of return on past returns, past volume and current volume 1.000 .587
always raise questions for me.
I always take position as per my understanding about the market. 1.000 .622
Analyzing the stock return and trading volume is essential to know the causal 1.000 .604
relationship between these two indicators.
In order to succeed, grow and survive, I have to adopt various strategies 1.000 .600
regarding trading volume and stock return volatility.
A good knowledge of the relationship between trading volume and stock return 1.000 .673
is necessary for gaining profit in the era of globalization.
Current returns always cause current volume. 1.000 .540
Current volume always causes current returns. 1.000 .635
Previous day volume always causes current returns. 1.000 .553
Previous day returns always cause current volume. 1.000 .675
Writekraft Research & Publications LLP
(All Rights Reserved)
Writekraft Research & Publications LLP
(Regd. No. AAI-1261)
Corporate Office: 67, UGF, Ganges Nagar (SRGP), 365 Hairis Ganj, Tatmill Chauraha, Kanpur,
208004
Phone: 0512-2328181
Mobile: 7753818181, 9838033084
Email: info@writekraft.com
Web: www.writekraft.com
A large positive or large negative return lead future forecasts of the variance. 1.000 .529
I follow others or depend on the directions of others when I invest my fund into 1.000 .605
the market.
I look at investment prepositions and apply my own judgment while investing. 1.000 .672
I prefer to invest in domestic market. 1.000 .555
I dislike ambiguous situations where I feel that I am not in a better position than 1.000 .661
others to evaluate investment in a given stock.
I traded on the basis of superior information about the market but earned lower 1.000 .679
return.
I feelregret when I realize a loss and stock prices rise subsequently. 1.000 .769
I feelpride when I realize a gain and so sell the winners. 1.000 .659
I understand that in order to achieve higher returns, it is necessary to take some 1.000 .673
risk.
(Source: Primary Data)
93
Writekraft Research & Publications LLP
(All Rights Reserved)
Writekraft Research & Publications LLP
(Regd. No. AAI-1261)
Corporate Office: 67, UGF, Ganges Nagar (SRGP), 365 Hairis Ganj, Tatmill Chauraha, Kanpur,
208004
Phone: 0512-2328181
Mobile: 7753818181, 9838033084
Email: info@writekraft.com
Web: www.writekraft.com
Table 5.3 shows the communalities before and after extraction. Principal component
analysis works on the initial assumption that all variance is common; therefore before
extraction the communalities are all ‘1’. The communalities in the column labelled
extraction reflect the common variance in the structure. So, from the table of
communalities, we can have the first variable (i.e. I get unsure by the views of financial
experts) showing the variance of 70%. Another way to look at these communalities is in
terms of the proportion of variance explained by the underlying factors. After extraction
some of the factors may get discarded and so some information is lost. The amount of
variance in each variable that can be explained by the retained factors is represented by
the communalities after extraction.
Table 5.4: Total Variance of Dimensions
Component
s Initial Eigenvalues Extraction Sums of Rotation Sums of
Squared Loadings
Squared
Loadings
% of Cumulative % of Cumulative % of Cumulative
Total Variance % Total Variance % Total Variance %
10.318 27.887 27.887 10.318 27.887 27.887 4.264 11.524 11.524
2 2.177 5.883 33.769 2.177 5.883 33.769 2.546 6.882 18.406
3 2.100 5.675 39.444 2.100 5.675 39.444 2.476 6.692 25.098
4 1.617 4.371 43.816 1.617 4.371 43.816 2.299 6.213 31.311
5 1.398 3.779 47.594 1.398 3.779 47.594 2.255 6.094 37.405
6 1.358 3.670 51.264 1.358 3.670 51.264 2.116 5.719 43.124
Writekraft Research & Publications LLP
(All Rights Reserved)
Writekraft Research & Publications LLP
(Regd. No. AAI-1261)
Corporate Office: 67, UGF, Ganges Nagar (SRGP), 365 Hairis Ganj, Tatmill Chauraha, Kanpur,
208004
Phone: 0512-2328181
Mobile: 7753818181, 9838033084
Email: info@writekraft.com
Web: www.writekraft.com
7 1.257 3.397 54.662 1.257 3.397 54.662 2.043 5.520 48.644
8 1.164 3.147 57.809 1.164 3.147 57.809 1.972 5.331 53.975
9 1.142 3.088 60.896 1.142 3.088 60.896 1.818 4.914 58.890
10 1.071 2.895 63.791 1.071 2.895 63.791 1.813 4.901 63.791
11 .975 2.634 66.425
12 .923 2.496 68.921
13 .899 2.430 71.351
14 .812 2.196 73.547
15 .774 2.092 75.638
16 .725 1.959 77.597
17 .704 1.903 79.500
18 .671 1.814 81.315
19 .637 1.723 83.037
94
Writekraft Research & Publications LLP
(All Rights Reserved)
Writekraft Research & Publications LLP
(Regd. No. AAI-1261)
Corporate Office: 67, UGF, Ganges Nagar (SRGP), 365 Hairis Ganj, Tatmill Chauraha, Kanpur,
208004
Phone: 0512-2328181
Mobile: 7753818181, 9838033084
Email: info@writekraft.com
Web: www.writekraft.com
20 .577 1.558 84.596
21 .562 1.519 86.115
22 .522 1.412 87.527
23 .513 1.387 88.913
24 .430 1.163 90.076
25 .414 1.119 91.195
26 .392 1.060 92.254
27 .368 .994 93.248
28 .356 .962 94.210
29 .335 .906 95.116
30 .323 .872 95.989
31 .308 .832 96.821
32 .254 .686 97.506
33 .239 .647 98.153
34 .216 .584 98.737
35 .180 .487 99.223
36 .173 .468 99.692
37 .114 .308 100.000
Source: Primary Data
Writekraft Research & Publications LLP
(All Rights Reserved)
Writekraft Research & Publications LLP
(Regd. No. AAI-1261)
Corporate Office: 67, UGF, Ganges Nagar (SRGP), 365 Hairis Ganj, Tatmill Chauraha, Kanpur,
208004
Phone: 0512-2328181
Mobile: 7753818181, 9838033084
Email: info@writekraft.com
Web: www.writekraft.com
Extraction Method: Principal Component Analysis.
Kaiser-Meyer-Olkin Measure of Sampling Adequacy = 0.828
The output in Table 5.4 lists the eigen values associated with each linear variable before
extraction and after extraction. Before extraction, SPSS has identified 37 linear
components within data set. The eigen values associated with each factor represent the
variance explained by that particular linear component and SPSS also displays the
eigen value in terms of the percentage of variance explained ( so, factor 1 i.e.,
Importance of volume and return has 11.52% of total variance). It is clear from the
above table that the first few factors explain relatively large amount of variance
whereas subsequent factors explain only small amounts of variance. SPSS then extracts
all variables with eigen values greater than 1, which leaves us with ten factors. The
eigen value associated with these factors are again displayed (and the percentage of
variance explained) in the columns labelled extraction sums of squared loading. The
values in this part of the table are the same as the values before extraction, except that
the values for the discarded factors are ignored (hence, the table is blank after the ten
factors).
95
Writekraft Research & Publications LLP
(All Rights Reserved)
Writekraft Research & Publications LLP
(Regd. No. AAI-1261)
Corporate Office: 67, UGF, Ganges Nagar (SRGP), 365 Hairis Ganj, Tatmill Chauraha, Kanpur,
208004
Phone: 0512-2328181
Mobile: 7753818181, 9838033084
Email: info@writekraft.com
Web: www.writekraft.com
Table 5.5: Rotated Component Matrix
Statements 1 2 3 4 5 6 7 8 9 10
I get unsure by the views of
.681
financial experts.
I am anxious about financial and
.795
money affairs.
After making a decision, I am
.677anxious whether I was right or
wrong.
I read the business section of the
.308 .383 .486
newspaper attentively.
I like to join conversations about
.648
financial matters.
I see the volume when I take
.454 .400
decisions about investment.
I see the returns when I take
.396 .501
decisions about investment.
Market participants are aware of
all kinds of relationship between
.318 .684
trading volume and stock return
Writekraft Research & Publications LLP
(All Rights Reserved)
Writekraft Research & Publications LLP
(Regd. No. AAI-1261)
Corporate Office: 67, UGF, Ganges Nagar (SRGP), 365 Hairis Ganj, Tatmill Chauraha, Kanpur,
208004
Phone: 0512-2328181
Mobile: 7753818181, 9838033084
Email: info@writekraft.com
Web: www.writekraft.com
volatility.
Trading volume and stock return
.734volatility help in determining
future price.
Majority of market participants
.358 .377 .359 .391invest in market to earn quick
money.
Volume always higher in the
.799
month of October.
Volumes always lower in the
.776
month of March.
I see the relationship between
trading volume and stock return
.624 .309
when I take decisions about
investment.
Trading volume and stock
returns
are two major pillars of the
stock
market which have explanatory
.693 .331 .334
power to provide the transparent
map of the microstructure of the
capital market.
Writekraft Research & Publications LLP
(All Rights Reserved)
Writekraft Research & Publications LLP
(Regd. No. AAI-1261)
Corporate Office: 67, UGF, Ganges Nagar (SRGP), 365 Hairis Ganj, Tatmill Chauraha, Kanpur,
208004
Phone: 0512-2328181
Mobile: 7753818181, 9838033084
Email: info@writekraft.com
Web: www.writekraft.com
96
Writekraft Research & Publications LLP
(All Rights Reserved)
Writekraft Research & Publications LLP
(Regd. No. AAI-1261)
Corporate Office: 67, UGF, Ganges Nagar (SRGP), 365 Hairis Ganj, Tatmill Chauraha, Kanpur,
208004
Phone: 0512-2328181
Mobile: 7753818181, 9838033084
Email: info@writekraft.com
Web: www.writekraft.com
Volatility always creates
challenging environment
because
almost every interesting
financial .488 .407
decision revolves around the
volatility in the capital market.
Arrival of new information
always
causes the volatility in stock .386 .440 .308
market.
Managing risks in the stock
market is difficult task because
it
.674
has movement as per the
information flows into the
market.
It is very important to know the
relationship between trading
volume and stock return
volatility
.678
in stock markets for shifting the
position as per the movement of
market.
I have some expectation from
my
investment decision and wish to
Writekraft Research & Publications LLP
(All Rights Reserved)
Writekraft Research & Publications LLP
(Regd. No. AAI-1261)
Corporate Office: 67, UGF, Ganges Nagar (SRGP), 365 Hairis Ganj, Tatmill Chauraha, Kanpur,
208004
Phone: 0512-2328181
Mobile: 7753818181, 9838033084
Email: info@writekraft.com
Web: www.writekraft.com
fill up the gap between .482 .307 .326
expectations and actual return
from the securities.
The dependence of return on
past
returns, past volume and current
.325 .363volume always raise questions
for
me.
I always take position as per my
.516 .418
understanding about the market.
Analyzing the stock return and
trading volume is essential to
.313 .546
know the causalrelationship
between these two indicators.
In order to succeed,grow and
survive, I have to adopt various
.363 .427 .379
strategies regarding trading
volume and stock return
volatility.
A good knowledge of the
relationship between trading
volume and stock return is .452 .512 .389
necessary for gaining profit in
the
Writekraft Research & Publications LLP
(All Rights Reserved)
Writekraft Research & Publications LLP
(Regd. No. AAI-1261)
Corporate Office: 67, UGF, Ganges Nagar (SRGP), 365 Hairis Ganj, Tatmill Chauraha, Kanpur,
208004
Phone: 0512-2328181
Mobile: 7753818181, 9838033084
Email: info@writekraft.com
Web: www.writekraft.com
era of globalization.
97
Writekraft Research & Publications LLP
(All Rights Reserved)
Writekraft Research & Publications LLP
(Regd. No. AAI-1261)
Corporate Office: 67, UGF, Ganges Nagar (SRGP), 365 Hairis Ganj, Tatmill Chauraha, Kanpur,
208004
Phone: 0512-2328181
Mobile: 7753818181, 9838033084
Email: info@writekraft.com
Web: www.writekraft.com
Current returns always cause
.574
current volume.
Current volume always causes
.773
current returns.
Previous day volume always
.323 .576
causes current returns.
Previous day returns always
cause
.788
current volume.
A large positive or large
negative
return lead future forecasts of
the .596
variance.
I follow others or depend on the
directions of others when I
invest .710
my fund into the market.
I look at investment prepositions
and apply my own judgment
while .662 .360
investing.
I prefer to invest in domestic
.596
market.
Writekraft Research & Publications LLP
(All Rights Reserved)
Writekraft Research & Publications LLP
(Regd. No. AAI-1261)
Corporate Office: 67, UGF, Ganges Nagar (SRGP), 365 Hairis Ganj, Tatmill Chauraha, Kanpur,
208004
Phone: 0512-2328181
Mobile: 7753818181, 9838033084
Email: info@writekraft.com
Web: www.writekraft.com
I dislike ambiguous situations
where I feel that I am not in a
better position than others to .671
evaluate investment in a given
stock.
I traded on the basis of superior
information about the market
but .533 .336 .321
earned lower return.
I feelregret when I realize a loss
.812and stock prices rise
subsequently.
I feelpride when I realize a gain
.621 .330
and so sell the winners.
I understand that in order to
achieve higher returns, it is .675
necessary to take some risk.
Source: Primary Data
Table 5.5 shows the rotated component matrix which is a matrix of the factor loadings
for each variable onto each factor. This matrix contains the same information as the
component matrix except that it is calculated after rotation. After rotation of the
variable all the variable are loaded onto group that is called factor.
Writekraft Research & Publications LLP
(All Rights Reserved)
Writekraft Research & Publications LLP
(Regd. No. AAI-1261)
Corporate Office: 67, UGF, Ganges Nagar (SRGP), 365 Hairis Ganj, Tatmill Chauraha, Kanpur,
208004
Phone: 0512-2328181
Mobile: 7753818181, 9838033084
Email: info@writekraft.com
Web: www.writekraft.com
98
Writekraft Research & Publications LLP
(All Rights Reserved)
Writekraft Research & Publications LLP
(Regd. No. AAI-1261)
Corporate Office: 67, UGF, Ganges Nagar (SRGP), 365 Hairis Ganj, Tatmill Chauraha, Kanpur,
208004
Phone: 0512-2328181
Mobile: 7753818181, 9838033084
Email: info@writekraft.com
Web: www.writekraft.com
Table 5.6: Profiling of Investors’ Perceptions towards the relationship between
Trading Volume and Stock Return Volatility
Variable Factor and Variables Factor
Number loading
(R1) Importance of volume and return (Cronbach’s α= .831)
V09 Trading volume and stock return volatility help in determining .734
future price.
V14 Trading volume and stock returns are two major pillars of the
stock market which have explanatory power to provide the .693
transparent map of the microstructure of the capital market.
V18 It is very important to know the relationship between trading
volume and stock return volatility in stock markets for shifting .678
the position as per the movement of market.
V13 I see the relationship between trading volume and stock return .624
when I take decisions about investment.
V15 Volatility always creates challenging environment because
almost every interesting financial decision revolves around the .488
volatility in the capital market.
V06 I see the volume when I take decisions about investment. .454
V19 I have some expectation from my investment decision and wish
to fill up the gap between expectations and actual return from .482
the securities.
Perceive (Cronbach’s α=.721)
V37 I understand that in order to achieve higher returns, it is
.675
necessary to take some risk.
V31 I look at investment prepositions and apply my own judgment
.662
while investing.
Writekraft Research & Publications LLP
(All Rights Reserved)
Writekraft Research & Publications LLP
(Regd. No. AAI-1261)
Corporate Office: 67, UGF, Ganges Nagar (SRGP), 365 Hairis Ganj, Tatmill Chauraha, Kanpur,
208004
Phone: 0512-2328181
Mobile: 7753818181, 9838033084
Email: info@writekraft.com
Web: www.writekraft.com
V05 I like to join conversations about financial matters. .648
V21 I always take position as per my understanding about the .516
market.
V07 I see the returns when I take decisions about investment. .501
Information (Cronbach’s α=.745)
V30 I follow others or depend on the directions of others when I
0.710
invest my fund into the market.
V08 Market participants are aware of all kinds of relationship
0.684
between trading volume and stock return volatility.
V34 I traded on the basis of superior information about the market 0.533
but earned lower return.
V04 I read the business section of the newspaper attentively. 0.486
V20 The dependence of return on past returns, past volume and
0.363
current volume always raise questions for me.
99
Writekraft Research & Publications LLP
(All Rights Reserved)
Writekraft Research & Publications LLP
(Regd. No. AAI-1261)
Corporate Office: 67, UGF, Ganges Nagar (SRGP), 365 Hairis Ganj, Tatmill Chauraha, Kanpur,
208004
Phone: 0512-2328181
Mobile: 7753818181, 9838033084
Email: info@writekraft.com
Web: www.writekraft.com
(R2) Cause-Effect Relationship (Cronbach’s α=.711)
V26 Current volume always causes current returns 0.773
V25 Current returns always cause current volume. 0.574
V27 Previous day volume always causes current returns. 0.576
V24 A good knowledge of the relationship between trading volume
and stock return is necessary for gaining profit in the era of 0.512
globalization.
V23 In order to succeed, grow and survive, I have to adopt various
0.427
strategies regarding trading volume and stock return volatility.
Anxiety (Cronbach’s α=.695)
V02 I am anxious about financial and money affairs 0.795
V01 I get unsure by the views of financial experts 0.681
V03 After making a decision, I am anxious whether I was right or
0.677
wrong
Risk Managem ent (Cronbach’s α= .609)
V17 Managing risks in the stock market is difficult task because it 0.674
has movement as per the information flows into the market.
V29 A large positive or large negative return lead future forecasts of 0.596
the variance.
V16 Arrival of new information always causes the volatility in stock 0.44
market.
Projection (Cronbach’s α=.673)
V35 I feel regret when I realize a loss and stock prices rise 0.812
Writekraft Research & Publications LLP
(All Rights Reserved)
Writekraft Research & Publications LLP
(Regd. No. AAI-1261)
Corporate Office: 67, UGF, Ganges Nagar (SRGP), 365 Hairis Ganj, Tatmill Chauraha, Kanpur,
208004
Phone: 0512-2328181
Mobile: 7753818181, 9838033084
Email: info@writekraft.com
Web: www.writekraft.com
subsequently
V36 I feel pride when I realize a gain and so sell the winners. 0.621
V10 Majority of market participants invest in market to earn quick 0.391
money.
Anomalies (Cronbach’s α= .745)
V11 Volume always higher in the month of October. 0.799
V12 Volumes always lower in the month of March. 0.776
Inclination (Cronbach’s α= .550)
V33 I dislike ambiguous situations where I feel that I am not in a
0.671
better position than others to evaluate investment in a given
stock.
V32 I prefer to invest in domestic market. 0.596
Tactics (Cronbach’s α= .465)
V28 Previous day returns always cause current volume. 0.788
V22 Analyzing the stock return and trading volume is essential to 0.546
know the causal relationship between these two indicators.
Source: Primary data
Extraction Method: Principal Component Analysis.
Rotation Method: Varimax with Kaiser Normalization
100
Writekraft Research & Publications LLP
(All Rights Reserved)
Writekraft Research & Publications LLP
(Regd. No. AAI-1261)
Corporate Office: 67, UGF, Ganges Nagar (SRGP), 365 Hairis Ganj, Tatmill Chauraha, Kanpur,
208004
Phone: 0512-2328181
Mobile: 7753818181, 9838033084
Email: info@writekraft.com
Web: www.writekraft.com
Table 5.6 presents the structure of each dimension depicting investors’ perceptions on
the relationship between trading volume and stock return volatility. It presents the
dimensions and the variables constituting each dimension. The factor loading of each
variable in the respective dimension is also shown in the table. Cronbach’s alpha was
also calculated for each factor to measure the internal consistency of the variables in a
specific factor, which is shows satisfactory results.
The ten factors which were extracted were named as importance of volume and return,
perceive, information, cause-effect relationship, anxiety, risk management, projection,
anomalies, inclination, and tactics (Table 5.6). To find out the impact of these
dimensions, multiple regression analysis was run for two factors taken here as
dependent variables named R1 (Importance of volume and return) and R2 (Cause-effect
relationship) (Table 5.6).
The ten components resulting from the factor analysis are described as follows:
(1) Factor 1 – Importance of Volume and Return. First factor consists of the statements
related to trading volume and stock return volatility, so it is named as ‘importance of
Volume and Return’. Reliability coefficient cronbach’s alpha for this factor is 0.831 and
it explains 11.52 percent of variance. The statement ‘trading volume and stock return
volatility help in determining future price’ has highest factor loading (0.734), which
communicates about the importance of trading volume and stock return indicators.
Investors’ think trading volume and stock return volatility can be used for forecasting
future prices. Another variable included in this factor is ‘trading volume and stock
returns are two major pillars of the stock market which have explanatory power to
provide the transparent map of the microstructure of the capital market’ with factor
loading of 0.693. This statement is testing that trading volume and stock return
volatility are important indicators for knowing the situation of the market. The
parameter ‘it is very important to know the relationship between trading volume and
stock return volatility in stock markets for shifting the position as per the movement of
market’ having factor loading of 0.678 highlights the importance of knowing the
Writekraft Research & Publications LLP
(All Rights Reserved)
Writekraft Research & Publications LLP
(Regd. No. AAI-1261)
Corporate Office: 67, UGF, Ganges Nagar (SRGP), 365 Hairis Ganj, Tatmill Chauraha, Kanpur,
208004
Phone: 0512-2328181
Mobile: 7753818181, 9838033084
Email: info@writekraft.com
Web: www.writekraft.com
relationship between trading volume and stock return volatility. Knowledge of trading
volume and stock return volatility is very helpful for shifting the position as per the
movement of market. I see the relationship between trading volume and stock return
when I take decisions about investment has factor loading of 0.624. This statement
101
Trading volume and stock return volatility in indian stock market [www.writekraft.com]

More Related Content

Similar to Trading volume and stock return volatility in indian stock market [www.writekraft.com]

A study of problems of small scale industries in jalgaon district [www.writek...
A study of problems of small scale industries in jalgaon district [www.writek...A study of problems of small scale industries in jalgaon district [www.writek...
A study of problems of small scale industries in jalgaon district [www.writek...WriteKraft Dissertations
 
A study on inventory management system [www.writekraft.com]
A study on inventory management system  [www.writekraft.com]A study on inventory management system  [www.writekraft.com]
A study on inventory management system [www.writekraft.com]WriteKraft Dissertations
 
A study on inventory management system [www.writekraft.com]
A study on inventory management system  [www.writekraft.com]A study on inventory management system  [www.writekraft.com]
A study on inventory management system [www.writekraft.com]WriteKraft Dissertations
 
A study on inventory management system [www.writekraft.com]
A study on inventory management system [www.writekraft.com]A study on inventory management system [www.writekraft.com]
A study on inventory management system [www.writekraft.com]WriteKraft Dissertations
 
A study on inventory management system [www.writekraft.com]
A study on inventory management system [www.writekraft.com]A study on inventory management system [www.writekraft.com]
A study on inventory management system [www.writekraft.com]WriteKraft Dissertations
 
A study on inventory management system [www.writekraft.com]
A study on inventory management system [www.writekraft.com]A study on inventory management system [www.writekraft.com]
A study on inventory management system [www.writekraft.com]WriteKraft Dissertations
 
A study on inventory management system copy
A study on inventory management system   copyA study on inventory management system   copy
A study on inventory management system copyWriteKraft Dissertations
 
A study on inventory management system [www.writekraft.com]
A study on inventory management system [www.writekraft.com]A study on inventory management system [www.writekraft.com]
A study on inventory management system [www.writekraft.com]WriteKraft Dissertations
 
A study on inventory management system [www.writekraft.com]
A study on inventory management system  [www.writekraft.com]A study on inventory management system  [www.writekraft.com]
A study on inventory management system [www.writekraft.com]WriteKraft Dissertations
 
A study on inventory management system [www.writekraft.com]
A study on inventory management system [www.writekraft.com]A study on inventory management system [www.writekraft.com]
A study on inventory management system [www.writekraft.com]WriteKraft Dissertations
 
Analysis of relationship between stock return, trade volume and volatility ev...
Analysis of relationship between stock return, trade volume and volatility ev...Analysis of relationship between stock return, trade volume and volatility ev...
Analysis of relationship between stock return, trade volume and volatility ev...Alexander Decker
 
A STUDY ON COMPARITIVE ANALYSIS OF VOLATILITY OF EQUITY SHARE PRICES FOR SELE...
A STUDY ON COMPARITIVE ANALYSIS OF VOLATILITY OF EQUITY SHARE PRICES FOR SELE...A STUDY ON COMPARITIVE ANALYSIS OF VOLATILITY OF EQUITY SHARE PRICES FOR SELE...
A STUDY ON COMPARITIVE ANALYSIS OF VOLATILITY OF EQUITY SHARE PRICES FOR SELE...IAEME Publication
 
IRJET- Stock Market Prediction using ANN
IRJET- Stock Market Prediction using ANNIRJET- Stock Market Prediction using ANN
IRJET- Stock Market Prediction using ANNIRJET Journal
 
A study into management of services of selected financial institutions in the...
A study into management of services of selected financial institutions in the...A study into management of services of selected financial institutions in the...
A study into management of services of selected financial institutions in the...WriteKraft Dissertations
 
Austin Journal of Business Administration and Management
Austin Journal of Business Administration and ManagementAustin Journal of Business Administration and Management
Austin Journal of Business Administration and ManagementAustin Publishing Group
 
EPIC RESEARCH SINGAPORE - Daily SGX Singapore report of 23 January 2015
EPIC RESEARCH SINGAPORE - Daily SGX Singapore report of 23 January 2015EPIC RESEARCH SINGAPORE - Daily SGX Singapore report of 23 January 2015
EPIC RESEARCH SINGAPORE - Daily SGX Singapore report of 23 January 2015Epic Research Singapore
 
Stock market efficiency of pakistan stock exchange a review of literature fro...
Stock market efficiency of pakistan stock exchange a review of literature fro...Stock market efficiency of pakistan stock exchange a review of literature fro...
Stock market efficiency of pakistan stock exchange a review of literature fro...Fiaz Ahmad
 

Similar to Trading volume and stock return volatility in indian stock market [www.writekraft.com] (20)

A study of problems of small scale industries in jalgaon district [www.writek...
A study of problems of small scale industries in jalgaon district [www.writek...A study of problems of small scale industries in jalgaon district [www.writek...
A study of problems of small scale industries in jalgaon district [www.writek...
 
A study on inventory management system [www.writekraft.com]
A study on inventory management system  [www.writekraft.com]A study on inventory management system  [www.writekraft.com]
A study on inventory management system [www.writekraft.com]
 
A study on inventory management system [www.writekraft.com]
A study on inventory management system  [www.writekraft.com]A study on inventory management system  [www.writekraft.com]
A study on inventory management system [www.writekraft.com]
 
A study on inventory management system [www.writekraft.com]
A study on inventory management system [www.writekraft.com]A study on inventory management system [www.writekraft.com]
A study on inventory management system [www.writekraft.com]
 
A study on inventory management system [www.writekraft.com]
A study on inventory management system [www.writekraft.com]A study on inventory management system [www.writekraft.com]
A study on inventory management system [www.writekraft.com]
 
A study on inventory management system [www.writekraft.com]
A study on inventory management system [www.writekraft.com]A study on inventory management system [www.writekraft.com]
A study on inventory management system [www.writekraft.com]
 
A study on inventory management system copy
A study on inventory management system   copyA study on inventory management system   copy
A study on inventory management system copy
 
A study on inventory management system [www.writekraft.com]
A study on inventory management system [www.writekraft.com]A study on inventory management system [www.writekraft.com]
A study on inventory management system [www.writekraft.com]
 
A study on inventory management system [www.writekraft.com]
A study on inventory management system  [www.writekraft.com]A study on inventory management system  [www.writekraft.com]
A study on inventory management system [www.writekraft.com]
 
A study on inventory management system [www.writekraft.com]
A study on inventory management system [www.writekraft.com]A study on inventory management system [www.writekraft.com]
A study on inventory management system [www.writekraft.com]
 
Analysis of relationship between stock return, trade volume and volatility ev...
Analysis of relationship between stock return, trade volume and volatility ev...Analysis of relationship between stock return, trade volume and volatility ev...
Analysis of relationship between stock return, trade volume and volatility ev...
 
A STUDY ON COMPARITIVE ANALYSIS OF VOLATILITY OF EQUITY SHARE PRICES FOR SELE...
A STUDY ON COMPARITIVE ANALYSIS OF VOLATILITY OF EQUITY SHARE PRICES FOR SELE...A STUDY ON COMPARITIVE ANALYSIS OF VOLATILITY OF EQUITY SHARE PRICES FOR SELE...
A STUDY ON COMPARITIVE ANALYSIS OF VOLATILITY OF EQUITY SHARE PRICES FOR SELE...
 
IRJET- Stock Market Prediction using ANN
IRJET- Stock Market Prediction using ANNIRJET- Stock Market Prediction using ANN
IRJET- Stock Market Prediction using ANN
 
A study into management of services of selected financial institutions in the...
A study into management of services of selected financial institutions in the...A study into management of services of selected financial institutions in the...
A study into management of services of selected financial institutions in the...
 
A study into management of services of selected financial institutions in the...
A study into management of services of selected financial institutions in the...A study into management of services of selected financial institutions in the...
A study into management of services of selected financial institutions in the...
 
Austin Journal of Business Administration and Management
Austin Journal of Business Administration and ManagementAustin Journal of Business Administration and Management
Austin Journal of Business Administration and Management
 
10120140503004
1012014050300410120140503004
10120140503004
 
EPIC RESEARCH SINGAPORE - Daily SGX Singapore report of 23 January 2015
EPIC RESEARCH SINGAPORE - Daily SGX Singapore report of 23 January 2015EPIC RESEARCH SINGAPORE - Daily SGX Singapore report of 23 January 2015
EPIC RESEARCH SINGAPORE - Daily SGX Singapore report of 23 January 2015
 
Stock market efficiency of pakistan stock exchange a review of literature fro...
Stock market efficiency of pakistan stock exchange a review of literature fro...Stock market efficiency of pakistan stock exchange a review of literature fro...
Stock market efficiency of pakistan stock exchange a review of literature fro...
 

More from WriteKraft Dissertations

Talent management practices in manufacturing industries in and around chennai...
Talent management practices in manufacturing industries in and around chennai...Talent management practices in manufacturing industries in and around chennai...
Talent management practices in manufacturing industries in and around chennai...WriteKraft Dissertations
 
Synchronous e learning for human resource management [www.writekraft.com]
Synchronous e learning for human resource management [www.writekraft.com]Synchronous e learning for human resource management [www.writekraft.com]
Synchronous e learning for human resource management [www.writekraft.com]WriteKraft Dissertations
 
Supply chain management of vegetable marketing [www.writekraft.com]
Supply chain management of vegetable marketing [www.writekraft.com]Supply chain management of vegetable marketing [www.writekraft.com]
Supply chain management of vegetable marketing [www.writekraft.com]WriteKraft Dissertations
 
Role of management education in promoting entrepreneurship [www.writekraft.com]
Role of management education in promoting entrepreneurship [www.writekraft.com]Role of management education in promoting entrepreneurship [www.writekraft.com]
Role of management education in promoting entrepreneurship [www.writekraft.com]WriteKraft Dissertations
 
Talent management practices in it sectors an analytical study of bangalore ba...
Talent management practices in it sectors an analytical study of bangalore ba...Talent management practices in it sectors an analytical study of bangalore ba...
Talent management practices in it sectors an analytical study of bangalore ba...WriteKraft Dissertations
 
A study on talent management in it industry [www.writekraft.com]
A study on talent management in it industry [www.writekraft.com]A study on talent management in it industry [www.writekraft.com]
A study on talent management in it industry [www.writekraft.com]WriteKraft Dissertations
 
A study on country commodity and currency exposure of export management in in...
A study on country commodity and currency exposure of export management in in...A study on country commodity and currency exposure of export management in in...
A study on country commodity and currency exposure of export management in in...WriteKraft Dissertations
 
A study on logistics cost management in inland container depots with special ...
A study on logistics cost management in inland container depots with special ...A study on logistics cost management in inland container depots with special ...
A study on logistics cost management in inland container depots with special ...WriteKraft Dissertations
 
Synchronous e learning for human resource management [www.writekraft.com]
Synchronous e learning for human resource management [www.writekraft.com]Synchronous e learning for human resource management [www.writekraft.com]
Synchronous e learning for human resource management [www.writekraft.com]WriteKraft Dissertations
 
Role of management education in promoting entrepreneurship [www.writekraft.com]
Role of management education in promoting entrepreneurship [www.writekraft.com]Role of management education in promoting entrepreneurship [www.writekraft.com]
Role of management education in promoting entrepreneurship [www.writekraft.com]WriteKraft Dissertations
 
Risk management in agriculture [www.writekraft.com]
Risk management in agriculture [www.writekraft.com]Risk management in agriculture [www.writekraft.com]
Risk management in agriculture [www.writekraft.com]WriteKraft Dissertations
 
Resource management in neyveli lignite corporation limited [www.writekraft.com]
Resource management in neyveli lignite corporation limited [www.writekraft.com]Resource management in neyveli lignite corporation limited [www.writekraft.com]
Resource management in neyveli lignite corporation limited [www.writekraft.com]WriteKraft Dissertations
 
Management of work life conflicts among working couples [www.writekraft.com]
Management of work life conflicts among working couples [www.writekraft.com]Management of work life conflicts among working couples [www.writekraft.com]
Management of work life conflicts among working couples [www.writekraft.com]WriteKraft Dissertations
 
Management of universities in india [www.writekraft.com]
Management of universities in india [www.writekraft.com]Management of universities in india [www.writekraft.com]
Management of universities in india [www.writekraft.com]WriteKraft Dissertations
 

More from WriteKraft Dissertations (20)

Starting a ph d www
Starting a ph d                   wwwStarting a ph d                   www
Starting a ph d www
 
Ph ds through m phil www
Ph ds through m phil     wwwPh ds through m phil     www
Ph ds through m phil www
 
Ph d research proposals www
Ph d research proposals                                              wwwPh d research proposals                                              www
Ph d research proposals www
 
Ph d eligibility criteria www
Ph d eligibility criteria                  wwwPh d eligibility criteria                  www
Ph d eligibility criteria www
 
Ph d applications www
Ph d applications    wwwPh d applications    www
Ph d applications www
 
Formatting of research pape
Formatting of research papeFormatting of research pape
Formatting of research pape
 
Talent management practices in manufacturing industries in and around chennai...
Talent management practices in manufacturing industries in and around chennai...Talent management practices in manufacturing industries in and around chennai...
Talent management practices in manufacturing industries in and around chennai...
 
Synchronous e learning for human resource management [www.writekraft.com]
Synchronous e learning for human resource management [www.writekraft.com]Synchronous e learning for human resource management [www.writekraft.com]
Synchronous e learning for human resource management [www.writekraft.com]
 
Supply chain management of vegetable marketing [www.writekraft.com]
Supply chain management of vegetable marketing [www.writekraft.com]Supply chain management of vegetable marketing [www.writekraft.com]
Supply chain management of vegetable marketing [www.writekraft.com]
 
Role of management education in promoting entrepreneurship [www.writekraft.com]
Role of management education in promoting entrepreneurship [www.writekraft.com]Role of management education in promoting entrepreneurship [www.writekraft.com]
Role of management education in promoting entrepreneurship [www.writekraft.com]
 
Talent management practices in it sectors an analytical study of bangalore ba...
Talent management practices in it sectors an analytical study of bangalore ba...Talent management practices in it sectors an analytical study of bangalore ba...
Talent management practices in it sectors an analytical study of bangalore ba...
 
A study on talent management in it industry [www.writekraft.com]
A study on talent management in it industry [www.writekraft.com]A study on talent management in it industry [www.writekraft.com]
A study on talent management in it industry [www.writekraft.com]
 
A study on country commodity and currency exposure of export management in in...
A study on country commodity and currency exposure of export management in in...A study on country commodity and currency exposure of export management in in...
A study on country commodity and currency exposure of export management in in...
 
A study on logistics cost management in inland container depots with special ...
A study on logistics cost management in inland container depots with special ...A study on logistics cost management in inland container depots with special ...
A study on logistics cost management in inland container depots with special ...
 
Synchronous e learning for human resource management [www.writekraft.com]
Synchronous e learning for human resource management [www.writekraft.com]Synchronous e learning for human resource management [www.writekraft.com]
Synchronous e learning for human resource management [www.writekraft.com]
 
Role of management education in promoting entrepreneurship [www.writekraft.com]
Role of management education in promoting entrepreneurship [www.writekraft.com]Role of management education in promoting entrepreneurship [www.writekraft.com]
Role of management education in promoting entrepreneurship [www.writekraft.com]
 
Risk management in agriculture [www.writekraft.com]
Risk management in agriculture [www.writekraft.com]Risk management in agriculture [www.writekraft.com]
Risk management in agriculture [www.writekraft.com]
 
Resource management in neyveli lignite corporation limited [www.writekraft.com]
Resource management in neyveli lignite corporation limited [www.writekraft.com]Resource management in neyveli lignite corporation limited [www.writekraft.com]
Resource management in neyveli lignite corporation limited [www.writekraft.com]
 
Management of work life conflicts among working couples [www.writekraft.com]
Management of work life conflicts among working couples [www.writekraft.com]Management of work life conflicts among working couples [www.writekraft.com]
Management of work life conflicts among working couples [www.writekraft.com]
 
Management of universities in india [www.writekraft.com]
Management of universities in india [www.writekraft.com]Management of universities in india [www.writekraft.com]
Management of universities in india [www.writekraft.com]
 

Recently uploaded

A Critique of the Proposed National Education Policy Reform
A Critique of the Proposed National Education Policy ReformA Critique of the Proposed National Education Policy Reform
A Critique of the Proposed National Education Policy ReformChameera Dedduwage
 
Hybridoma Technology ( Production , Purification , and Application )
Hybridoma Technology  ( Production , Purification , and Application  ) Hybridoma Technology  ( Production , Purification , and Application  )
Hybridoma Technology ( Production , Purification , and Application ) Sakshi Ghasle
 
“Oh GOSH! Reflecting on Hackteria's Collaborative Practices in a Global Do-It...
“Oh GOSH! Reflecting on Hackteria's Collaborative Practices in a Global Do-It...“Oh GOSH! Reflecting on Hackteria's Collaborative Practices in a Global Do-It...
“Oh GOSH! Reflecting on Hackteria's Collaborative Practices in a Global Do-It...Marc Dusseiller Dusjagr
 
Mastering the Unannounced Regulatory Inspection
Mastering the Unannounced Regulatory InspectionMastering the Unannounced Regulatory Inspection
Mastering the Unannounced Regulatory InspectionSafetyChain Software
 
Advanced Views - Calendar View in Odoo 17
Advanced Views - Calendar View in Odoo 17Advanced Views - Calendar View in Odoo 17
Advanced Views - Calendar View in Odoo 17Celine George
 
Q4-W6-Restating Informational Text Grade 3
Q4-W6-Restating Informational Text Grade 3Q4-W6-Restating Informational Text Grade 3
Q4-W6-Restating Informational Text Grade 3JemimahLaneBuaron
 
Kisan Call Centre - To harness potential of ICT in Agriculture by answer farm...
Kisan Call Centre - To harness potential of ICT in Agriculture by answer farm...Kisan Call Centre - To harness potential of ICT in Agriculture by answer farm...
Kisan Call Centre - To harness potential of ICT in Agriculture by answer farm...Krashi Coaching
 
SOCIAL AND HISTORICAL CONTEXT - LFTVD.pptx
SOCIAL AND HISTORICAL CONTEXT - LFTVD.pptxSOCIAL AND HISTORICAL CONTEXT - LFTVD.pptx
SOCIAL AND HISTORICAL CONTEXT - LFTVD.pptxiammrhaywood
 
Interactive Powerpoint_How to Master effective communication
Interactive Powerpoint_How to Master effective communicationInteractive Powerpoint_How to Master effective communication
Interactive Powerpoint_How to Master effective communicationnomboosow
 
Paris 2024 Olympic Geographies - an activity
Paris 2024 Olympic Geographies - an activityParis 2024 Olympic Geographies - an activity
Paris 2024 Olympic Geographies - an activityGeoBlogs
 
URLs and Routing in the Odoo 17 Website App
URLs and Routing in the Odoo 17 Website AppURLs and Routing in the Odoo 17 Website App
URLs and Routing in the Odoo 17 Website AppCeline George
 
Student login on Anyboli platform.helpin
Student login on Anyboli platform.helpinStudent login on Anyboli platform.helpin
Student login on Anyboli platform.helpinRaunakKeshri1
 
The Most Excellent Way | 1 Corinthians 13
The Most Excellent Way | 1 Corinthians 13The Most Excellent Way | 1 Corinthians 13
The Most Excellent Way | 1 Corinthians 13Steve Thomason
 
1029 - Danh muc Sach Giao Khoa 10 . pdf
1029 -  Danh muc Sach Giao Khoa 10 . pdf1029 -  Danh muc Sach Giao Khoa 10 . pdf
1029 - Danh muc Sach Giao Khoa 10 . pdfQucHHunhnh
 
18-04-UA_REPORT_MEDIALITERAСY_INDEX-DM_23-1-final-eng.pdf
18-04-UA_REPORT_MEDIALITERAСY_INDEX-DM_23-1-final-eng.pdf18-04-UA_REPORT_MEDIALITERAСY_INDEX-DM_23-1-final-eng.pdf
18-04-UA_REPORT_MEDIALITERAСY_INDEX-DM_23-1-final-eng.pdfssuser54595a
 
Web & Social Media Analytics Previous Year Question Paper.pdf
Web & Social Media Analytics Previous Year Question Paper.pdfWeb & Social Media Analytics Previous Year Question Paper.pdf
Web & Social Media Analytics Previous Year Question Paper.pdfJayanti Pande
 
The basics of sentences session 2pptx copy.pptx
The basics of sentences session 2pptx copy.pptxThe basics of sentences session 2pptx copy.pptx
The basics of sentences session 2pptx copy.pptxheathfieldcps1
 
Grant Readiness 101 TechSoup and Remy Consulting
Grant Readiness 101 TechSoup and Remy ConsultingGrant Readiness 101 TechSoup and Remy Consulting
Grant Readiness 101 TechSoup and Remy ConsultingTechSoup
 
Z Score,T Score, Percential Rank and Box Plot Graph
Z Score,T Score, Percential Rank and Box Plot GraphZ Score,T Score, Percential Rank and Box Plot Graph
Z Score,T Score, Percential Rank and Box Plot GraphThiyagu K
 

Recently uploaded (20)

A Critique of the Proposed National Education Policy Reform
A Critique of the Proposed National Education Policy ReformA Critique of the Proposed National Education Policy Reform
A Critique of the Proposed National Education Policy Reform
 
Hybridoma Technology ( Production , Purification , and Application )
Hybridoma Technology  ( Production , Purification , and Application  ) Hybridoma Technology  ( Production , Purification , and Application  )
Hybridoma Technology ( Production , Purification , and Application )
 
Staff of Color (SOC) Retention Efforts DDSD
Staff of Color (SOC) Retention Efforts DDSDStaff of Color (SOC) Retention Efforts DDSD
Staff of Color (SOC) Retention Efforts DDSD
 
“Oh GOSH! Reflecting on Hackteria's Collaborative Practices in a Global Do-It...
“Oh GOSH! Reflecting on Hackteria's Collaborative Practices in a Global Do-It...“Oh GOSH! Reflecting on Hackteria's Collaborative Practices in a Global Do-It...
“Oh GOSH! Reflecting on Hackteria's Collaborative Practices in a Global Do-It...
 
Mastering the Unannounced Regulatory Inspection
Mastering the Unannounced Regulatory InspectionMastering the Unannounced Regulatory Inspection
Mastering the Unannounced Regulatory Inspection
 
Advanced Views - Calendar View in Odoo 17
Advanced Views - Calendar View in Odoo 17Advanced Views - Calendar View in Odoo 17
Advanced Views - Calendar View in Odoo 17
 
Q4-W6-Restating Informational Text Grade 3
Q4-W6-Restating Informational Text Grade 3Q4-W6-Restating Informational Text Grade 3
Q4-W6-Restating Informational Text Grade 3
 
Kisan Call Centre - To harness potential of ICT in Agriculture by answer farm...
Kisan Call Centre - To harness potential of ICT in Agriculture by answer farm...Kisan Call Centre - To harness potential of ICT in Agriculture by answer farm...
Kisan Call Centre - To harness potential of ICT in Agriculture by answer farm...
 
SOCIAL AND HISTORICAL CONTEXT - LFTVD.pptx
SOCIAL AND HISTORICAL CONTEXT - LFTVD.pptxSOCIAL AND HISTORICAL CONTEXT - LFTVD.pptx
SOCIAL AND HISTORICAL CONTEXT - LFTVD.pptx
 
Interactive Powerpoint_How to Master effective communication
Interactive Powerpoint_How to Master effective communicationInteractive Powerpoint_How to Master effective communication
Interactive Powerpoint_How to Master effective communication
 
Paris 2024 Olympic Geographies - an activity
Paris 2024 Olympic Geographies - an activityParis 2024 Olympic Geographies - an activity
Paris 2024 Olympic Geographies - an activity
 
URLs and Routing in the Odoo 17 Website App
URLs and Routing in the Odoo 17 Website AppURLs and Routing in the Odoo 17 Website App
URLs and Routing in the Odoo 17 Website App
 
Student login on Anyboli platform.helpin
Student login on Anyboli platform.helpinStudent login on Anyboli platform.helpin
Student login on Anyboli platform.helpin
 
The Most Excellent Way | 1 Corinthians 13
The Most Excellent Way | 1 Corinthians 13The Most Excellent Way | 1 Corinthians 13
The Most Excellent Way | 1 Corinthians 13
 
1029 - Danh muc Sach Giao Khoa 10 . pdf
1029 -  Danh muc Sach Giao Khoa 10 . pdf1029 -  Danh muc Sach Giao Khoa 10 . pdf
1029 - Danh muc Sach Giao Khoa 10 . pdf
 
18-04-UA_REPORT_MEDIALITERAСY_INDEX-DM_23-1-final-eng.pdf
18-04-UA_REPORT_MEDIALITERAСY_INDEX-DM_23-1-final-eng.pdf18-04-UA_REPORT_MEDIALITERAСY_INDEX-DM_23-1-final-eng.pdf
18-04-UA_REPORT_MEDIALITERAСY_INDEX-DM_23-1-final-eng.pdf
 
Web & Social Media Analytics Previous Year Question Paper.pdf
Web & Social Media Analytics Previous Year Question Paper.pdfWeb & Social Media Analytics Previous Year Question Paper.pdf
Web & Social Media Analytics Previous Year Question Paper.pdf
 
The basics of sentences session 2pptx copy.pptx
The basics of sentences session 2pptx copy.pptxThe basics of sentences session 2pptx copy.pptx
The basics of sentences session 2pptx copy.pptx
 
Grant Readiness 101 TechSoup and Remy Consulting
Grant Readiness 101 TechSoup and Remy ConsultingGrant Readiness 101 TechSoup and Remy Consulting
Grant Readiness 101 TechSoup and Remy Consulting
 
Z Score,T Score, Percential Rank and Box Plot Graph
Z Score,T Score, Percential Rank and Box Plot GraphZ Score,T Score, Percential Rank and Box Plot Graph
Z Score,T Score, Percential Rank and Box Plot Graph
 

Trading volume and stock return volatility in indian stock market [www.writekraft.com]

  • 1. Writekraft Research & Publications LLP (All Rights Reserved) Writekraft Research & Publications LLP (Regd. No. AAI-1261) Corporate Office: 67, UGF, Ganges Nagar (SRGP), 365 Hairis Ganj, Tatmill Chauraha, Kanpur, 208004 Phone: 0512-2328181 Mobile: 7753818181, 9838033084 Email: info@writekraft.com Web: www.writekraft.com Trading volume and stock return volatility in Indian Stock Market Introduction- Investors, Policy makers, Portfoliomanagers, Brokers, Academicians and Regulators alike are now intensively focusedupon understanding the volatility of asset returns and its relationship to trading volume. Stockmarket plays an important role in the economic development of a country because its performance has direct impact on capital market growth. Trading volumeand stock returns are the twomajor pillars of the stock market that possess the explanatory power to provide a transparent map of the capital market microstructure in more depth. However,these factorsmay contain valuable information about securities and provide guidelines to investors, policy makers, portfolio managers, brokers, etc., for taking various decisions on the stockmarket’s volatility.Volatility always creates a challenging environment in frontof investors, policy makers, brokers, portfoliomanagers, brokers, etc. because almost every interesting financial decision revolvesaround this element in the capital market. Since volatility is a standard measure of financial vulnerability, it plays a key role in assessing risk/return trade-offs. Investors always have some expectation from their investment decision and wish to fill up the gap between expectations and actual return from the securities they hold. The arrival of new information alwayscauses volatility in the stock market. All investors are heterogeneous in their nature and alwaystake position as per their interpretations. Therefore, analyzing volatility is essential in order to know the seasonal and causal
  • 2. Writekraft Research & Publications LLP (All Rights Reserved) Writekraft Research & Publications LLP (Regd. No. AAI-1261) Corporate Office: 67, UGF, Ganges Nagar (SRGP), 365 Hairis Ganj, Tatmill Chauraha, Kanpur, 208004 Phone: 0512-2328181 Mobile: 7753818181, 9838033084 Email: info@writekraft.com Web: www.writekraft.com relationship between trading volumeand stock return. An investor’s objective achievement thus depends upon the rationality behind trading - volumerelationships and stockreturn volatility of the stockmarket. Therefore, in order to grow,succeed and survive in the dynamic environment, investors should develop certain basis regarding trading volume and stockreturn volatility whichmust be followedwhentaking rational investment decision. Through this study, an attempt has been made by the researcher to present a practical point of view over the trading volume and stockreturn volatility statuses in Indian stockmarket along withinvestors’ perceptions on the topic. To get conclusiveresults on the subject we first analyzed secondary data of sensitive index (SENSEX)and S&P CNX Nifty during the period of April 2002 to March 2012. After this weconducted a survey in the market to study investors’ perceptions on this subject. It is pertinent to reiterate here that our study deals with an important issue 134 whichhas not been adequately investigated witha long-term perspective by other studies. Most of the earlier studies have taken only one aspect into consideration, the relationship between trading volumeand stock return volatility.Investors’ perceptions, however,have not been considered in any of the studies. Moreover,the studies have been done on NSE, BSE and still there is no comprehensive study available on Indian stockmarket whichis to consider every type of market. 6.2 Findings of the Study Various statistical tests have been applied to extract vital information regarding the purpose of the study in previous chapters. A summary of the findings has been presented witha view to answering the research questions raised in the study.
  • 3. Writekraft Research & Publications LLP (All Rights Reserved) Writekraft Research & Publications LLP (Regd. No. AAI-1261) Corporate Office: 67, UGF, Ganges Nagar (SRGP), 365 Hairis Ganj, Tatmill Chauraha, Kanpur, 208004 Phone: 0512-2328181 Mobile: 7753818181, 9838033084 Email: info@writekraft.com Web: www.writekraft.com First Research Objective To examine the causal relationship between trading volume and stock return volatility. For this question we reviewed the literature on causal relationship between trading volume and stockreturn volatility.It did not give conclusiveresults. Past literature pointed out that the movement in the stockmarket is affected by the arrival of new information into the market. Whenever the information is positive it takes upward movement and vice-versa.Strong relationships have alwaysbeen found by various researchers between trading volumeand stock return, whenever the flow of information is most volatile. Lawrence and Makridakis (1989) suggests that the volatility of past price series might have a significant impact on investors' forecasting behaviour. The effectsof volatility on the market level have been widely researched in the finance literature, but the results have been inconclusive. Some of the studies have suggested a positive relationship between volatility (stockvariance) and stockreturns (Goyaland Santa- Clara, 2003; Malkiel and Xu, 2002); while others have found the opposite. For example, Ang, Hodrik, Xing, and Zhang (2004) demonstrated that stockswith a relatively high past volatility tend to have lowerfuture returns than those with a low past volatility.Granger Causality test is very sensitive forpredicting one variable by employing another variable of time series. The study has employed the Granger Causality Test for discovering the causal relationship between trading volume and stockreturn volatility.The movement in stock market can only be decided, when trading volume and stockreturns will consider simultaneously. The study of both 135 variables was required to find out the transparent map of the movement in the stock
  • 4. Writekraft Research & Publications LLP (All Rights Reserved) Writekraft Research & Publications LLP (Regd. No. AAI-1261) Corporate Office: 67, UGF, Ganges Nagar (SRGP), 365 Hairis Ganj, Tatmill Chauraha, Kanpur, 208004 Phone: 0512-2328181 Mobile: 7753818181, 9838033084 Email: info@writekraft.com Web: www.writekraft.com market. The studyR Rof one indicator always conveysvague information about stock market activity and cannot be used as an information signal. Therefore, studying the causal relationship between stockreturns and trading volume improves the understanding of the microstructure of the stock market. The basic purpose of this relationship study is to provide protection against movement in future, in order to reduce the extent of financial risks. Campbell and Hentschel (1992)theoretically show that if expected future stockreturns increase when volatility increases, then current stockprices (and hence returns) will fall to adjust to this change in future expectations. Thus, an increase to volatility causes negative returns. The volatility feedbackhypothesis relies on the existence of timevarying risk premiums similar to the link between changes in volatility and returns (Poterbaand Summers, 1986). To know the relationship between trading volume and stockreturn volatility in stock markets is very important for investors, brokers, researchers, policy makers and portfoliomanagers for shifting their positions as per the movement of market. It provides guidelines for taking rational investment decisions to meet their expectation level with actual return fromthe securities they hold. Investors, brokers, policy makers and portfoliomanagers willbenefit in modeling and forecasting short-run returns and volatility.The dependence of return on past returns, past volumeand current volume always raises questions regarding investors’ decisions. The dynamic and causal relationship between trading volumeand stock return volatility helps in understanding the future movement of the market. Granger causality test provide the transparent map of causal relationship between trading volume and stockreturn volatility in Indian stock market. Based on the
  • 5. Writekraft Research & Publications LLP (All Rights Reserved) Writekraft Research & Publications LLP (Regd. No. AAI-1261) Corporate Office: 67, UGF, Ganges Nagar (SRGP), 365 Hairis Ganj, Tatmill Chauraha, Kanpur, 208004 Phone: 0512-2328181 Mobile: 7753818181, 9838033084 Email: info@writekraft.com Web: www.writekraft.com probability values reported in Table 3.8, the hypothesis that return does not Granger cause volume can be rejected in sensitive index (SENSEX) as well as S&P CNX Nifty. So, it can be inferred that returns contain significant information forvolume. But the hypothesis that volume does not Granger cause return can be rejected only in sensitive index (SENSEX).Thus, it appears in S&P CNX Nifty that causality runs one way but not other way. However,bi-directional causality does not exist. But in sensitive index (SENSEX)causality runs in both directions such as return causes volumeand volume causes return. Therefore,bi-directional causality exists in sensitive index (SENSEX). 136 The hypothesis that previo 137 Correlation values in respect of sensitive Index (SENSEX) and S&P CNX Nifty are 0.001 and 0.002, which are positioned at a 1% level of significance. It is found that previous day’s return and current stockreturns are positively correlated and strongly supporting of one another. From this result it can be inferred that the indices do not vary significantly while making strategies regarding previous day’s return and current stockreturns. The significance correlation between previous day’s return and current stockreturns is higher than the results of the correlation between previous day’s trading volume and current stockreturns. Correlation values in respect of sensitive Index (SENSEX)and S&P CNX Nifty are 0.012 and 0.018, whichare insignificant at a 5% level of significance. It is found that previous day’s returns and current trading volume are in an insignificant positive correlation. The correlation between previous day returns and current trading volumes is lesser than the results of the correlation between previous day returns and current stock returns. Previousday’s trading volume and
  • 6. Writekraft Research & Publications LLP (All Rights Reserved) Writekraft Research & Publications LLP (Regd. No. AAI-1261) Corporate Office: 67, UGF, Ganges Nagar (SRGP), 365 Hairis Ganj, Tatmill Chauraha, Kanpur, 208004 Phone: 0512-2328181 Mobile: 7753818181, 9838033084 Email: info@writekraft.com Web: www.writekraft.com current trading volumes are in a significant positive correlation. From this result it can be inferred that the indices do not vary significantly while making strategies regarding previous day’s trading volume and current trading volume. Thus the strategies regarding previous day’s trading volume and current trading volume for these stock indices should be the same. Correlation results provide the degree of linear relationship between two or more variables, but it does not tell anything about the cause-effectrelationship between them. Correlation results have found that an asymmetric relationship exists between trading volume and stockreturn whichmeans that the change in one indicator does not have an equal impact on the other variable. Third Research Objective To find out seasonality effectson trading volume and stockmarket returns. This objective analyzed the pattern of volatility in the Indian stock market during April 1, 2002 to March 31, 2012 in terms of its time varying nature, presence of certain characteristics such as volatility clustering and ‘calendar month effect,’and whether there exists any conditional volatility in the Indian stockmarket. The estimation of volatility is made at the macro level on two major market indices, namely, S&P CNX Nifty and Sensitive Index (SENSEX).Volatility always creates challenging environment in front of investors, policy makers, brokers, portfoliomanagers, etc. 138 because almost every interesting financial decision revolvesaround the volatility in the capital market. Investors alwayshave some expectation fromtheir investment decision and wish to fill up the gap between expectations and actual return from the securities they hold. They want to increase return with an expected level of risk. Risk is always
  • 7. Writekraft Research & Publications LLP (All Rights Reserved) Writekraft Research & Publications LLP (Regd. No. AAI-1261) Corporate Office: 67, UGF, Ganges Nagar (SRGP), 365 Hairis Ganj, Tatmill Chauraha, Kanpur, 208004 Phone: 0512-2328181 Mobile: 7753818181, 9838033084 Email: info@writekraft.com Web: www.writekraft.com associated with return. Investors seeking to avoidrisk, forexample, may choose to adjust their portfolios by reducing their commitments to assets whose volatilities are predicted to increase or by using more sophisticated dynamic diversification approaches to predicted hedge volatility increase. The arrival of new information always causes volatility in the stock market. If the volatility is high, risk tends to go high. Volatility shows risk in returns. All investors are heterogeneous in their nature and always take position as per their interpretations. When all investors observe similar kinds of signal, good or bad, trading volume relatively tends to go low because all investors have similar perceptions about the trading volume of the stock.Whenever information is positive then stockprice will have upward movement and vice-versa. Therefore,analyzing volatility is essential to knowing the seasonal and conditional movement in stock return. The objective achievement of an investor thus depends upon the rationality behind stock market volatility.Therefore, in order to grow, succeed and survive in this dynamic environment, investors develop a certain basis regarding volatility whichthey must choose fortaking rational investment decisions. This contributes to the body of knowledge by providing a holistic treatment to the subject of stockmarket volatility in India and providing evidence on its main characteristic features withthe help of econometric techniques and employing GARCH models. In S&P CNX Nifty returns, it is found that there is a negative mean in case of January and October.In the other months namely February, March, April, May June, July, August, September, November and December a negative mean is not present. Therefore, this shows that negative returns are always associated withhigh volatility. Moreover, high volatility is the indication of negative return. Standard deviation shows
  • 8. Writekraft Research & Publications LLP (All Rights Reserved) Writekraft Research & Publications LLP (Regd. No. AAI-1261) Corporate Office: 67, UGF, Ganges Nagar (SRGP), 365 Hairis Ganj, Tatmill Chauraha, Kanpur, 208004 Phone: 0512-2328181 Mobile: 7753818181, 9838033084 Email: info@writekraft.com Web: www.writekraft.com more volatility in case of Octoberand January. It shows the deviations fromthe mean values. Therefore, these twomonths are highly volatile, whichis indicated by the results of standard deviation. It highlights that festival and new years’ always have impact on stock market. In S&P CNX Nifty volume,it is found that there is high volume in case of January and Octoberwhichagain highlights the effectof New Year 139 and Diwaliand for the remaining ten months volume does not produce any significant difference. From both the indices it appears that the months of January and Octoberhave the highest volatility in the period under study. Therefore, the results suggest that the volatility in the Indian stockmarket exhibits the persistence of volatility and mean revolving behaviour. Moreover,the study reveals that much of the movement in stock market return volatility is explained by descriptive statistics. In general, volatility seems to be of a persistent nature. Fourth Research Objective To analyze investors’ perceptions on the relationship between trading volume and stockreturn volatility. The analysis of trading volumeand stock return volatility relationship in Indian stock market is only one aspect of study. To know the investors, brokers, policy makers and portfoliomanagers’ perception on the volatility in the stock market is considered to be an important part towards meeting the gap between their expectation and the actual position on the market. The present study carried out a survey to gather the opinion of investors, brokers, portfoliomanagers, financial experts on the relationship between trading volume and stockreturn volatility in India. For this a sensitive questionnaire
  • 9. Writekraft Research & Publications LLP (All Rights Reserved) Writekraft Research & Publications LLP (Regd. No. AAI-1261) Corporate Office: 67, UGF, Ganges Nagar (SRGP), 365 Hairis Ganj, Tatmill Chauraha, Kanpur, 208004 Phone: 0512-2328181 Mobile: 7753818181, 9838033084 Email: info@writekraft.com Web: www.writekraft.com was developed. Since study on this subject has never been done using primary data, the present study framed the statements forthe questionnaire from theory and review of empirical studies related to the topic. 993 questionnaires were found fit forthe data analysis, whichleads to a final sample size of 993. To make the current study holistic in nature, data was collectedfrom market participants of all demographic profiles. Factor analysis was used to divide these statements into ten factors.The ten factors whichwere extracted were named as importance of volume and return, perceived information, cause-effectrelationship, anxiety, risk management, projection, anomalies, inclination, 140 similarities or differences in their investors’ perceptions. A total of 993 respondents were divided into fivegroups according to respondents’ age. The age of the respondents ranges from 18 to 81 years old, with 10.5 percent between 18 to 25 years old (n= 104), 25.3 percent between 25 to 35 years old (n=251), 34.1 percent between 35 to 50 years old (n=339), 24.2 percent between 50 to 70 years old (n=240) and 5.9 percent above 70 years old (n=59). This shows that the majority of respondents in the first set are middle-aged. All respondents completely agree that trading volumes and stockreturn have importance while making investment. There is no complete agreement on the tactics they follow formaking strategy regarding financial decisions. It signifies that the respondents of different age groups have diverse views on ‘tactics’ and the perception of respondents of different educational groups is not different to a large extent on “volumeimportance and return”, ‘perceive’, ‘information’, ‘anxiety’, ‘projection’, ‘inclination’, ‘cause-effectrelationship’, ‘anomalies’ and ‘risk management’ dimensions. Therefore, all respondents completely agree that causal
  • 10. Writekraft Research & Publications LLP (All Rights Reserved) Writekraft Research & Publications LLP (Regd. No. AAI-1261) Corporate Office: 67, UGF, Ganges Nagar (SRGP), 365 Hairis Ganj, Tatmill Chauraha, Kanpur, 208004 Phone: 0512-2328181 Mobile: 7753818181, 9838033084 Email: info@writekraft.com Web: www.writekraft.com relationships exist between trading volume and stock return volatility.Moreover,all age groups of respondents agree that causal relationships exist between trading volume and stockreturn volatility but their opinions do not strongly agree on such kind of relationship. Some of the respondents in favourof one way causal relationship exist between trading volume and stockreturn volatility.Rest of them are in favourof bidirectional causal relationship exists between trading volumeand stock return volatility. Education gives knowledge and a knowledgeable person becomes more aware and concerned forthe financial decision they make. Therefore,investors’ perceptions are also influenced by education. The sample was divided into fiveeducational categories on the basis of the pilot study. In the sample, 3.07 percent respondents were educated upto 12P thP standard, 33.9 percent respondents were qualified upto graduation. Post graduate respondents were 45.6 percent and only 15.6 percent were doctorates. After analyzing the respondents’ responses on the basis of education groups, it has been observed that most of the respondents have a graduation or post graduation qualification. There is no complete agreement on three factorswith respect to education, ‘cause-effectrelationship’, ‘risk management’ and ‘anomalies’ and the perception of respondents of different educational groups is not different to a large extent on ‘importance of volume and return’, ‘perceive’, ‘information’, ‘anxiety’, 141 ‘projection’, ‘inclination’ and ‘tactics’ dimensions. Investors have different kinds of perceptions on volume cause returns, return cause volume,previous day volume cause current return, previous day return cause current return. Itshows that the investors’
  • 11. Writekraft Research & Publications LLP (All Rights Reserved) Writekraft Research & Publications LLP (Regd. No. AAI-1261) Corporate Office: 67, UGF, Ganges Nagar (SRGP), 365 Hairis Ganj, Tatmill Chauraha, Kanpur, 208004 Phone: 0512-2328181 Mobile: 7753818181, 9838033084 Email: info@writekraft.com Web: www.writekraft.com education level has an impact on their strategy regarding the causal relationship between trading volume and stockreturn volatility.Perceptions on risk management also differ as per the education level of the investors. Risk plays an important role for getting return. It is directly associated withreturn. It shows that risk management techniques of the investors change as per the change in their education level. Respondents strongly disagree that volatility was also high in festivaland other occasions. The results also indicate that undergraduate respondents think festival and seasons don’t have impact on increasing volatility while other respondents agree with this. Moreover,the study has found that respondents of all education groups agree that trading volume and stockreturn volatility have an importance while making investment decisions. Therefore, volumes and returns are two important indicators forknowing the capital market’s microstructure. Investors’ investment is based on their income. Volume and frequency of earnings influence the investment decision. Therefore, the monthly income of the respondents is a vital component of investor’s demographics. It is recorded and categorized into six groups. 10.5 percent (n=104) respondents earn less than twenty thousand rupees in a month. 12 percent (119) respondents have monthly income between twenty to twenty fivethousands. 10.06 percent (105) earn between twenty fiveto thirty thousand rupees. 15.3 percent (152) earn between thirty to thirty five thousand rupees. 25 percent (248) earn between thirty fiveto forty thousand rupees and remaining 26.7 percent (265) respondents earn more than forty thousand rupees in a month. After analysing the data it was found that respondents do not have the same kind of perception regarding anxiety whereas the rest of the factorsnamely importance of volumeand return, perceive, information, cause-effectrelationship, risk management, projection,
  • 12. Writekraft Research & Publications LLP (All Rights Reserved) Writekraft Research & Publications LLP (Regd. No. AAI-1261) Corporate Office: 67, UGF, Ganges Nagar (SRGP), 365 Hairis Ganj, Tatmill Chauraha, Kanpur, 208004 Phone: 0512-2328181 Mobile: 7753818181, 9838033084 Email: info@writekraft.com Web: www.writekraft.com anomalies, inclination and tactics do not show any significant differencein their perception. So foronly one dimension namely anxiety, income is contributing significant variation among investors perception whereas there is no difference in the opinion of investors regarding trading volume and stockreturn volatility relationship. Moreover, the study has found that investors whohave low incomes feel unsure and are 142 worried and anxious about investment decisions. They have unstable preferences while making investment decisions. Occupationis an important determinant foranalysis. Investor perceptions on trading volume and stockreturn volatility is also affectedby their occupation. Majority (39.4%) of respondents are in private services followedby the respondents who were in government services (25.9%), 24.6 percent were found engaged in any business activity or profession and 3.6 percent were found associated with agriculture and remaining (6.5%) categorized as any other whowere either students or housewives. Scrutinizing the results fromthe perspective of respondents’ occupation revealed that investors’ occupationdoes not bring any change in their opinion on volume and return, perceive, cause-effectrelationship, anxiety, risk management, projection, anomalies and tactics importance. It highlights that respondents of all occupationalgroups agree that trading volume and stockreturn volatility is important while making investment decisions. Moreover, they all have the same kind of opinion regarding cause-effectrelationships. Respondents disagreed regarding information and inclination. The study also revealed that it includes only business men and farmers whohave different opinions; else the combinations of other occupational groups were not noticeably different from each other.
  • 13. Writekraft Research & Publications LLP (All Rights Reserved) Writekraft Research & Publications LLP (Regd. No. AAI-1261) Corporate Office: 67, UGF, Ganges Nagar (SRGP), 365 Hairis Ganj, Tatmill Chauraha, Kanpur, 208004 Phone: 0512-2328181 Mobile: 7753818181, 9838033084 Email: info@writekraft.com Web: www.writekraft.com Investors’ experience plays an important role in taking rational investment decisions. Therefore, the respondents’ responses vary as per their experience. The experience of participants ranges from 0 to 56 years, with 29.2 percent between 0 to 05 years (n= 290), 46.2 percent between 05 to 10 years (n=459), 16.9 percent between 10 to 15 years (n=168) and 7.7 percent above 20 years (n=76). There is no complete agreement in case of anxiety and perceive and for the remaining eight factors age does not produces any difference in the opinion of the investors regarding trading volume and stockreturn volatility.Moreover, the study has found that highly experienced investors don’t fear while investing funds into the market. Therefore, they are fully confidentabout their investment decisions. In investment objective,20.3 percent (n=202) want safety of principal, whereas 26.1 percent (n= 259) participants want to generate income. There are 25.4 percent participants (n=252) want to accomplish particular investment goal, whereas 23.2 percent participants (n=65) want growth. There are 5.5 percent (n=50) participants have any other objective.After examining the data it was foundthat investors’ investment 143 objectivedoes not bring any change in their opinion on the importance of volumeand return, perceive, information, cause-effectrelationship, projection, anomalies, inclination and tactics. This highlights that all respondents completely agree that trading volume and stockreturn volatility are important while making investment decisions. Moreover,they all have same kind of opinion regarding the casual relationship between trading volumeand stock return volatility.Respondents have different kinds of perception regarding anxiety and risk management. The natural demographic balance of male and female is reflected in the sample with
  • 14. Writekraft Research & Publications LLP (All Rights Reserved) Writekraft Research & Publications LLP (Regd. No. AAI-1261) Corporate Office: 67, UGF, Ganges Nagar (SRGP), 365 Hairis Ganj, Tatmill Chauraha, Kanpur, 208004 Phone: 0512-2328181 Mobile: 7753818181, 9838033084 Email: info@writekraft.com Web: www.writekraft.com 73.9 per cent male (n=734) and 26.1 per cent female (n=259). After examining the data it was found that male and female opinion on the dimension anxiety differs. Gender does not bring any significant difference regarding the remaining dimensions namely importance of volume and return, perceive, information, cause-effectrelationship, risk management, projection, anomalies, inclination and tactics. In case of respondents’ residence statuses, it was found that urban and rural respondents opinions have significant variation forthe information and inclination dimensions but when it comes to the remaining dimensions investors’ responses do not have any significant variation. It was found that there is no variation in the respondents’ responses on the basis of their marital status. Regression results exemplified that information is the most important dimension while making decisions on trading volume and stock return volatility importance, followedby risk management, perceive, anxiety, projection, anomalies and inclination. All above dimensions influence investors’ perceptions on trading volume and stockreturn volatility importance. Therefore,the importance of trading volume and stock return is associated with risk management, anxiety, anomalies, etc. Risk management is the most important aspect whichinfluences investors’ perceptions on the cause-effectrelationship, followedby projection and tactics. Negative coefficientsforinformation show that investors’ decisions are affectedby information. Negative coefficientsfor anxiety show that when investors have low anxiety then they will perceive casual relationship. Moreover, when investors have high anxiety then they will not show interest in the casual relationship. Therefore, when investors’ don’t have a stable mind then it is negatively affectinginvestors’ perceptions on the causal relationship between trading volumeand stock return. So results show that risk, tactics,
  • 15. Writekraft Research & Publications LLP (All Rights Reserved) Writekraft Research & Publications LLP (Regd. No. AAI-1261) Corporate Office: 67, UGF, Ganges Nagar (SRGP), 365 Hairis Ganj, Tatmill Chauraha, Kanpur, 208004 Phone: 0512-2328181 Mobile: 7753818181, 9838033084 Email: info@writekraft.com Web: www.writekraft.com projections and information will exhibits higher impact on cause-effectrelationships 144 between trading volume and stockreturn volatility i.e., that investors willexhibits higher tendency towards a cause-effectrelationship. 6.3 Suggestions After completing all the analysis and highlighting the major results that are emerging out of the study, this current section strives to suggest some innovations on the basis of the study’s findings for making the bridge between their perceptions and actual relationship exist between trading volume and stockreturn volatility in Indian stock market. These innovations are made on the basis of the identified difference between investors’ opinion and the actual relationship whichexists between trading volumeand stockreturn volatility. The result is summarized in the form of suggestions as under: 1. Investors, brokers, portfoliomanagers should acceptand adopt some strategies for making investment decision in order to achieve maximum return at expected level of risk from the securities held by them. The field of trading volume and stock return volatility is universal and has to be adopted by all kind of investors irrespective of their size, experience, income, etc. The relevance of trading volume and stockreturn volatility should not be ignored as it is the only way through which an investor can grow, succeed and survive in this dynamic environment. Investors, brokers, portfolio managers must understand trading volume and stockreturn volatility is not just for investment, on the contrary, it is a way of getting speculative profit from their investment. Speculative profit means which weget in short run due to volatility in stock market.
  • 16. Writekraft Research & Publications LLP (All Rights Reserved) Writekraft Research & Publications LLP (Regd. No. AAI-1261) Corporate Office: 67, UGF, Ganges Nagar (SRGP), 365 Hairis Ganj, Tatmill Chauraha, Kanpur, 208004 Phone: 0512-2328181 Mobile: 7753818181, 9838033084 Email: info@writekraft.com Web: www.writekraft.com 2. There is no causal relationship exists between previous day’s volume to current return and previous day’s return to current volume. A causal relationship exists between previous day’s return to current return. Moreover,a causal relationship exists between current returns to current volume but the relationship does not exist between current volumes to current returns. Therefore, returns contain significant information for volume but volume does not contain significant information for return. So it is suggested that investors, brokers and portfoliomanagers may use current return for predicting current volumeand previous day’s return forpredicting current return. Therefore, current return and current volume may be predicted only through aforementioned indicators. They should not follow other indicators for 145 predicting the current return and current volume because there is no causal relationship exists among them. 3. All respondents completely agree that trading volumes and stock return both have importance while making investment decisions. The perceptions of respondents of different groups are not differentto a large extent regarding the importance of trading volume and stockreturn volatility,and a causal relationship exists between trading volume and stockreturn volatility.Moreover, all groups of respondents agree that a causal relationship exists between trading volume and stockreturn volatility but their opinions do not strongly agree on such kind of relationship. Mean of current return always cause current volumeand current volume always cause current returns is 3.15. Mean of previous day’s volume alwayscause current return is 3.04 and in case of previous day’s return alwayscause current volume is 3.38. It indicates that market participants give more importance to previous day’s
  • 17. Writekraft Research & Publications LLP (All Rights Reserved) Writekraft Research & Publications LLP (Regd. No. AAI-1261) Corporate Office: 67, UGF, Ganges Nagar (SRGP), 365 Hairis Ganj, Tatmill Chauraha, Kanpur, 208004 Phone: 0512-2328181 Mobile: 7753818181, 9838033084 Email: info@writekraft.com Web: www.writekraft.com return and less importance to previous day’s volume. They have the same opinion on the causal relationship between current return and current volume. Therefore,it shows that investors, brokers and portfoliomanagers have equal perceptions towards the aforementioned relationship but actually this does not exist. Therefore, it can be concludedthat investors should change their perceptions forgetting high return with expected level of risk. They should follow different kind of strategies for differentinvestment decisions. They should use return and previous day’s return for predicting current volumeand current return. Therefore, the gap exist between the actual relationship exist between trading volume and stockreturn volatility and their perceptions towards trading volume and stockreturn volatility.They should try to make a bridge between their perceptions and the actual relationship existing between trading volume and stockreturn volatility.Therefore, they can achieve expected levels of return with the minimum risk. 4. All kind of investors give importance to trading volume and stock return volatility for taking rational investment decisions but they do not follow the right directions. So it is suggested that investors should conducta comprehensive analysis in order to have a true picture of the complex environment. 5. The seasonality aspect of stock market cannot be ignored. There was a negative mean in case of January and October.The other months namely February, March, April, May June, July,August, September, November and December do not show negative returns. Therefore, it shows that negative return is always associated with 146 high volatility.Moreover,high volatility is the indication of negative return. Standard deviation shows more volatility in case of October and January. It shows
  • 18. Writekraft Research & Publications LLP (All Rights Reserved) Writekraft Research & Publications LLP (Regd. No. AAI-1261) Corporate Office: 67, UGF, Ganges Nagar (SRGP), 365 Hairis Ganj, Tatmill Chauraha, Kanpur, 208004 Phone: 0512-2328181 Mobile: 7753818181, 9838033084 Email: info@writekraft.com Web: www.writekraft.com the deviations from the mean values. Therefore, these two months are highly volatile, indicated by the results of standard deviation. This highlights that festivals and new years’ always have impact on the stockmarket. In S&P CNX Nifty volume, it is found that there is high volume in case of January and Octoberwhich again highlights the effectof New Year and Diwaliand for the remaining ten months volume does not produce any significant difference. Therefore,it is suggested that investors should consider month of the year volatility in the stock market. They should be more aware in January and Octoberwhile making investment decision. 6. From both indices it appears that the months of January and Octoberhave the highest volatility in the period under study. Therefore, the results suggest that the volatility in the Indian stockmarket exhibits the persistence of volatility and mean revolving behaviour. Moreover,the study reveals that much of the movement in stockmarket return volatility is explained by the descriptive statistics. In general, volatility seems to be of a persistent nature. Investors should be aware about all kinds of volatility whichexists in stock market. They should analyze their investment objectivefor the purpose of achieving objectiveswith expected level of risk. 7. Trading volume and stockreturn volatility are the twomajor pillars of the stock market through whichinvestors can understand the whole structure of the capital market. The investors must understand that it is not enough to blindly follow an investment decision making process. Investors should also keep a checkon real time changes in situation like festivals, new years, recession, etc. whichnormally finds many of the investors unprepared. Also, investors should workto improve
  • 19. Writekraft Research & Publications LLP (All Rights Reserved) Writekraft Research & Publications LLP (Regd. No. AAI-1261) Corporate Office: 67, UGF, Ganges Nagar (SRGP), 365 Hairis Ganj, Tatmill Chauraha, Kanpur, 208004 Phone: 0512-2328181 Mobile: 7753818181, 9838033084 Email: info@writekraft.com Web: www.writekraft.com their understanding of the model on trading volume and stock return volatility. They should not follow the direction of others. 8. Success of an investor is dependent upon the understanding of trading volume and stockreturn volatility.Investors should incorporate a strong base when they make an investment decision. Strategies may be followedby all kinds of investors with the view of creating a bridge between their expected return and actual return from the securities they hold. Overall the concept of trading volume and stock return volatility should be incorporated while making investment decisions. 147 9. Undoubtedly, investors are most responsible for the success and failure to achieve the investment objective.Investors may be individual or institutional, brokers, portfoliomanagers, and should be clearly aware of their investment objective. They should also consider the expected levelof risk which they expect fromtheir investment. They should also consider the changing requirement of their investment. A willingness and eagerness to consider new information, new viewpoints, new ideas and new possibilities are essential. Another area of concern is essential, whichshould be considered at the time of investment. Eachlevel of investment should be well-cleared about investment objectives,direction of investment and progress toward achieving one’s objective. 10. The investor should avoid ‘All Strategies forAll kind of Investment Decisions’. Investors may avoid making the critical mistake of going fortoo many investment strategies at a given point of time. Keeping in view the long-term success, investors should read news papers and try to keep as informed as possible. Most individual investors still believe that they only have to do what is required in order to achieve
  • 20. Writekraft Research & Publications LLP (All Rights Reserved) Writekraft Research & Publications LLP (Regd. No. AAI-1261) Corporate Office: 67, UGF, Ganges Nagar (SRGP), 365 Hairis Ganj, Tatmill Chauraha, Kanpur, 208004 Phone: 0512-2328181 Mobile: 7753818181, 9838033084 Email: info@writekraft.com Web: www.writekraft.com their objectives.All possible investment outcomes have to be understood return at the expected level of risk has to be increased. 11. Although the present study highlights only trading volume and stockreturn volatility,there are lots of other indicators that require investor attention. Investors may consider the viewsof financial experts whoare posing challenges to the Indian stockmarket. Investors should give stress on previously ignored issues regarding trading volume and stockreturn volatility.Investors are realizing that it is foolish to blindly follow others. Understanding the changing investment issues may help the investors in taking better decisions. 12. Understanding volatility in stockreturn and its relationship with trading volume is the foundation of every successful investor. Investors should understand the actual volatility in asset return series and its relationship with trading volume. Moreover, investors should also analyze their business environment comprehensively. Although the investors are aware of external and internal factorsaffecting investment decisions, more focusis given to limited external and internal factors. Therefore, it is suggested that investors may conducta comprehensive investment situational diagnosis in order to have a true picture of the complex environment. So investors, especially individual investor should consider trading volume and stock return volatility seriously and ensure that they strongly follow it. 148 13. For effectiveinvestment, investors in the capital market should be more focused on investment objective.Retail investors are more active in investing their fund into the market as compared to institutional investors and proprietary investors. However,they are governed by emotions and evaluate returns using shorter and
  • 21. Writekraft Research & Publications LLP (All Rights Reserved) Writekraft Research & Publications LLP (Regd. No. AAI-1261) Corporate Office: 67, UGF, Ganges Nagar (SRGP), 365 Hairis Ganj, Tatmill Chauraha, Kanpur, 208004 Phone: 0512-2328181 Mobile: 7753818181, 9838033084 Email: info@writekraft.com Web: www.writekraft.com shorter intervals without any policy statement (Benos, 1998; Odean, 1998; Wang, 2001). Most of these investors lack knowledge and take the advice of financial advisors and lose money in the process. It is, therefore, suggested that they should try to identify the gap between their perceptions’ on trading volume and stock return volatility,and the actual relationship that exists between trading volume and stockreturn volatility.The majority of Indian retail investors lost money due to their investment in stockmarket. As a result, they have again started shifting to safer avenues of savings in banks whichhas further increased the dominance of banks in India. Returns of retail investors are the key to the Indian stock market’s development. The investors need long term capital gains to invest in the markets. A lot of efforts are required to instill the trust and confidencein them so as to ensure the well functioning of the markets. Our survey also supports this view. 14. Trading strategies of individual investors should be differentfrom those of institutional investors foraccomplishing the objectiveof investment. Individual investors are necessary to test many important theories, more attention needs to be devoted to developing appropriate methods of studying them. 6.4 Concluding Remarks Based on the findings, the study concludes that a significant one way relationship exists between trading volume and stockreturn volatility.Overall, trading volume and stock return volatility indicators play an important role while making investment decision. With the help of these two indicators we may know the transparent map of the capital market. But there is a gap that exists between the actual relationship between trading volume and stockreturn volatility and the perceptions of investors on such kind of relationship. Second aspect is the seasonality effectthat should be considered while
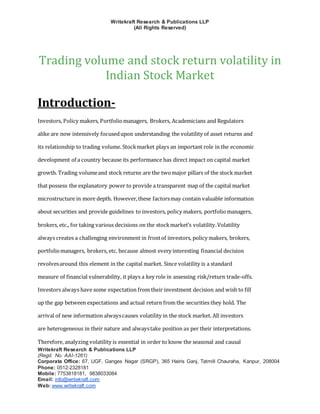
  • 22. Writekraft Research & Publications LLP (All Rights Reserved) Writekraft Research & Publications LLP (Regd. No. AAI-1261) Corporate Office: 67, UGF, Ganges Nagar (SRGP), 365 Hairis Ganj, Tatmill Chauraha, Kanpur, 208004 Phone: 0512-2328181 Mobile: 7753818181, 9838033084 Email: info@writekraft.com Web: www.writekraft.com making an investment decision. Investors should try to estimate the volatility in January and October. 149 Figure 6.1 Investors’ perceptions on trading volume and stock return volatility and the actual relationship existing between trading volume and stock return volatility. 6.5 Research Implication Given the anticipated high growth of the economy and increasing interest of foreign investors towards the country,it is important to understand the pattern of stock market volatility in India whichis time-varying, persistent, and predictable. This may helps in diversify international portfolios and formulate hedging strategies. Investors, Policy makers, Portfoliomanagers, Brokers, Academicians and Regulators alike are now intensively focused upon understanding the volatility of asset returns and its relationship to trading volume. The various GARCH models provide good forecasts of volatility and are useful forportfolio allocation,performance measurement, option Relationship between Trading Volume and Stock Return Volatility in Indian StockMarket Gap exist between actual relationship and Investors’ Perceptions on Trading Volume and Stock Return Volatility in Indian StockMarket Investors’ Perceptions on Trading Volume and Stock Return Volatility in Indian Stock Market Increase Investors understanding on the relationship between Trading Volume and Stock Return Volatility in Indian Stock Market Returns contain significant information for Volume but Volume does not contain significant information forReturn January and Octobermonths are highly volatile and have negative Returns Increase Profitsat expected level of Risk 150 valuation, etc. It has been observed that a more serious view is taken at the time of investment in comparison to subsequent phases. Retail investors are the biggest part of investors when talking about national development. Investment strategies are adopted
  • 23. Writekraft Research & Publications LLP (All Rights Reserved) Writekraft Research & Publications LLP (Regd. No. AAI-1261) Corporate Office: 67, UGF, Ganges Nagar (SRGP), 365 Hairis Ganj, Tatmill Chauraha, Kanpur, 208004 Phone: 0512-2328181 Mobile: 7753818181, 9838033084 Email: info@writekraft.com Web: www.writekraft.com to a great extent but in several cases it is observed that the desired returns are not achieved due to volatility in the market. There is a need to improve investment decision making at all phases of investment for enhancing effectivereturns. The effectivenessof an investor’s decision can further improve if the investor increases the level of focus and understanding on the relationship between trading volume and stockreturn volatility. The comparison of investors’ perceptions on trading volume and stock return volatility, and actual relationship exists between trading volumeand stock return volatility is necessary for taking rational investment decisions. There is a gap between investors’ perceptions and the actual relationship existing between trading volume and stock return volatility.Investors lack knowledgeand awareness on the relationship between trading volume and stockreturn volatility.They are trading as speculators where they more often lose money than gain. The returns can be estimated by volume but due to the lack of proper education, awareness and knowledge of the relationship between trading volume and stockreturn volatility,the desired volumes resulting into profitable activity is yet to occur.It is, therefore, suggested that investors should have knowledge on the relationship between trading volume and stockreturn volatility for accomplishing their desired objectives. Our study also provides concreteevidence on volume-return relationship in Indian market. An aware investor will be better equipped to take risk and benefit fromparticipating in the stock market. Although our government is spending vast sums of money on research in financial markets, retail investors do not understand complex models that the researches talk about. Research in the field of investor education should be promoted. This will also help in increasing the investor base in India whichis currently minimal compared to
  • 24. Writekraft Research & Publications LLP (All Rights Reserved) Writekraft Research & Publications LLP (Regd. No. AAI-1261) Corporate Office: 67, UGF, Ganges Nagar (SRGP), 365 Hairis Ganj, Tatmill Chauraha, Kanpur, 208004 Phone: 0512-2328181 Mobile: 7753818181, 9838033084 Email: info@writekraft.com Web: www.writekraft.com develop countries. As mentioned earlier, our study gives evidence of trading volume and stockreturn volatility in the Indian stockmarket. Investors can take better advantage after knowing the actual relationship that exists between trading volume and stockreturn volatility. 151 6.6 Limitations of the Study The study has concentrated on trading volume and stockreturn volatility in Indian stockmarket along withinvestors’ perceptions on trading volume and stockreturn volatility. Second, S&P CNX Nifty and Sensitive Index (SENSEX) are considered as representative indexes of the Indian stock market because the turnover of National StockExchange is higher as compared to other stockexchange markets. Moreover Bombay StockExchange is the premier stockexchange of India. The study does not coverindividual stocksdue to it becoming unwieldy and requiring much more time. Further, index being aggregative and representative in its nature, the usefulness of the study does not get much affectedby not taking individual stocks into consideration. Third, primary data was collected through a structured questionnaire given to the investors, brokers, policy makers and portfoliomanagers involvedin the study. The researcher had an intention to reach a larger sample but paucity of time, the attitude of investors, brokers, policy makers and portfoliomanagers fromthe capital market towards research resulted in limiting the size of sample to the present one. As the study is also based upon primary data, the possibility of personal bias of the respondents cannot be ruled out. Fourth, the study uses only daily data and does not use high frequency data. The study
  • 25. Writekraft Research & Publications LLP (All Rights Reserved) Writekraft Research & Publications LLP (Regd. No. AAI-1261) Corporate Office: 67, UGF, Ganges Nagar (SRGP), 365 Hairis Ganj, Tatmill Chauraha, Kanpur, 208004 Phone: 0512-2328181 Mobile: 7753818181, 9838033084 Email: info@writekraft.com Web: www.writekraft.com undertaken, however,unique as no comprehensive study of this nature coveringsuch a long period making a detailed analysis seems to have been undertaken by any other research scholar. 6.7 Agenda forFuture Research In India, the status of research in the trading volume and stock return field is still at its nascent stage. It is also felt that foreign researchers have made maximum contribution to the field of trading volume and stockreturn volatility,whereas in India, there is ample scope for further research. The present study has mainly explored the relationship between trading volumeand stock return volatility along with investors’ perceptions on such relationship issues between these variables in depth. The modelling effortin the present study is mainly exploratory, revealing many possible extensions for future research. The areas for further research include, forexample, the following: 152 1. The study has analyzed the relationship between trading volume and stock return volatility by taking S&P CNX Nifty and Sensitive Index (SENSEX) as proxy forthe market. The relationship study can further be evaluated on various sectors by using sectoral indices. One study can be carried out to examine the election affecton the volatility of the stock market. Moreover, the volatility relationship can be examined with political changes. Volatility was very high in May, 2014 during the election of Lok Sabha in India. 2. This empirical research can be further expanded by selecting and analyzing high frequency intra-day data and inclusion of additional economic variables in the GARCH conditional variance equation. Multivariate GARCH can also be employed for this purpose.
  • 26. Writekraft Research & Publications LLP (All Rights Reserved) Writekraft Research & Publications LLP (Regd. No. AAI-1261) Corporate Office: 67, UGF, Ganges Nagar (SRGP), 365 Hairis Ganj, Tatmill Chauraha, Kanpur, 208004 Phone: 0512-2328181 Mobile: 7753818181, 9838033084 Email: info@writekraft.com Web: www.writekraft.com 3. Trading hours, in India should be increased to facilitate alignment of Indian market with international market forbetter assimilation of any economic development in the global market. For example, a longer market is necessary to know the status of market demands for new global products, export of Indian products by foreign exchanges, easing of foreign investment by RBI, etc. The extension of trade timings willnot only increase cross-country trade but will also reduce end of the day volatility,i.e., volatility generated after the closing of markets in India and their opening on the next day,on accountof foreign markets that are open during this time. Further research can be carried out to find a suitable extension of these timings. 4. A comparative study can be carried out between the Indian and international stockmarkets. Research can also be carried out to identify the investors’ perceptions at an international level. Through the present study, an attempt has been made to provide a direction, which may be followedto reach new milestone in trading volume and stock return volatility.
  • 27. Writekraft Research & Publications LLP (All Rights Reserved) Writekraft Research & Publications LLP (Regd. No. AAI-1261) Corporate Office: 67, UGF, Ganges Nagar (SRGP), 365 Hairis Ganj, Tatmill Chauraha, Kanpur, 208004 Phone: 0512-2328181 Mobile: 7753818181, 9838033084 Email: info@writekraft.com Web: www.writekraft.com 5.1 CONCLUSION Investors always have expectation of some positive rate of return. They always try to accomplish the higher return with lower risk. Therefore, to achieve this objective they observe market continuously. Based on their perception they carefully plan, evaluate and allocate funds in various investible instruments, which offer safety of principal and continuous return. Investment in equity shares is one of the avenues which offer greater benefits, along with higher risks (Bharathi, 2009). Investors’ perception is defined as the process by which an investor selects, organizes, and interprets market data into meaningful information. Two investors if exposed to the same stock market under the same apparent condition, but how each person recognizes, selects, organizes, and interprets these market is a highly individual process base on each person’s own needs, experience, and expectations. To know the influence that each of these variables on the investment decision is very important for every investor. However, we will examine some of the basic concepts that highlight the perceptual process in context of investor behaviour. Investors act and react on the basis of their perceptions, not on the basis of objective reality. For each investor, reality is a totally personal phenomenon, based on that person’s needs, wants and personal experiences. Thus, investors’ perceptions are much more important than their knowledge of objective reality. For if one thinks about it, it’s not what actually so is, but what investors think is so, that affects their actions, their investment, their reinvestment and so forth and because investor make decision and take actions based on what they perceive to be reality, it is important to understand the whole notion of perception and its related concepts to more readily determine what factors influence investors’ investment decision.
  • 28. Writekraft Research & Publications LLP (All Rights Reserved) Writekraft Research & Publications LLP (Regd. No. AAI-1261) Corporate Office: 67, UGF, Ganges Nagar (SRGP), 365 Hairis Ganj, Tatmill Chauraha, Kanpur, 208004 Phone: 0512-2328181 Mobile: 7753818181, 9838033084 Email: info@writekraft.com Web: www.writekraft.com Poterba and Summers (1986) and Campbell and Hentschel (1992) present the volatility feedback hypothesis, where any innovations to volatility (especially positive ones) lead to a decrease in returns. The leverage hypothesis has few supporters (see e.g. Low, 2004), while the volatility feedback hypothesis involves a complicated economic process that passes through expectations and dividends to validate the negative relationship and only (weakly) explains the long term return–volatility relationship. 85
  • 29. Writekraft Research & Publications LLP (All Rights Reserved) Writekraft Research & Publications LLP (Regd. No. AAI-1261) Corporate Office: 67, UGF, Ganges Nagar (SRGP), 365 Hairis Ganj, Tatmill Chauraha, Kanpur, 208004 Phone: 0512-2328181 Mobile: 7753818181, 9838033084 Email: info@writekraft.com Web: www.writekraft.com 5.2 Methodologyand Results 5.2.1 Sampling and Data Collection The study was conducted using convenience sampling making the overall sampling criteria. Strict statistical sampling cannot be applied in selecting the respondents here as we did not had exhausted list of investors. In such cases, Cadler, Phillips and Tybout (1981) advocated the use of convenience sampling keeping in mind the important dimensions of the market participants. The present study is based on empirical analysis of investors’ perceptions on the relationship between trading volume and stock return volatility. The current study is based on the primary data. The respondents of this study are investors, brokers, portfolio managers, financial experts in India. A total of 1100 questionnaires were distributed in these areas. 993 questionnaire were found fit for the data analysis, which leads to final sample size of 993. To make the current study holistic in nature, data were collected from the market participants of all demographic profiles. 5.2.2 Questionnaire formulation Table 5.1: List of Variables regarding Investors’ Perceptions S. No. Statements V01 I get unsure by the views of financial experts. V02 I am anxious about financial and money affairs. V03 After making a decision, I am anxious whether I was right or wrong. V04 I read the business section of the newspaper attentively. V05 I like to join conversations about financial matters.
  • 30. Writekraft Research & Publications LLP (All Rights Reserved) Writekraft Research & Publications LLP (Regd. No. AAI-1261) Corporate Office: 67, UGF, Ganges Nagar (SRGP), 365 Hairis Ganj, Tatmill Chauraha, Kanpur, 208004 Phone: 0512-2328181 Mobile: 7753818181, 9838033084 Email: info@writekraft.com Web: www.writekraft.com V06 I see the volume when I take decisions about investment. V07 I see the returns when I take decisions about investment. V08 Market participants are aware of all kinds of relationship between trading volume and stock return volatility. V09 Trading volume and stock return volatility help in determining future price. V10 Majority of market participants invest in market to earn quick money. V11 Volume always higher in the month of October. V12 Volumes always lower in the month of March. V13 I see the relationship between trading volume and stock return when I take decisions about investment. V14 Trading volume and stock returns are two major pillars of the stock market which have explanatory power to provide the transparent map of 86
  • 31. Writekraft Research & Publications LLP (All Rights Reserved) Writekraft Research & Publications LLP (Regd. No. AAI-1261) Corporate Office: 67, UGF, Ganges Nagar (SRGP), 365 Hairis Ganj, Tatmill Chauraha, Kanpur, 208004 Phone: 0512-2328181 Mobile: 7753818181, 9838033084 Email: info@writekraft.com Web: www.writekraft.com the microstructure of the capital market. V15 Volatility always creates challenging environment because almost every interesting financial decision revolves around the volatility in the capital market. V16 Arrival of new information always causes the volatility in stock market. V17 Managing risks in the stock market is difficult task because it has movement as per the information flows into the market. V18 It is very important to know the relationship between trading volume and stock return volatility in stock markets for shifting the position as per the movement of market. V19 I have some expectation from my investment decision and wish to fill up the gap between expectations and actual return from the securities. V20 The dependence of return on past returns, past volume and current volume always raise questions for me. V21 I always take position as per my understanding about the market. V22 Analyzing the stock return and trading volume is essential to know the causal relationship between these two indicators. V23 In order to succeed, grow and survive, I have to adopt various strategies regarding trading volume and stock return volatility. V24 A good knowledge of the relationship between trading volume and stock return is necessary for gaining profit in the era of globalization. V25 Current returns always cause current volume. V26 Current volume always causes current returns. V27 Previous day volume always causes current returns.
  • 32. Writekraft Research & Publications LLP (All Rights Reserved) Writekraft Research & Publications LLP (Regd. No. AAI-1261) Corporate Office: 67, UGF, Ganges Nagar (SRGP), 365 Hairis Ganj, Tatmill Chauraha, Kanpur, 208004 Phone: 0512-2328181 Mobile: 7753818181, 9838033084 Email: info@writekraft.com Web: www.writekraft.com V28 Previous day returns always cause current volume. V29 A large positive or large negative return lead future forecasts of the variance. V30 I follow others or depend on the directions of others when I invest my fund into the market. V31 I look at investment prepositions and apply my own judgment while investing. V32 I prefer to invest in domestic market. V33 I dislike ambiguous situations where I feel that I am not in a better position than others to evaluate investment in a given stock. V34 I traded on the basis of superior information about the market but earned lower return. V35 I feel regret when I realize a loss and stock prices rise subsequently. V36 I feel pride when I realize a gain and so sell the winners. V37 I understand that in order to achieve higher returns, it is necessary to take some risk. (Source: Primary Data) 87
  • 33. Writekraft Research & Publications LLP (All Rights Reserved) Writekraft Research & Publications LLP (Regd. No. AAI-1261) Corporate Office: 67, UGF, Ganges Nagar (SRGP), 365 Hairis Ganj, Tatmill Chauraha, Kanpur, 208004 Phone: 0512-2328181 Mobile: 7753818181, 9838033084 Email: info@writekraft.com Web: www.writekraft.com A pool of 41 simple understandable statements relating to investors’ perceptions on the relationship between trading volume and stock return volatility was constructed, so that their response on the same could be measured. These 41 statements were brain stormed and out of these 41 statements 37 were finalized for the current study, which were relating to measure investors’ perceptions on the relationship between trading volume and stock return volatility. Participants were first asked to give their self-assessment by answering 37 questions on their of investors’ perceptions on the relationship between trading volume and stock return volatility shown in Table 5.1. The response format is a five-point-Likert-type scale with “strongly disagree” and “strongly agree” at the two ends of the question spectrum. Only essential variables were kept in the questionnaire and number of items in scale was kept below 50 as asking too much from respondents may give rise to unwillingness or inability of responding. As recommended by Malhotra (2008), sensitive questions like income and demographics were kept in the second part of questionnaire. 5.2.3 Demographic Analysis Table 5.2: Demographic Profile of the Respondents Demographics Frequency Proportion of the sample (%) Gender Male 734 73.9 Female 259 26.1 Total 993 100.0 18-25 104 10.5 25-35 251 25.3
  • 34. Writekraft Research & Publications LLP (All Rights Reserved) Writekraft Research & Publications LLP (Regd. No. AAI-1261) Corporate Office: 67, UGF, Ganges Nagar (SRGP), 365 Hairis Ganj, Tatmill Chauraha, Kanpur, 208004 Phone: 0512-2328181 Mobile: 7753818181, 9838033084 Email: info@writekraft.com Web: www.writekraft.com Age 35-50 339 34.1 50-70 240 24.2 Above 70 59 5.9 Total 993 100.0 Up To 12P th 37 3.7 Education Graduation 337 33.9 P.G. 453 45.6 Doctorate 155 15.6 Any other 11 1.1 Total 993 100.0 88
  • 35. Writekraft Research & Publications LLP (All Rights Reserved) Writekraft Research & Publications LLP (Regd. No. AAI-1261) Corporate Office: 67, UGF, Ganges Nagar (SRGP), 365 Hairis Ganj, Tatmill Chauraha, Kanpur, 208004 Phone: 0512-2328181 Mobile: 7753818181, 9838033084 Email: info@writekraft.com Web: www.writekraft.com 0-20,000 (Rs) Month 20,000-25,000 (Rs) 25,000-30,000 (Rs) Per 30,000-35,000 (Rs) Income 35,000-40,000 (Rs) Above 40,000 Total Govt. Services Occupation Private Services Agriculture Business Any Other Total Residence Urban Total Rural MaritalStatus Married Unmarried Total 0-5 yrs InvestmentExperie nce 5-10 yrs Above 20 yrs 10-15 yrs Total Object ives Safety of the Principal Generate Incom e Achieve Particular Investment Investment Goal Growth Any Other Total (Source: Primary Data)
  • 36. Writekraft Research & Publications LLP (All Rights Reserved) Writekraft Research & Publications LLP (Regd. No. AAI-1261) Corporate Office: 67, UGF, Ganges Nagar (SRGP), 365 Hairis Ganj, Tatmill Chauraha, Kanpur, 208004 Phone: 0512-2328181 Mobile: 7753818181, 9838033084 Email: info@writekraft.com Web: www.writekraft.com 104 10.5 119 12.0 105 10.6 152 15.3 248 25.0 265 26.7 993 100.0 257 25.9 391 39.4 36 3.6 244 24.6 65 6.5 993 100.0 849 85.5 144 14.5 993 100.0 849 85.5 144 14.5 993 100.0 290 29.2 459 46.2 168 16.9 76 7.7 993 100.0 202 20.3 259 26.1 252 25.4 230 23.2 50 5.0 993 100.0 89
  • 37. Writekraft Research & Publications LLP (All Rights Reserved) Writekraft Research & Publications LLP (Regd. No. AAI-1261) Corporate Office: 67, UGF, Ganges Nagar (SRGP), 365 Hairis Ganj, Tatmill Chauraha, Kanpur, 208004 Phone: 0512-2328181 Mobile: 7753818181, 9838033084 Email: info@writekraft.com Web: www.writekraft.com Table 5.2 delineates the demographic profile of the respondents. Total sample size is 993. Age, gender, educational qualification, occupation and monthly household income constitute the demographic profile of the respondents. Demographic profile of respondents was analyzed using frequency distribution. Although not every member of the population is equally likely to be selected, the sample is composed of a wide variety of backgrounds. The diversity came from such groups as participants in a study relating to financial literacy, and from different sources such as a brokers, investors, finance students, a group of finance teachers, etc. Investors’ perceptions changes with according to their age. Therefore, the persons of different age groups depict different kind of perception. Hence, it is of paramount importance to study the perception of different age groups and try to understand the similarities or differences in their investors’ perceptions. The age of participants ranges from 18 to 81 years old, with 10.5 percent between 18 to 25 years old (n= 104), 25.3 percent between 25 to 35 years old (n=251), 34.1 percent between 35 to 50 years old (n=339), 24.2 percent between 50 to 70 years old (n=240) and 5.9 percent above 70 years old (n=59). The natural demographic balance of male and female is reflected in the sample with 73.9 per cent male (n=734) and 26.1 per cent female (n=259). Investors’ perceptions are also influenced by education. Education gives knowledge and a knowledgeable person becomes more aware and concerned for the investment. The sample is divided into five educational categories on the basis of the pilot study. In the sample, 3.07 percent respondents were educated upto 12P th P standard, 33.9 percent respondents were qualified upto graduation. Post graduate respondents were 45.6 percent and doctorates were only 15.6 percent. In investment objective, 20.3 percent (n=202) want safety of principal, whereas 26.1 percent (n= 259) participants want to generate income. There are 25.4 percent participants (n=252) want to accomplish particular investment goal, whereas 23.2
  • 38. Writekraft Research & Publications LLP (All Rights Reserved) Writekraft Research & Publications LLP (Regd. No. AAI-1261) Corporate Office: 67, UGF, Ganges Nagar (SRGP), 365 Hairis Ganj, Tatmill Chauraha, Kanpur, 208004 Phone: 0512-2328181 Mobile: 7753818181, 9838033084 Email: info@writekraft.com Web: www.writekraft.com percent participants (n=65) want growth. There are 5.5 percent (n=50) participants have any other objective. Investors experience play important role for taking rational investment decisions. The experience of participants ranges from 0 to 56 years, with 29.2 percent between 0 to 05 90
  • 39. Writekraft Research & Publications LLP (All Rights Reserved) Writekraft Research & Publications LLP (Regd. No. AAI-1261) Corporate Office: 67, UGF, Ganges Nagar (SRGP), 365 Hairis Ganj, Tatmill Chauraha, Kanpur, 208004 Phone: 0512-2328181 Mobile: 7753818181, 9838033084 Email: info@writekraft.com Web: www.writekraft.com years (n= 290), 46.2 percent between 05 to 10 years (n=459), 16.9 percent between 10 to 15 years (n=168) and 7.7 percent above 20 years (n=76). Occupation is an important determinant for analysis. Investor perception on trading volume and stock return volatility is also affected by their occupation. Majority (39.4%) of respondents are in private services followed by the respondents who were in government services (25.9%), 24.6 percent were found engaged in any business activity or profession and 3.6 percent were found farmers and remaining (6.5%) categorized as any other who were either students or housewives. Investors’ investment is based on their income. Volume and frequency of earnings influence the investment decision. Therefore, the monthly income of the respondents is a vital component of investor’s demographics. It is recorded and categorized into six groups. 10.5 percent (n=104) respondents earn less than twenty thousand rupees in a month. 12 percent (119) respondents have monthly income between twenty to twenty five thousands. 10.06 percent (105) earn between twenty five to thirty thousand rupees. 15.3 percent (152) earn between thirty to thirty five thousand rupees. 25 percent (248) earn between thirty five to forty thousand rupees and remaining 26.7 percent (265) respondents earn more than forty thousand rupees in a month. 5.2.4 Factor Analysis Most practiced index of internal consistency in social sciences researches on multi-item measures, the cronbach’s alpha (Schmitt, 1996) was used to check reliability in present study. To bring down the statements to manageable level of dimensions, factor analysis using principal components method of factor extraction with varimax rotation was used. Besides these techniques, mean, variance, standard deviation was calculated and used at various stages of data analysis. All the 37 statements of questionnaire were subjected to alpha test of reliability; the cronbach’s alpha statistic for 37 statements was showing that scale is reliable.
  • 40. Writekraft Research & Publications LLP (All Rights Reserved) Writekraft Research & Publications LLP (Regd. No. AAI-1261) Corporate Office: 67, UGF, Ganges Nagar (SRGP), 365 Hairis Ganj, Tatmill Chauraha, Kanpur, 208004 Phone: 0512-2328181 Mobile: 7753818181, 9838033084 Email: info@writekraft.com Web: www.writekraft.com Investors’ perceptions on the relationship between trading volume and stock return volatility was assessed through factor analysis. The application of factor analysis resulted in to 10 dimensions concerning investors’ perceptions towards the relationship between trading volume and stock return volatility. Principal component factor analysis with Varimax rotation and Kaiser Normalization resulted into ten factor solution with Eigen value more than 1. These factors explain 63.79 percent of total variance. 91
  • 41. Writekraft Research & Publications LLP (All Rights Reserved) Writekraft Research & Publications LLP (Regd. No. AAI-1261) Corporate Office: 67, UGF, Ganges Nagar (SRGP), 365 Hairis Ganj, Tatmill Chauraha, Kanpur, 208004 Phone: 0512-2328181 Mobile: 7753818181, 9838033084 Email: info@writekraft.com Web: www.writekraft.com The value of KMO measure of sampling adequacy comes out to be 0.828 and Bartlett’s test of sphericity was found to be significant, depicting that factor analysis can be applied on this data. Factor analysis with principal component analysis and varimax rotation was applied to find out the required dimensions. Principal component analysis was used because the dimensions produced by factor analyses were to be further subjected to multivariate analysis. The basis for factors extraction was kept as the eigen value of 1.0 and rotated factor loading of at least 0.30 which is desirable (Costello and Osborne, 2005). Principal component analysis extracted 10 factors explaining approximately 63.79 per cent of variance. Table 5.3: Communalities Statements I get unsure by the views of financial experts. 1.000 .700 I am anxious about financial and money affairs. 1.000 .726 After making a decision, I am anxious whether I was right or wrong. 1.000 .733 I read the business section of the newspaper attentively. 1.000 .580 I like to join conversations about financial matters. 1.000 .627 I see the volume when I take decisions about investment. 1.000 .558 I see the returns when I take decisions about investment. 1.000 .528 Market participants are aware of all kinds of relationship between trading 1.000 .677 volume and stock return volatility. Trading volume and stock return volatility help in determining future price. 1.000 .652
  • 42. Writekraft Research & Publications LLP (All Rights Reserved) Writekraft Research & Publications LLP (Regd. No. AAI-1261) Corporate Office: 67, UGF, Ganges Nagar (SRGP), 365 Hairis Ganj, Tatmill Chauraha, Kanpur, 208004 Phone: 0512-2328181 Mobile: 7753818181, 9838033084 Email: info@writekraft.com Web: www.writekraft.com Majority of market participants invest in market to earn quick money. 1.000 .641 Volume always higher in the month of October. 1.000 .741 Volumes always lower in the month of March. 1.000 .751 I see the relationship between trading volume and stock return when I take 1.000 .615 decisions about investment. Trading volume and stock returns are two major pillars of the stock market which have explanatory power to provide the transparent map of the 1.000 .793 microstructure of the capital market. Volatility always creates challenging environment because almost every 1.000 .662 interesting financial decision revolves around the volatility in the capital market. Arrival of new information always causes the volatility in stock market. 1.000 .573 92
  • 43. Writekraft Research & Publications LLP (All Rights Reserved) Writekraft Research & Publications LLP (Regd. No. AAI-1261) Corporate Office: 67, UGF, Ganges Nagar (SRGP), 365 Hairis Ganj, Tatmill Chauraha, Kanpur, 208004 Phone: 0512-2328181 Mobile: 7753818181, 9838033084 Email: info@writekraft.com Web: www.writekraft.com Managing risks in the stock market is difficult task because it has movement as 1.000 .587 per the information flows into the market. It is very important to know the relationship between trading volume and stock return volatility in stock markets for shifting the position as per the movement of 1.000 .630 market. I have some expectation from my investment decision and wish to fill up the gap 1.000 .539 between expectations and actual return from the securities. The dependence of return on past returns, past volume and current volume 1.000 .587 always raise questions for me. I always take position as per my understanding about the market. 1.000 .622 Analyzing the stock return and trading volume is essential to know the causal 1.000 .604 relationship between these two indicators. In order to succeed, grow and survive, I have to adopt various strategies 1.000 .600 regarding trading volume and stock return volatility. A good knowledge of the relationship between trading volume and stock return 1.000 .673 is necessary for gaining profit in the era of globalization. Current returns always cause current volume. 1.000 .540 Current volume always causes current returns. 1.000 .635 Previous day volume always causes current returns. 1.000 .553 Previous day returns always cause current volume. 1.000 .675
  • 44. Writekraft Research & Publications LLP (All Rights Reserved) Writekraft Research & Publications LLP (Regd. No. AAI-1261) Corporate Office: 67, UGF, Ganges Nagar (SRGP), 365 Hairis Ganj, Tatmill Chauraha, Kanpur, 208004 Phone: 0512-2328181 Mobile: 7753818181, 9838033084 Email: info@writekraft.com Web: www.writekraft.com A large positive or large negative return lead future forecasts of the variance. 1.000 .529 I follow others or depend on the directions of others when I invest my fund into 1.000 .605 the market. I look at investment prepositions and apply my own judgment while investing. 1.000 .672 I prefer to invest in domestic market. 1.000 .555 I dislike ambiguous situations where I feel that I am not in a better position than 1.000 .661 others to evaluate investment in a given stock. I traded on the basis of superior information about the market but earned lower 1.000 .679 return. I feelregret when I realize a loss and stock prices rise subsequently. 1.000 .769 I feelpride when I realize a gain and so sell the winners. 1.000 .659 I understand that in order to achieve higher returns, it is necessary to take some 1.000 .673 risk. (Source: Primary Data) 93
  • 45. Writekraft Research & Publications LLP (All Rights Reserved) Writekraft Research & Publications LLP (Regd. No. AAI-1261) Corporate Office: 67, UGF, Ganges Nagar (SRGP), 365 Hairis Ganj, Tatmill Chauraha, Kanpur, 208004 Phone: 0512-2328181 Mobile: 7753818181, 9838033084 Email: info@writekraft.com Web: www.writekraft.com Table 5.3 shows the communalities before and after extraction. Principal component analysis works on the initial assumption that all variance is common; therefore before extraction the communalities are all ‘1’. The communalities in the column labelled extraction reflect the common variance in the structure. So, from the table of communalities, we can have the first variable (i.e. I get unsure by the views of financial experts) showing the variance of 70%. Another way to look at these communalities is in terms of the proportion of variance explained by the underlying factors. After extraction some of the factors may get discarded and so some information is lost. The amount of variance in each variable that can be explained by the retained factors is represented by the communalities after extraction. Table 5.4: Total Variance of Dimensions Component s Initial Eigenvalues Extraction Sums of Rotation Sums of Squared Loadings Squared Loadings % of Cumulative % of Cumulative % of Cumulative Total Variance % Total Variance % Total Variance % 10.318 27.887 27.887 10.318 27.887 27.887 4.264 11.524 11.524 2 2.177 5.883 33.769 2.177 5.883 33.769 2.546 6.882 18.406 3 2.100 5.675 39.444 2.100 5.675 39.444 2.476 6.692 25.098 4 1.617 4.371 43.816 1.617 4.371 43.816 2.299 6.213 31.311 5 1.398 3.779 47.594 1.398 3.779 47.594 2.255 6.094 37.405 6 1.358 3.670 51.264 1.358 3.670 51.264 2.116 5.719 43.124
  • 46. Writekraft Research & Publications LLP (All Rights Reserved) Writekraft Research & Publications LLP (Regd. No. AAI-1261) Corporate Office: 67, UGF, Ganges Nagar (SRGP), 365 Hairis Ganj, Tatmill Chauraha, Kanpur, 208004 Phone: 0512-2328181 Mobile: 7753818181, 9838033084 Email: info@writekraft.com Web: www.writekraft.com 7 1.257 3.397 54.662 1.257 3.397 54.662 2.043 5.520 48.644 8 1.164 3.147 57.809 1.164 3.147 57.809 1.972 5.331 53.975 9 1.142 3.088 60.896 1.142 3.088 60.896 1.818 4.914 58.890 10 1.071 2.895 63.791 1.071 2.895 63.791 1.813 4.901 63.791 11 .975 2.634 66.425 12 .923 2.496 68.921 13 .899 2.430 71.351 14 .812 2.196 73.547 15 .774 2.092 75.638 16 .725 1.959 77.597 17 .704 1.903 79.500 18 .671 1.814 81.315 19 .637 1.723 83.037 94
  • 47. Writekraft Research & Publications LLP (All Rights Reserved) Writekraft Research & Publications LLP (Regd. No. AAI-1261) Corporate Office: 67, UGF, Ganges Nagar (SRGP), 365 Hairis Ganj, Tatmill Chauraha, Kanpur, 208004 Phone: 0512-2328181 Mobile: 7753818181, 9838033084 Email: info@writekraft.com Web: www.writekraft.com 20 .577 1.558 84.596 21 .562 1.519 86.115 22 .522 1.412 87.527 23 .513 1.387 88.913 24 .430 1.163 90.076 25 .414 1.119 91.195 26 .392 1.060 92.254 27 .368 .994 93.248 28 .356 .962 94.210 29 .335 .906 95.116 30 .323 .872 95.989 31 .308 .832 96.821 32 .254 .686 97.506 33 .239 .647 98.153 34 .216 .584 98.737 35 .180 .487 99.223 36 .173 .468 99.692 37 .114 .308 100.000 Source: Primary Data
  • 48. Writekraft Research & Publications LLP (All Rights Reserved) Writekraft Research & Publications LLP (Regd. No. AAI-1261) Corporate Office: 67, UGF, Ganges Nagar (SRGP), 365 Hairis Ganj, Tatmill Chauraha, Kanpur, 208004 Phone: 0512-2328181 Mobile: 7753818181, 9838033084 Email: info@writekraft.com Web: www.writekraft.com Extraction Method: Principal Component Analysis. Kaiser-Meyer-Olkin Measure of Sampling Adequacy = 0.828 The output in Table 5.4 lists the eigen values associated with each linear variable before extraction and after extraction. Before extraction, SPSS has identified 37 linear components within data set. The eigen values associated with each factor represent the variance explained by that particular linear component and SPSS also displays the eigen value in terms of the percentage of variance explained ( so, factor 1 i.e., Importance of volume and return has 11.52% of total variance). It is clear from the above table that the first few factors explain relatively large amount of variance whereas subsequent factors explain only small amounts of variance. SPSS then extracts all variables with eigen values greater than 1, which leaves us with ten factors. The eigen value associated with these factors are again displayed (and the percentage of variance explained) in the columns labelled extraction sums of squared loading. The values in this part of the table are the same as the values before extraction, except that the values for the discarded factors are ignored (hence, the table is blank after the ten factors). 95
  • 49. Writekraft Research & Publications LLP (All Rights Reserved) Writekraft Research & Publications LLP (Regd. No. AAI-1261) Corporate Office: 67, UGF, Ganges Nagar (SRGP), 365 Hairis Ganj, Tatmill Chauraha, Kanpur, 208004 Phone: 0512-2328181 Mobile: 7753818181, 9838033084 Email: info@writekraft.com Web: www.writekraft.com Table 5.5: Rotated Component Matrix Statements 1 2 3 4 5 6 7 8 9 10 I get unsure by the views of .681 financial experts. I am anxious about financial and .795 money affairs. After making a decision, I am .677anxious whether I was right or wrong. I read the business section of the .308 .383 .486 newspaper attentively. I like to join conversations about .648 financial matters. I see the volume when I take .454 .400 decisions about investment. I see the returns when I take .396 .501 decisions about investment. Market participants are aware of all kinds of relationship between .318 .684 trading volume and stock return
  • 50. Writekraft Research & Publications LLP (All Rights Reserved) Writekraft Research & Publications LLP (Regd. No. AAI-1261) Corporate Office: 67, UGF, Ganges Nagar (SRGP), 365 Hairis Ganj, Tatmill Chauraha, Kanpur, 208004 Phone: 0512-2328181 Mobile: 7753818181, 9838033084 Email: info@writekraft.com Web: www.writekraft.com volatility. Trading volume and stock return .734volatility help in determining future price. Majority of market participants .358 .377 .359 .391invest in market to earn quick money. Volume always higher in the .799 month of October. Volumes always lower in the .776 month of March. I see the relationship between trading volume and stock return .624 .309 when I take decisions about investment. Trading volume and stock returns are two major pillars of the stock market which have explanatory .693 .331 .334 power to provide the transparent map of the microstructure of the capital market.
  • 51. Writekraft Research & Publications LLP (All Rights Reserved) Writekraft Research & Publications LLP (Regd. No. AAI-1261) Corporate Office: 67, UGF, Ganges Nagar (SRGP), 365 Hairis Ganj, Tatmill Chauraha, Kanpur, 208004 Phone: 0512-2328181 Mobile: 7753818181, 9838033084 Email: info@writekraft.com Web: www.writekraft.com 96
  • 52. Writekraft Research & Publications LLP (All Rights Reserved) Writekraft Research & Publications LLP (Regd. No. AAI-1261) Corporate Office: 67, UGF, Ganges Nagar (SRGP), 365 Hairis Ganj, Tatmill Chauraha, Kanpur, 208004 Phone: 0512-2328181 Mobile: 7753818181, 9838033084 Email: info@writekraft.com Web: www.writekraft.com Volatility always creates challenging environment because almost every interesting financial .488 .407 decision revolves around the volatility in the capital market. Arrival of new information always causes the volatility in stock .386 .440 .308 market. Managing risks in the stock market is difficult task because it .674 has movement as per the information flows into the market. It is very important to know the relationship between trading volume and stock return volatility .678 in stock markets for shifting the position as per the movement of market. I have some expectation from my investment decision and wish to
  • 53. Writekraft Research & Publications LLP (All Rights Reserved) Writekraft Research & Publications LLP (Regd. No. AAI-1261) Corporate Office: 67, UGF, Ganges Nagar (SRGP), 365 Hairis Ganj, Tatmill Chauraha, Kanpur, 208004 Phone: 0512-2328181 Mobile: 7753818181, 9838033084 Email: info@writekraft.com Web: www.writekraft.com fill up the gap between .482 .307 .326 expectations and actual return from the securities. The dependence of return on past returns, past volume and current .325 .363volume always raise questions for me. I always take position as per my .516 .418 understanding about the market. Analyzing the stock return and trading volume is essential to .313 .546 know the causalrelationship between these two indicators. In order to succeed,grow and survive, I have to adopt various .363 .427 .379 strategies regarding trading volume and stock return volatility. A good knowledge of the relationship between trading volume and stock return is .452 .512 .389 necessary for gaining profit in the
  • 54. Writekraft Research & Publications LLP (All Rights Reserved) Writekraft Research & Publications LLP (Regd. No. AAI-1261) Corporate Office: 67, UGF, Ganges Nagar (SRGP), 365 Hairis Ganj, Tatmill Chauraha, Kanpur, 208004 Phone: 0512-2328181 Mobile: 7753818181, 9838033084 Email: info@writekraft.com Web: www.writekraft.com era of globalization. 97
  • 55. Writekraft Research & Publications LLP (All Rights Reserved) Writekraft Research & Publications LLP (Regd. No. AAI-1261) Corporate Office: 67, UGF, Ganges Nagar (SRGP), 365 Hairis Ganj, Tatmill Chauraha, Kanpur, 208004 Phone: 0512-2328181 Mobile: 7753818181, 9838033084 Email: info@writekraft.com Web: www.writekraft.com Current returns always cause .574 current volume. Current volume always causes .773 current returns. Previous day volume always .323 .576 causes current returns. Previous day returns always cause .788 current volume. A large positive or large negative return lead future forecasts of the .596 variance. I follow others or depend on the directions of others when I invest .710 my fund into the market. I look at investment prepositions and apply my own judgment while .662 .360 investing. I prefer to invest in domestic .596 market.
  • 56. Writekraft Research & Publications LLP (All Rights Reserved) Writekraft Research & Publications LLP (Regd. No. AAI-1261) Corporate Office: 67, UGF, Ganges Nagar (SRGP), 365 Hairis Ganj, Tatmill Chauraha, Kanpur, 208004 Phone: 0512-2328181 Mobile: 7753818181, 9838033084 Email: info@writekraft.com Web: www.writekraft.com I dislike ambiguous situations where I feel that I am not in a better position than others to .671 evaluate investment in a given stock. I traded on the basis of superior information about the market but .533 .336 .321 earned lower return. I feelregret when I realize a loss .812and stock prices rise subsequently. I feelpride when I realize a gain .621 .330 and so sell the winners. I understand that in order to achieve higher returns, it is .675 necessary to take some risk. Source: Primary Data Table 5.5 shows the rotated component matrix which is a matrix of the factor loadings for each variable onto each factor. This matrix contains the same information as the component matrix except that it is calculated after rotation. After rotation of the variable all the variable are loaded onto group that is called factor.
  • 57. Writekraft Research & Publications LLP (All Rights Reserved) Writekraft Research & Publications LLP (Regd. No. AAI-1261) Corporate Office: 67, UGF, Ganges Nagar (SRGP), 365 Hairis Ganj, Tatmill Chauraha, Kanpur, 208004 Phone: 0512-2328181 Mobile: 7753818181, 9838033084 Email: info@writekraft.com Web: www.writekraft.com 98
  • 58. Writekraft Research & Publications LLP (All Rights Reserved) Writekraft Research & Publications LLP (Regd. No. AAI-1261) Corporate Office: 67, UGF, Ganges Nagar (SRGP), 365 Hairis Ganj, Tatmill Chauraha, Kanpur, 208004 Phone: 0512-2328181 Mobile: 7753818181, 9838033084 Email: info@writekraft.com Web: www.writekraft.com Table 5.6: Profiling of Investors’ Perceptions towards the relationship between Trading Volume and Stock Return Volatility Variable Factor and Variables Factor Number loading (R1) Importance of volume and return (Cronbach’s α= .831) V09 Trading volume and stock return volatility help in determining .734 future price. V14 Trading volume and stock returns are two major pillars of the stock market which have explanatory power to provide the .693 transparent map of the microstructure of the capital market. V18 It is very important to know the relationship between trading volume and stock return volatility in stock markets for shifting .678 the position as per the movement of market. V13 I see the relationship between trading volume and stock return .624 when I take decisions about investment. V15 Volatility always creates challenging environment because almost every interesting financial decision revolves around the .488 volatility in the capital market. V06 I see the volume when I take decisions about investment. .454 V19 I have some expectation from my investment decision and wish to fill up the gap between expectations and actual return from .482 the securities. Perceive (Cronbach’s α=.721) V37 I understand that in order to achieve higher returns, it is .675 necessary to take some risk. V31 I look at investment prepositions and apply my own judgment .662 while investing.
  • 59. Writekraft Research & Publications LLP (All Rights Reserved) Writekraft Research & Publications LLP (Regd. No. AAI-1261) Corporate Office: 67, UGF, Ganges Nagar (SRGP), 365 Hairis Ganj, Tatmill Chauraha, Kanpur, 208004 Phone: 0512-2328181 Mobile: 7753818181, 9838033084 Email: info@writekraft.com Web: www.writekraft.com V05 I like to join conversations about financial matters. .648 V21 I always take position as per my understanding about the .516 market. V07 I see the returns when I take decisions about investment. .501 Information (Cronbach’s α=.745) V30 I follow others or depend on the directions of others when I 0.710 invest my fund into the market. V08 Market participants are aware of all kinds of relationship 0.684 between trading volume and stock return volatility. V34 I traded on the basis of superior information about the market 0.533 but earned lower return. V04 I read the business section of the newspaper attentively. 0.486 V20 The dependence of return on past returns, past volume and 0.363 current volume always raise questions for me. 99
  • 60. Writekraft Research & Publications LLP (All Rights Reserved) Writekraft Research & Publications LLP (Regd. No. AAI-1261) Corporate Office: 67, UGF, Ganges Nagar (SRGP), 365 Hairis Ganj, Tatmill Chauraha, Kanpur, 208004 Phone: 0512-2328181 Mobile: 7753818181, 9838033084 Email: info@writekraft.com Web: www.writekraft.com (R2) Cause-Effect Relationship (Cronbach’s α=.711) V26 Current volume always causes current returns 0.773 V25 Current returns always cause current volume. 0.574 V27 Previous day volume always causes current returns. 0.576 V24 A good knowledge of the relationship between trading volume and stock return is necessary for gaining profit in the era of 0.512 globalization. V23 In order to succeed, grow and survive, I have to adopt various 0.427 strategies regarding trading volume and stock return volatility. Anxiety (Cronbach’s α=.695) V02 I am anxious about financial and money affairs 0.795 V01 I get unsure by the views of financial experts 0.681 V03 After making a decision, I am anxious whether I was right or 0.677 wrong Risk Managem ent (Cronbach’s α= .609) V17 Managing risks in the stock market is difficult task because it 0.674 has movement as per the information flows into the market. V29 A large positive or large negative return lead future forecasts of 0.596 the variance. V16 Arrival of new information always causes the volatility in stock 0.44 market. Projection (Cronbach’s α=.673) V35 I feel regret when I realize a loss and stock prices rise 0.812
  • 61. Writekraft Research & Publications LLP (All Rights Reserved) Writekraft Research & Publications LLP (Regd. No. AAI-1261) Corporate Office: 67, UGF, Ganges Nagar (SRGP), 365 Hairis Ganj, Tatmill Chauraha, Kanpur, 208004 Phone: 0512-2328181 Mobile: 7753818181, 9838033084 Email: info@writekraft.com Web: www.writekraft.com subsequently V36 I feel pride when I realize a gain and so sell the winners. 0.621 V10 Majority of market participants invest in market to earn quick 0.391 money. Anomalies (Cronbach’s α= .745) V11 Volume always higher in the month of October. 0.799 V12 Volumes always lower in the month of March. 0.776 Inclination (Cronbach’s α= .550) V33 I dislike ambiguous situations where I feel that I am not in a 0.671 better position than others to evaluate investment in a given stock. V32 I prefer to invest in domestic market. 0.596 Tactics (Cronbach’s α= .465) V28 Previous day returns always cause current volume. 0.788 V22 Analyzing the stock return and trading volume is essential to 0.546 know the causal relationship between these two indicators. Source: Primary data Extraction Method: Principal Component Analysis. Rotation Method: Varimax with Kaiser Normalization 100
  • 62. Writekraft Research & Publications LLP (All Rights Reserved) Writekraft Research & Publications LLP (Regd. No. AAI-1261) Corporate Office: 67, UGF, Ganges Nagar (SRGP), 365 Hairis Ganj, Tatmill Chauraha, Kanpur, 208004 Phone: 0512-2328181 Mobile: 7753818181, 9838033084 Email: info@writekraft.com Web: www.writekraft.com Table 5.6 presents the structure of each dimension depicting investors’ perceptions on the relationship between trading volume and stock return volatility. It presents the dimensions and the variables constituting each dimension. The factor loading of each variable in the respective dimension is also shown in the table. Cronbach’s alpha was also calculated for each factor to measure the internal consistency of the variables in a specific factor, which is shows satisfactory results. The ten factors which were extracted were named as importance of volume and return, perceive, information, cause-effect relationship, anxiety, risk management, projection, anomalies, inclination, and tactics (Table 5.6). To find out the impact of these dimensions, multiple regression analysis was run for two factors taken here as dependent variables named R1 (Importance of volume and return) and R2 (Cause-effect relationship) (Table 5.6). The ten components resulting from the factor analysis are described as follows: (1) Factor 1 – Importance of Volume and Return. First factor consists of the statements related to trading volume and stock return volatility, so it is named as ‘importance of Volume and Return’. Reliability coefficient cronbach’s alpha for this factor is 0.831 and it explains 11.52 percent of variance. The statement ‘trading volume and stock return volatility help in determining future price’ has highest factor loading (0.734), which communicates about the importance of trading volume and stock return indicators. Investors’ think trading volume and stock return volatility can be used for forecasting future prices. Another variable included in this factor is ‘trading volume and stock returns are two major pillars of the stock market which have explanatory power to provide the transparent map of the microstructure of the capital market’ with factor loading of 0.693. This statement is testing that trading volume and stock return volatility are important indicators for knowing the situation of the market. The parameter ‘it is very important to know the relationship between trading volume and stock return volatility in stock markets for shifting the position as per the movement of market’ having factor loading of 0.678 highlights the importance of knowing the
  • 63. Writekraft Research & Publications LLP (All Rights Reserved) Writekraft Research & Publications LLP (Regd. No. AAI-1261) Corporate Office: 67, UGF, Ganges Nagar (SRGP), 365 Hairis Ganj, Tatmill Chauraha, Kanpur, 208004 Phone: 0512-2328181 Mobile: 7753818181, 9838033084 Email: info@writekraft.com Web: www.writekraft.com relationship between trading volume and stock return volatility. Knowledge of trading volume and stock return volatility is very helpful for shifting the position as per the movement of market. I see the relationship between trading volume and stock return when I take decisions about investment has factor loading of 0.624. This statement 101