SlideShare a Scribd company logo
1 of 37
Trends in Psychotropic Medication Costs
for Children and Adolescents, 1997-2000
Andrés Martin, MD, MPH; Douglas Leslie, PhD
Objective: To examine trends in psychotropic medi-
cation utilization and costs for children and adolescents
between January 1, 1997, and December 31, 2000.
Methods: Pharmacy claims were analyzed for mental
health users 17 years and younger (N = 83 039) from a
national database covering 1.74 million privately in-
sured youths. Utilization rates and costs for dispensed
medications were compared across psychotropic drug cat-
egories and individual agents over time.
Results: Overall use of psychotropic drugs increased from
59.5% of mental health outpatients in 1997 (a 1-year
prevalence of 28.7 per 1000) to 62.3% in 2000 (33.7 per
1000), a 4.7% increase. The largest changes in utiliza-
tion were seen for atypical antipsychotics (138.4%), atypi-
cal antidepressants (42.8%), and selective serotonin re-
uptake inhibitors (18.8%). The average prescription price
increased by 17.6% ($7.90 per prescription), a change
in turn attributed to a shift toward costlier medications
within the same category (55.1% of the increase, or $4.35)
and to pure inflation (44.9% of the increase, or $3.55;
P for trend �.001 for all comparisons). Almost half
(46.7%) of the $2.7 million gross sales differential was
accounted for by only 3 of the 39 drugs identified (am-
phetamine compound, risperidone, and sertraline), and
75% was accounted for by 7 drugs (the previous 3 and
bupropion, paroxetine, venlafaxine, and citalopram).
Conclusions: Psychotropic drug expenditure increases
during the late 1990s resulted from more youths being
prescribed drugs, a preference for newer and costlier medi-
cations, and the net effects of inflation. The impact of man-
aged care and pharmaceutical marketing effects on these
trends warrants further study.
Arch Pediatr Adolesc Med. 2003;157:997-1004
T
HE USE of psychotropic
medications in children has
become a highly visible is-
sue, receiving regular at-
tention from academics (for
a recent summary, see Jensen et al1), poli-
cymakers,2,3 and the lay press alike.4-6 In
contrast to the controversial and at times
charged reactions that the topic can en-
gender, reliable national estimates of the
extent of pediatric use of psychotropic
drugs have only recently started to be-
come available.7-9 Previous studies10,11 have
documented that most psychotropic medi-
cations are not prescribed by mental health
specialists but rather by general practi-
tioners, a pattern that is certainly appli-
cable to stimulants, the most widely used
psychotropic drug class for children: in
1995, pediatricians prescribed 50% of
stimulants, family practitioners 20%, and
psychiatrists only 13%.8
The financial implications of pediat-
ric pharmacotherapy have gone largely un-
examined, an important shortcoming given
that in the US expenditures for prescrip-
tion drugs have continued to be the fastest
growing component of health care across
all ages.12 The financial burden of medica-
tion-related expenditures is substantial:
whereas overall health costs increased by
7% in 2000, prescription drug spending
grew by 15%. For example, Medicaid spend-
ing on prescription drugs more than tripled
in the 1990s, from $4.8 billion (6.6% of total
Medicaid costs) in 1990 to $17.0 billion
(9.4% of total Medicaid costs) in 1999.13
The most recent national data on men-
tal health utilization and costs specific for
children and adolescents are from 1998,14
when overall national expenditures were es-
timated to be $11.7 billion ($172 per child).
Outpatient services accounted for 57% of
the total costs, inpatient services for 33%,
and psychotropic drugs for 9%. A study
based on privately insured youths15 showed
that during the same interval (1997 to 2000)
that outpatient and inpatient psychiatric
costs for American youths decreased (by
18.4% and 14.4%, respectively), medica-
tion-related expenditures increased by
12.1%. Although it is plausible that higher
psychotropic drug use may relate to cost
savings in overall mental health services (by
decreasing or obviating the need for other
services, such as psychotherapy), no pedi-
ARTICLE
From the Child Study Center
(Dr Martin) and the
Departments of Psychiatry and
Epidemiology and Public Health
(Dr Leslie), Yale University
School of Medicine, New Haven,
Conn; and the Northeast
Program Evaluation Center,
West Haven, Conn (Dr Leslie).
Dr Martin has received
honoraria from Janssen
Pharmaceuticals and Alza Corp
and has been involved in an
industry-sponsored clinical trial
for Bristol-Myers Squibb.
Dr Leslie has served as a
consultant to Pfizer and Purdue
Pharmaceuticals and has
received grants from
Bristol-Myers Squibb and
AstraZeneca.
(REPRINTED) ARCH PEDIATR ADOLESC MED/ VOL 157,
OCT 2003 WWW.ARCHPEDIATRICS.COM
997
©2003 American Medical Association. All rights reserved.
atric cost-benefit studies have empirically addressed this
possibility, to our knowledge.
Both of the cited studies14,15 analyzed aggregate psy-
chotropic medication expenditures and did not provide
information on the drug classes or specific agents re-
sponsible for driving cost changes. It is against this back-
drop that this study aims to describe the main drivers un-
derlying psychotropic medication cost changes at the level
of drug classes and specific agents involved.
METHODS
STUDY DESIGN
A cross-sectional design for each of 4 years (1997-2000) was
used to characterize psychotropic medication utilization and
cost trends for youths 17 years and younger.
DATA SOURCE
We used a research database (MarketScan; Medstat, Ann Arbor,
Mich) to describe patterns of health care utilization and costs.
The database, a publicly available fee-for-service medical and
pre-
scription claims resource, contains claims information for indi-
viduals nationwide who are insured through the benefit plans
of large employers and includes more than 200 different insur-
ance companies. The working sample consisted of all individu-
als in the database 17 years and younger who had a claim for
mental health services and possible pharmacy claims data avail-
able during the study (N = 83 039). We specifically did not ex-
clude children younger than 3 years, as there is epidemiologic
evidence for increasing rates of psychotropic medication use in
this age group.16,17 Demographic information on the entire en-
rolled population (N = 1 735 486) was also available. Individual
information was stripped of any personal identifiers, stored
anony-
mously, and exclusively referenced through study-specific
unique
identifiers following published guidelines.18
STUDY POPULATION AND PROCEDURES
The number and 1-year prevalence of enrolled children receiv-
ing mental health services and psychotropic medications were
calculated. Mental health claims were defined as those with a
di-
agnosis within the 290.00 to 319.99 range of International Clas-
sification of Diseases, Ninth Revision, codes. Potentially
relevant
codes (eg, 799.2 for “nervousness” or 780.5 for “sleep distur-
bance”) were not included, in keeping with earlier methods.15
In contrast to that earlier study,15 in which individual youths
were
the primary unit of analysis, this study focuses on prescrip-
tions. Thus, sociodemographic and diagnostic trends seen dur-
ing the study (such as an increase in the diagnosis of bipolar
dis-
order) are examined in detail in that complementary study.15
Psychotropic medications were identified on the basis of a
comprehensive National Drug Code registry and were assigned
to 1 of 6 drug classes: (1) �-agonists, (2) antidepressants, (3)
antipsychotics, (4) mood stabilizers, (5) stimulants, and (6) anx-
iolytics and sedative-hypnotics. Antihistamines (including hy-
droxyzine hydrochloride), �-blockers, and anticholinergic
agents
were specifically excluded from analysis given the potential for
ambiguity in determining their use as psychotropic agents.
Charges associated with pharmacy claims were measured
as the actual paid amounts instead of the billed charges to pro-
vide a more accurate measure of cost. Paid amounts included
patient payments (deductibles or copayments) and payments
made by the patient’s insurance plan(s). Costs were adjusted for
inflation using the medical care component of the Consumer
Price
Index, with all amounts expressed as 1997 dollars.
After calculating costs for psychotropic medications as an
aggregate annual amount, costs were estimated across psycho-
tropic drug category and specific agent. Costs were estimated
as overall and per-prescription amounts. Each drug’s share of
utilization was then calculated by dividing the number of pre-
scriptions filled by (1) the number of all prescriptions in that
category and (2) the overall number of prescriptions filled in
that year. Each drug’s share of overall and class-specific utili-
zation, as well as mean prescription price, was compared across
the 4 years of study.
Next, the gross difference in psychotropic drug sales was
calculated between 2000 and 1997, and the proportion of the
total difference attributable to each medication category and
each individual agent was determined. Each drug’s attribut-
able proportion served as a weighting factor by which change
in price and change in category utilization was multiplied. By
summing the weighted price changes, an overall estimate of the
impact of medication inflation was obtained; a measure of medi-
cation shift (from one agent to another within the same cat-
egory) was similarly arrived at by summing the weighted uti-
lization changes. The fraction of overall psychotropic drug sales
that could be attributed to an increase in the number of pre-
scriptions filled was calculated by multiplying the difference
in the number of prescriptions by the mean prescription price
across the first and last study years. This amount, in turn, was
divided into portions attributable to (1) larger membership en-
rollment, (2) changing proportion of medicated enrollees, and
(3) enrollees continuing drug treatment for longer periods.
DATA ANALYSIS
Linear trends over time were assessed for categorical variables
by using the Cochran Mantel-Haenszel �2 test (df = 1) and for
continuous variables by using general linear models (df = 3).
Cost
trends were calculated based on log-transformed amounts.
RESULTS
POPULATION CHARACTERISTICS
Demographic and clinical characteristics of outpatient men-
tal health users in this study group have been described in
detail previously.15 Briefly, of 352 413 individuals 17 years
and younger with linked pharmacy data who were en-
rolled in 1997, 17 670 (5.0%) received outpatient mental
health services vs 26 677 (5.6%) of 473 954 in 2000, rep-
resenting a 34.5% increase in membership enrollment and
a 12.2% increase in outpatient mental health utilization rates.
PATTERNS OF PSYCHOTROPIC
MEDICATION USE
More than half of all outpatient users (60.1% across the 4
study years) were prescribed at least 1 psychotropic medi-
cation during any given year. Table 1 gives the 1-year
prevalence of psychotropic drug use across the various medi-
cation categories. In addition to giving the proportions of
outpatient mental health users dispensed psychotropic
agents, 1-year prevalence per 1000 enrollees are also given,
using the number of annual enrollees with pharmacy ben-
efits as the denominator. The overall use of psychotropic
drugs increased from 59.5% of mental health outpatients
in 1997 (a 1-year prevalence of 28.7 per 1000) to 62.3% in
2000 (33.7 per 1000), representing a 4.7% increase. The
largest increases in utilization were seen for atypical anti-
psychotics (138.4%), other antidepressants (42.8%), and
(REPRINTED) ARCH PEDIATR ADOLESC MED/ VOL 157,
OCT 2003 WWW.ARCHPEDIATRICS.COM
998
©2003 American Medical Association. All rights reserved.
selective serotonin reuptake inhibitors (SSRIs) (18.8%). All
categories had an increase in utilization, except for typical
antipsychotics (–58.4%) and tricyclic antidepressants
(TCAs) (–41.5%). Although the proportion of outpa-
tients dispensed stimulants remained steady at 39% (P=.14),
the prevalence of stimulant use at the enrollee level in-
creased over time, increasing from 19.4 to 21.8 per 1000
(P�.001). Except for stimulants and �-agonists, all classes
had statistically significant changes in utilization (Table 1).
AGGREGATE PSYCHOTROPIC MEDICATION
EXPENDITURES AND USE
Table 2 reports aggregate medication use and expen-
ditures. Gross expenditures increased from $4.1 mil-
lion in 1997 to $6.8 million in 2000, a 65.2% increase.
The increase represents more than just a larger enroll-
ment base, as evidenced by the fact that psychotropic drug
expenditures per enrollee increased by 22.8%. During this
time, the average prescription increased in price by 17.6%
($7.90 per prescription) (P for trend �.001). Although
46.7% more prescriptions were filled in 2000, individu-
als were, on average, dispensed fewer prescriptions an-
nually (8.1 vs 8.7 in 1997; P for trend �.001), suggest-
ing that most additional prescriptions were for children
continuing psychotropic drug therapy for longer peri-
ods or for newly treated youngsters.
CATEGORY-SPECIFIC PSYCHOTROPIC
MEDICATION EXPENDITURES AND USE
Table 3 presents the costs and clinical share (overall and
by category) of all psychotropic medications identified. As
anticipated, stimulants were the most commonly pre-
scribed class, accounting for 45.6% of all psychotropic pre-
scriptions in 2000. Despite the large volume of stimulant
prescriptions filled, they represented a relative reduction
(–14.4%) from the 1997 total share, a reflection of the rapid
rise in the prescription of other nonstimulant medica-
tions to this age group, notably, antidepressants and mood
stabilizers. Indeed, antidepressants increased their share
of all psychotropic drug prescriptions by 16.5%, a mean
change that does not capture the wide variability seen across
subcategories: the atypical antidepressant and SSRI shares
increased by 61.4% and 27.9%, respectively, compared with
the large reduction (–51.4%) seen for TCAs. Mood stabi-
lizers had an increase in their share (13.7%) and ac-
counted for a larger volume of psychotropic prescrip-
tions (8.6% in 2000) than did antipsychotics (5.7%). The
latter experienced a radical shift from traditional to atypi-
Table 1. Psychotropic Medication Prevalence by Drug Category
Among MarketScan* Enrollees Aged 0 to 17 Years
Psychotropic Drug Category
No. (%) per 1000 Enrollees
Change in Proportion
1997
(n = 17 670)
2000
(n = 26 677) % �21† P for Trend
Any 10 516 (59.5) 28.7 16 622 (62.3) 33.7 4.7 56.55 �.001
�-Agonists 818 (4.6) 2.3 1207 (4.5) 2.6 −2.3 0.20 .65
Antidepressants 4409 (25.0) 12.5 7480 (28.0) 15.8 12.4 61.80
�.001
SSRIs 2932 (16.6) 8.3 5257 (19.7) 11.1 18.8 82.02 �.001
TCAs 1053 (6.0) 3.0 930 (3.5) 2.0 −41.5 157.12 �.001
Other 1237 (7.0) 3.5 2667 (10.0) 5.6 42.8 115.11 �.001
Antipsychotics 565 (3.2) 1.6 1344 (5.0) 2.8 57.6 105.52 �.001
Atypical 329 (1.9) 0.9 1184 (4.4) 2.5 138.4 245.52 �.001
Typical 156 (0.9) 0.4 98 (0.4) 0.2 −58.4 46.29 �.001
Mood stabilizers 972 (5.5) 2.9 1660 (6.2) 3.5 13.1 10.66 .001
Stimulants 6845 (38.7) 19.4 10 345 (38.8) 21.8 0.1 2.18 .14
Anxiolytics 685 (3.9) 1.9 1162 (4.4) 2.5 12.4 5.38 .02
Abbreviations: SSRIs, selective serotonin reuptake inhibitors;
TCAs, tricyclic antidepressants.
*Medstat, Ann Arbor, Mich.
†Cochran Mantel-Haenszel �2.
Table 2. Aggregate Psychotropic Medication Expenditures and
Use, 1997-2000*
Variable 1997 2000
Year Effect
Change, % F df †
Psychotropic drug expenditures, $ 4 118 337 6 803 123 65.2 NA
NA
Prescriptions, No. 91 862 134 724 46.7 NA NA
Enrollees, No. 352 413 473 954 34.5 NA NA
Psychotropic drug expenditures per enrollee, mean, $ 11.7 14.4
22.8 NA NA
Psychotropic drug expenditures per prescription, mean (SD), $‡
45.1 (64.2) 53.0 (53.0) 17.6 505.82 429 188§
Annual prescriptions per medicated outpatient, mean (SD), No.
8.7 (8.8) 8.1 (8.3) −7.2 20.47 52 560§
Abbreviation: NA, not applicable.
*All dollar amounts are adjusted for inflation and are expressed
as 1997 equivalents.
†Denominator df ; numerator df is 3.
‡For a 30-day supply; not adjusted for dose equivalence.
§P for trend �.001.
(REPRINTED) ARCH PEDIATR ADOLESC MED/ VOL 157,
OCT 2003 WWW.ARCHPEDIATRICS.COM
999
©2003 American Medical Association. All rights reserved.
cal agents. In fact, atypical antipsychotics had the most pro-
nounced change in their share of all psychotropic drug pre-
scriptions (113.6%). Although no attempt was made to
categorize anticonvulsants according to their primary in-
dication (psychiatric vs neurologic), the possible effect of
misclassification is small given that all patients in the da-
tabase had a psychiatric condition and that non–mood sta-
bilizing anticonvulsants (such as phenytoin) were ex-
cluded from analysis.
In addition to TCAs and traditional antipsychotics,
several drugs had their category share eroded by newer
and generally more expensive agents. The clearest case is
that of stimulants, where methylphenidate hydrochlo-
ride decreased its category share by 23.4%. The stimulant
class balance was largely affected by the introduction in
1996 of amphetamine compound (Adderall; Shire Rich-
wood US Inc, Florence, Ky), whose share grew to 27.3%,
offsetting the declines in the use of dextroamphetamine
sulfate (–1.1%) and pemoline (–2.8%). In a similar man-
ner, the 7.7% decrease in fluoxetine’s share of the antide-
pressants was offset by increases in the use of newer SS-
RIs (including citalopram, introduced in 2000) and atypical
antidepressants. The price of fluoxetine did not change sub-
stantially (+5.3%), reflective of the fact that generic fluox-
etine, introduced after the patent exclusivity of Prozac (Eli
Lilly & Co, Indianapolis, Ind) expired on December 31,
2000, was not yet captured in the interval covered by this
data set. Older mood stabilizers, such as lithium carbon-
ate, carbamazepine, and valproate, in turn, had their class
shares eroded by newer-generation anticonvulsants, which
experienced the most turbulent prescription shifts of any
agents. For example, the number of topiramate, gabapen-
tin, and lamotrigine prescriptions increased by 13.6-, 6.4-
and 3.3-fold, respectively.
With few exceptions, most of the newly intro-
duced agents were more expensive—at times signifi-
cantly so—than those they were supplanting. For ex-
ample, atypical antipsychotic drug costs per prescription
were on average 3.8 times higher than those of their con-
ventional counterparts; SSRIs and atypical antidepres-
Table 3. Psychotropic Medication Expenditures and Use, by
Drug Category, 1997-2000*
Psychotropic
Drug Category
1997 2000
Change in Share, %‡
Prescriptions
Filled, No.
Prescription
Cost,
Mean, $†
Share, %
Prescriptions
Filled, No.
Prescription
Cost,
Mean, $†
Share, %
Of
Category
Of All
Prescriptions
Of
Category
Of All
Prescriptions
Of
Category
Of All
Prescriptions
Stimulants
Methylphenidate
hydrochloride
38 092 35 78.2 41.7 32 081 35 54.8 25.0 −23.4§ −40.0§
Amphetamine
compound
4699 33 9.6 5.1 21 619 39 36.9 16.9 27.3§ 227.5§
Dextroamphetamine
sulfate
4016 30 8.2 4.4 4179 34 7.1 3.3 −1.1§ −25.9§
Pemoline 1917 65 3.9 2.1 647 73 1.1 0.5 −2.8§ −76.0§
Subtotal 48 724 36 100.0 53.4 58 526 36 100.0 45.6 NA −14.4§
Antidepressants
SSRIs
Sertraline
hydrochloride
4340 73 17.1 4.8 8223 69 19.8 6.4 2.7§ 34.9§
Fluoxetine 6353 85 25.0 7.0 7183 89 17.3 5.6 −7.7§ −19.5§
Paroxetine 2819 65 11.1 3.1 5721 66 13.8 4.5 2.7§ 44.5§
Citalopram NA NA NA NA 2725 57 6.6 2.1 NA NA
Fluvoxamine
maleate
715 122 2.8 0.8 1717 116 4.1 1.3 1.3§ 71.0§
Subtotal 14 227 79 56.0 15.6 25 569 76 61.5 19.9 5.5§ 27.9§
Other
Bupropion
hydrochloride
3204 55 12.6 3.5 6288 64 15.1 4.9 2.5§ 39.7§
Venlafaxine
hydrochloride
717 65 2.8 0.8 2840 79 6.8 2.2 4.0§ 182.0§
Mirtazapine 126 79 0.5 0.1 855 59 2.1 0.7 1.6§ 383.1§
Other atypical 1232 24 4.9 1.3 1984 25 4.8 1.5 −0.1 14.6§
Subtotal 5279 49 20.8 5.8 11 967 61 28.8 9.3 8.0§ 61.4§
TCAs
Imipramine
hydrochloride
3414 12 13.4 3.7 2140 14 5.1 1.7 −8.3§ −55.4§
Nortriptyline
hydrochloride
814 36 3.2 0.9 580 23 1.4 0.5 −1.8§ −49.3§
Clomipramine
hydrochloride
531 56 2.1 0.6 406 47 1.0 0.3 −1.1§ −45.6§
Other TCA 1130 13 4.4 1.2 898 12 2.2 0.7 −2.3§ −43.4§
Subtotal 5889 20 23.2 6.4 4024 18 9.7 3.1 −13.5§ −51.4§
Subtotal 25 395 59 100.0 27.8 41 560 66 100.0 32.4 NA 16.5§
(continued)
(REPRINTED) ARCH PEDIATR ADOLESC MED/ VOL 157,
OCT 2003 WWW.ARCHPEDIATRICS.COM
1000
©2003 American Medical Association. All rights reserved.
sants were 4.1 and 3.4 times, respectively, more expen-
sive than TCAs, and the price ratio between lamotrigine
and lithium reached a high of 7.9.
PSYCHOTROPIC MEDICATION SALES
DIFFERENTIAL AND UNDERLYING FACTORS
Figure 1 presents the gross differential in psychotropic
drug sales between 1997 and 2000 as proportionally at-
tributed to various psychotropic drug classes and indi-
vidual agents. Antidepressants accounted for the largest
fraction of the overall sales change (46.6%), with most of
the share driven by SSRIs (30.6%). Antipsychotics fol-
lowed as a category (21.1%), with virtually all change due
to atypical agents. Other antidepressants, stimulants, and
mood stabilizers accounted for a similar fraction each (ap-
proximately 15%). Almost half of the overall sales differ-
ential (46.7%) was accounted for by only 3 of the 39 drugs
identified (amphetamine compound, risperidone, and ser-
traline hydrochloride), and 75% by 7 drugs (the previous
3, together with bupropion hydrochloride, paroxetine, ven-
lafaxine hydrochloride, and citalopram). Five of the 7 agents
are antidepressants, and all of them are available only as
brand name preparations given their recent introduction
to the marketplace.
The seemingly low share of the overall sales differen-
tial accounted for by stimulants (14.5%) can be under-
stood on the basis of the cost shift seen within the cat-
Table 3. Psychotropic Medication Expenditures and Use, by
Drug Category, 1997-2000* (cont)
Psychotropic
Drug Category
1997 2000
Change in Share, %‡
Prescriptions
Filled, No.
Prescription
Cost,
Mean, $†
Share, %
Prescriptions
Filled, No.
Prescription
Cost,
Mean, $†
Share, %
Of
Category
Of All
Prescriptions
Of
Category
Of All
Prescriptions
Of
Category
Of All
Prescriptions
Mood stabilizers
Valproate 3533 57 50.9 3.9 5328 62 48.1 4.2 −2.8§ 7.4�
Carbamazepine 1798 33 25.9 2.0 1988 33 17.9 1.5 −8.0§ −21.3§
Lithium 1238 16 17.8 1.4 1499 22 13.5 1.2 −4.3§ −13.8§
Gabapentin 192 79 2.8 0.2 1229 91 11.1 1.0 8.3§ 356.7§
Topiramate 43 95 0.6 0.0 586 150 5.3 0.5 4.9§ 870.1§
Lamotrigine 135 234 1.9 0.1 450 174 4.1 0.4 2.1§ 137.3§
Subtotal 6939 48 100.0 7.6 11 080 64 100.0 8.6 NA 13.7§
Antipsychotics
Atypical
Risperidone 1616 110 50.9 1.8 4240 118 58.4 3.3 7.5§ 86.8§
Olanzapine 427 218 13.5 0.5 1167 189 16.1 0.9 2.6¶ 94.6§
Quetiapine
fumarate
6 143 0.2 0.0 947 125 13.1 0.7 12.9§ NA
Clozapine 125 230 3.9 0.1 170 134 2.3 0.1 1.6¶ −3.2
Subtotal 2174 138 68.5 2.4 6524 132 89.9 5.1 −21.4§ 113.6§
Typical
Haloperidol 356 23 11.2 0.4 196 14 2.7 0.2 −8.5§ −60.8§
Pimozide 146 36 4.6 0.2 194 46 2.7 0.2 1.9§ −5.4
Thioridazine 345 13 10.9 0.4 168 16 2.3 0.1 −8.6§ −65.3§
Molindone
hydrochloride
17 41 0.5 0.0 38 78 0.5 0.0 0.0 59.1
Other typical 136 27 4.3 0.1 136 58 1.9 0.1 2.4§ −28.8§
Subtotal 1000 22 31.5 1.1 732 34 10.1 0.6 −21.4§ −47.9§
Subtotal 3174 102 100.0 3.5 7256 123 100.0 5.7 NA 62.7§
Agonists
Clonidine 3858 14 80.3 4.2 5093 14 77.1 4.0 −3.2§ −6.0§
Guanfacine
hydrochloride
948 44 19.7 1.0 1512 37 22.9 1.2 3.2§ 13.5¶
Subtotal 4806 20 100.0 5.3 6605 19 100.0 5.1 NA −2.2§
Anxiolytics
Buspirone
hydrochloride
762 79 33.3 0.8 1356 92 41.6 1.1 8.3§ 26.7§
Clonazepam 579 42 25.3 0.6 633 29 19.4 0.5 −5.9§ −22.2§
Lorazepam 314 50 13.7 0.3 367 54 11.2 0.3 −2.5¶ −16.8¶
Zolpidem tartrate 166 61 7.3 0.2 271 55 8.3 0.2 1.0 16.2
Other 468 26 20.4 0.5 636 39 19.5 0.5 −1.0 −3.3
Subtotal 2289 54 100.0 2.5 3263 62 100.0 2.5 NA 1.5§
Abbreviations: NA indicates not applicable; SSRIs, selective
serotonin reuptake inhibitors; TCAs, tricyclic antidepressants.
*All dollar amounts are adjusted for inflation and are expressed
as 1997 equivalents.
†For a 30-day supply; not adjusted for dose equivalence.
‡Significance tested by Cochran Mantel-Haenszel �21.
§P�.001.
�P�.05.
¶P�.01.
(REPRINTED) ARCH PEDIATR ADOLESC MED/ VOL 157,
OCT 2003 WWW.ARCHPEDIATRICS.COM
1001
©2003 American Medical Association. All rights reserved.
egory: the single largest increase of cost differential (25.3%)
was that of amphetamine compound (Adderall), but it was
largely offset by the 2 single largest decreases seen for the
generic stimulants methylphenidate (–8.6%) and pemo-
line (–2.9%). Although these opposing trends provide an-
other line of evidence for the shift effect seen within this
drug category, it is not exclusive to stimulants. Indeed, the
shift toward newer and generally more expensive medica-
tions can be conceptualized as one of the two drivers to
prescription-related cost shifts over time. The other factor
is “pure” price inflation, reflective of higher costs for the
same medications due to cost increases at the manufac-
turer, wholesale, retail, pharmacy, or all levels combined.
Figure 2 depicts the various factors accounting for
the increase in psychotropic drug expenditures. The larg-
est component, responsible for 78.3% of the increment
seen, is the volume of prescriptions filled, a change that
can be attributed to a larger enrollment base (52.9%), to
more medicated enrollees (17.5%), and to enrollees con-
tinuing medication use for longer periods (8.7%). In ad-
dition, prescription price changes, through shifts to newer
medications and pure inflation, accounted for similar parts
of the remaining portion: 11.3% and 9.6%, respectively.
COMMENT
In this study, data from a national group of privately in-
sured children and adolescents were used to examine
changes in psychotropic drug expenditures. We found that
relatively few drugs accounted for a large portion of the
change in psychotropic medication expenditures over time
and that a combination of more drugs being prescribed, a
preference for newer and costlier drugs, and the net effect
of inflation had a compounded effect on price trends.
Gross psychotropic drug expenditures for this sample
showed a $2.7 million (65.2%) increase between 1997 and
2000. Most of that change (78.3%) was due to the large in-
crease in the volume of prescriptions filled (46.7%). This
finding is in keeping with the observation that, particu-
larly after 1994, growth in utilization, rather than price, has
been the primary driver of increased pharmaceutical spend-
ing.19 In addition, a shift toward newer (and generally more
By Class
SSRIs
Atypical APs
Other ADs
Stimulants
Mood Stabilizers
Anxiolytics
α-Agonists
Typical APs
TCAs
By Agent
Amphetamine Compound
Risperidone
Sertraline Hydrochloride
Bupropion Hydrochloride
Paroxetine
Venlafaxine Hydrochloride
Citalopram
All Others
Olanzapine
Valproate
Quetiapine Fumarate
Fluvoxamine Maleate
Fluoxetine
Gabapentin
Topiramate
Buspirone Hydrochloride
Pemoline
Methylphenidate Hydrochloride
–10 – 5 2520151050 30 35
Attributed Proportion, %
Figure 1. Psychotropic medication overall sales differential,
1997-2000. Totals by class and by agent sum to 100% ($2.7
million) each. SSRI indicates selective
serotonin reuptake inhibitor; APs, antipsychotics; ADs,
antidepressants; and TCAs, tricyclic antidepressants.
9.6%
Price 2:
Pure Inflation
11.3%
Price 1:
Shift Effect
8.7%
Volume 3:
Longer Time
on Medication
17.5%
Volume 2:
Proportion of Medicated Enrollees
52.9%
Volume 1:
Membership
Enrollment
Figure 2. Prescription-related factors contributing to increased
psychotropic
drug expenditures, 1997-2000. The values are the percentages of
the $2.7
million difference in gross sales (equivalent to a 65.2% increase
in gross
sales between 1997 and 2000).
(REPRINTED) ARCH PEDIATR ADOLESC MED/ VOL 157,
OCT 2003 WWW.ARCHPEDIATRICS.COM
1002
©2003 American Medical Association. All rights reserved.
expensive, brand name–only) agents and a pure inflation-
ary effect explained almost one quarter of the price change.
Expressed at the prescription level, at a time when the av-
erage price increased by 17.6% (or $7.90 per prescrip-
tion), it is estimated that 55.1% ($4.35) was attributable
to the shift effect and 44.9% ($3.55) to pure inflation.
The fact that the large number of new prescriptions
did not lead to a parallel increase in the number of pre-
scriptions per treated youth (a number that in fact de-
creased slightly), combined with the constant rates of mul-
tiple psychotropic pharmacotherapy20 seen (approximately
7.5 per 100 outpatients,21 data not shown), indicate that
most of the additional prescriptions in 2000 were written
for newly treated children. Stated alternatively, more in-
dividual youths were initially given or continued taking for
longer periods of time psychotropic medications rather than
a growing number being medicated with multiple agents.
A few psychotropic agents accounted for a dispro-
portionate fraction of the observed cost shifts. Almost half
of the overall sales differential (46.7%) was accounted for
by only 3 individual drugs, and 25.3% was accounted for
by amphetamine compound (Adderall) alone. Although
the price ratio between amphetamine compound and meth-
ylphenidate was low (1.1), a series of new, nongeneric
stimulant preparations had only recently been intro-
duced to the marketplace. Thus, these may be conserva-
tive estimates of price differentials given that newer and
more expensive agents that have gained stimulant market
share since then (eg, Concerta [Alza Corp, Mountain View,
Calif]) had not yet been introduced to market in 2000.
Several factors may help explain the observed trends:
1. Improved newer products and an expanding evi-
dence base. The virtual shifts from traditional to atypical
antipsychotics, or from TCAs to SSRIs, are supported by
a growing body of clinical trials specifically tailored to the
pediatric population.22 As pertinent examples, random-
ized controlled trials have documented the short-term
efficacy in children and adolescents of the SSRIs parox-
etine in major depression,23 sertraline in obsessive-
compulsive disorder,24 and fluvoxamine in generalized
anxiety disorder25 and of the atypical antipsychotic ris-
peridone in the treatment of disruptive behaviors in chil-
dren with subaverage intelligence26 or autism.27
2. Preference. Clinicians may have lower thresholds
to prescribe medication for conditions amenable to phar-
macologic treatment, especially when using newer agents
with more favorable safety and adverse effect profiles that
may not require as intense monitoring by specialists (eg,
serum levels with lithium or electrocardiographic moni-
toring with TCAs). Despite the steadily growing range of
effective pharmacologic treatments for psychiatrically ill
youths, a cautionary note is warranted, as clinicians may
use more psychotropic agents in the context of fewer in-
patient and outpatient resources to rely on; for example,
the increase in the use of mood stabilizers to target bipolar
and other externalizing disorders has limited underlying
supportive evidence, particularly for newer-generation an-
ticonvulsants.28 Moreover, there is a paucity of informa-
tion regarding long-term effects on the developing brain
of early and prolonged exposure to psychotropic drugs.29
3. Marketing pressures. Few truly new (ie, mecha-
nistically distinct) agents have been introduced to the mar-
ketplace during the past decade. Instead, variations of suc-
cessful compounds are crowding an existing repertoire,
a pattern that was most apparent for stimulants and SS-
RIs. Pharmaceutical industry marketing-sales and mar-
keting-research ratios have to be successively higher for
newer agents to overcome the advantages of early mov-
ers in the marketplace19: direct-to-consumer and direct-
to-prescriber advertising practices have been an increas-
ingly common mechanism for the pharmaceutical industry
to gain market share for their products.30 The effects of
these advertising practices on clinical practice are still
poorly understood but are likely to be substantial, as sug-
gested by the large shifts within category share occur-
ring during the relatively short interval of this study.
The public largely experiences (and pays for) the es-
calating costs of their pharmaceuticals indirectly—
through more expensive insurance premiums. Indeed, the
generous pharmacy benefits typically associated with pri-
vate insurance plans lead to increasing costs as consum-
ers become “price insensitive” and request and feel en-
titled to the latest (and more expensive) drugs.1 3
Conversely, the uninsured often pay the highest price for
drugs, as they are not covered by copayments and they lack
the bargaining clout that large insurers and pharmacies
have to obtain medications at a discount.13 As a result, those
who are insured take more medications and fill prescrip-
tions more often, and the uninsured often go without nec-
essary treatment. As a case in point, for the approxi-
mately 1 in 6 children in the United States without health
insurance, use of psychotropic agents remained far be-
low that for those covered under public or private plans
in 1996 (1.5%, 5.3%, and 4.1%, respectively).7
Such economic disparities, and the overall trends de-
scribed herein, need to be considered in the context of
potential cost savings, as it is plausible that effective phar-
macotherapy may be related to reduced expenditures in
other areas, such as hospitalization or outpatient costs.
Similar to our earlier study,15 this descriptive study can-
not provide the formal cost-benefit analyses that the field
of pediatric psychopharmacology is in need of.
This study has several shortcomings, including lim-
ited generalizability. The psychotropic utilization rates
reported herein (28.7 per 1000 in 1997) are signifi-
cantly lower than recently published prevalence esti-
mates derived from 1996 nationally representative samples
(39 per 1000)7 or population-based analyses of regional
community practices (59-63 per 1000).9 Although the ex-
clusively privately insured nature of our study popula-
tion can explain part of the difference in prevalence, the
estimates presented herein are also lower than those of
comparable employer-insured samples; for example, our
2000 prevalence for stimulant use (21.8 per 1000) is well
below the 1999 rate of 26.5 per 1000 reported in a re-
cent study.8 (SSRI prevalence rates were more similar
across the two studies: 11.1 and 10.3 per 1000, respec-
tively.) The prevalence estimates presented herein are in-
tended as a general guide only, as MarketScan data are
not obtained in any systematic or randomly stratified man-
ner and are thus not intended to be epidemiologically rep-
resentative. A second important limitation is the lack of
information regarding quality of care, clinical out-
comes, or patient satisfaction variables, which does not
(REPRINTED) ARCH PEDIATR ADOLESC MED/ VOL 157,
OCT 2003 WWW.ARCHPEDIATRICS.COM
1003
©2003 American Medical Association. All rights reserved.
allow for a full cost-benefit analysis of these findings.
Third, the fact that prescription prices were not ad-
justed for dosage equivalence may have resulted in bi-
ased cost estimates, especially relevant to the calcula-
tion of market share within given drug categories.
Although real, the impact of such a factor is likely to be
small and nondifferentially distributed across drugs.
In conclusion, despite its limitations, this study docu-
ments how a relatively few drugs accounted for a large por-
tion of the change in psychotropic drug expenditures seen
during this interval and how a combination of more youths
being prescribed drugs, a preference for newer and cost-
lier medications, and the net effect of inflation had a com-
pounded effect on price trends. These results expand on
earlier evidence of a shift toward medication-based men-
tal health treatment modalities in children and adoles-
cents. Future studies should further address the impact
of managed care and pharmaceutical marketing effects on
these trends of clinical care.
Accepted for publication April 24, 2003.
This study was supported in part by Scientist Career
Development Award K01 MH01792 (Dr Martin); by grants
M01 RR06022, 5P01 HD1DC35482, and 5P01 HD03008
from the Public Health Service; by Research Units on Pedi-
atric Psychopharmacology contract MH97 CR0001 to Yale
University; and by a grant from the Child Health and De-
velopment Institute of Connecticut, Farmington.
This work on the costs of child psychiatry is dedi-
cated to our teacher and mentor, the late Donald J. Cohen,
MD (1940-2001), who taught us so much about the values
at the very core of our field.
We thank Robert Rosenheck, MD, John Schowalter, MD,
and James F. Leckman, MD, for their helpful comments on
earlier drafts of this manuscript.
Corresponding author: Andrés Martin, MD, MPH, Child
Study Center, Yale University School of Medicine, 230 S
Frontage Rd, PO Box 207900, New Haven, CT 06520 (e-mail:
[email protected]).
REFERENCES
1. Jensen PS, Edelman A, Nemeroff R. Pediatric
psychopharmacoepidemiology: who
is prescribing, and for whom, how, and why? In: Martin A,
Scahill L, Charney
DS, Leckman JF, eds. Pediatric Psychopharmacology: Principles
and Practice.
New York, NY: Oxford University Press; 2003:701-711.
2. Mental Health: A Report of the Surgeon General. Rockville,
Md: US Dept of Health
and Human Services, Substance Abuse and Mental Health
Services Administra-
tion, Center for Mental Health Services, National Institutes of
Health, National
Institute of Mental Health; 1999.
3. National Institute of Mental Health. Treatment of young
children with mental con-
ditions: White House Conference fact sheet, 2000. Available at:
http://www.nimh
.nih.gov/publicat/whmedchild.cfm. Accessed May 3, 2002.
4. Gibbs N. The age of Ritalin. Time. 1998; November 30:17-
19.
5. Kluger J. Next up: Prozac. Time. 1998; November 30:21.
6. Kalb C. Drugged out toddlers. Newsweek. 2000; March 6:15-
16.
7. Olfson M, Marcus SC, Weissman MM, Jensen PS. National
trends in the use of
psychotropic medications by children. J Am Acad Child
Adolesc Psychiatry. 2002;
41:514-521.
8. Shatin D, Drinkard CR. Ambulatory use of psychotropics by
employer-insured
children and adolescents in a national managed care
organization. Ambul Pedi-
atr. 2002;2:111-119.
9. Zito JM, Safer DJ, DosReis S, et al. Psychotropic practice
patterns for youth: a
10-year perspective. Arch Pediatr Adolesc Med. 2003;157:17-
25.
10. Zarin DA, Tanielian TL, Suarez AP, Marcus SC. Treatment
of attention-deficit hy-
peractivity disorder by different physician specialties
[Datapoints]. Psychiatr Serv.
1998;49:171.
11. Wolraich ML, Lindgren S, Stromquist A, Milich R, Davis C,
Watson D. Stimulant
medication use by primary care physicians in the treatment of
attention deficit
hyperactivity disorder. Pediatrics. 1990;86:95-101.
12. National Institute for Health Care Management Research
and Educational Foun-
dation. Prescription drug expenditures in 2001: another year of
escalating costs.
Available at: http://www.nihcm.org/spending2001.pdf.
Accessed May 5, 2002.
13. National Institute for Health Care Management Research
and Educational Foun-
dation. Prescription drug expenditures in 2000: the upward
trend continues. Avail-
able at: http://www.nihcm.org/spending2000.pdf. Accessed May
5, 2002.
14. Ringel JS, Sturm R. National estimates of mental health
utilization and expen-
ditures for children in 1998. J Behav Health Serv Res.
2001;28:319-333.
15. Martin A, Leslie D. Psychiatric inpatient, outpatient, and
medication utilization
and costs among privately insured youths, 1997-2000. Am J
Psychiatry. 2003;
160:757-764.
16. Zito JM, Safer DJ, dosReis S, Gardner JF, Boles M, Lynch
F. Trends in the prescrib-
ing of psychotropic medications to preschoolers. JAMA.
2000;283:1025-1030.
17. Vitiello B. Psychopharmacology for young children: clinical
needs and research
opportunities. Pediatrics. 2001;108:983-989.
18. Simon GE, Unutzer J, Young BE, Pincus HA. Large medical
databases, population-
based research, and patient confidentiality. Am J Psychiatry.
2000;157:1731-
1737.
19. Berndt ER. The US pharmaceutical industry: why major
growth in times of cost
containment? Health Aff (Millwood). 2001;20:100-114.
20. Martin A, Van Hoof T, Stubbe D, Sherwin T, Scahill L.
Multiple psychotropic phar-
macotherapy among child and adolescent enrollees in
Connecticut Medicaid man-
aged care. Psychiatr Serv. 2003;54:72-77.
21. Martin A, Sherwin T, Stubbe D, Van Hoof T, Scahill L,
Leslie D. Use of multiple
psychotropic drugs by Medicaid-insured and privately insured
children [Data-
points]. Psychiatr Serv. 2002;53:1508.
22. Riddle MA, Kastelic EA, Frosch E. Pediatric
psychopharmacology. J Child Psy-
chol Psychiatry. 2001;42:73-90.
23. Keller MB, Ryan ND, Strober M, et al. Efficacy of
paroxetine in the treatment of
adolescent major depression: a randomized, controlled trial. J
Am Acad Child
Adolesc Psychiatry. 2001;40:762-772.
24. March JS, Biederman J, Wolkow R, et al. Sertraline in
children and adolescents
with obsessive-compulsive disorder: a multicenter randomized
controlled trial.
JAMA. 1998;280:1752-1756.
25. Fluvoxamine for the treatment of anxiety disorders in
children and adolescents:
the Research Unit on Pediatric Psychopharmacology Anxiety
Study Group. N Engl
J Med. 2001;344:1279-1285.
26. Aman MG, De Smedt G, Derivan A, Lyons B, Findling RL.
Double-blind, placebo-
controlled study of risperidone for the treatment of disruptive
behaviors in chil-
dren with subaverage intelligence. Am J Psychiatry.
2002;159:1337-1346.
27. Research Units on Pediatric Psychopharmacology Autism
Network. Risperi-
done in children with autism and serious behavioral problems. N
Engl J Med.
2002;347:314-321.
28. Davanzo P, McCraken J. Mood stabilizers: lithium and
anticonvulsants. In: Mar-
tin A, Scahill L, Charney DS, Leckman JF, eds. Pediatric
Psychopharmacology:
Principles and Practice. New York, NY: Oxford University
Press; 2003:309-327.
29. Leckman JF, Young C. Commentary on noradrenergic and
serotonergic neuro-
endocrine responses in prepubertal, peripubertal, and
postpubertal rats pre-
treated with desipramine and sertraline. J Am Acad Child
Adolesc Psychiatry.
2002;41:1007-1009.
30. Rosenthal MB, Berndt ER, Donohue JM, Frank RG, Epstein
AM. Promotion of
prescription drugs to consumers. N Engl J Med. 2002;346:498-
505.
What This Study Adds
Psychotropic drug use prevalence among children and
adolescents has steadily increased during the past de-
cade, with most medications prescribed by pediatri-
cians and family practitioners.
Previous studies have shown increasing psycho-
tropic drug expenditures at the aggregate level but have
not provided information on the drug classes or spe-
cific agents responsible for such cost trends.
Half of the gross sales differential seen in this study
was accounted for by only 3 drugs (amphetamine com-
pound, risperidone, and sertraline), and 75% was ac-
counted for by 7 drugs (the previous 3, together with
bupropion, paroxetine, venlafaxine, and citalopram).
Children receiving psychotropics more often and
for longer periods, a shift toward newer (and costlier)
agents within a same therapeutic class, and the net ef-
fects of inflation all had an impact on increased phar-
maceutical spending.
(REPRINTED) ARCH PEDIATR ADOLESC MED/ VOL 157,
OCT 2003 WWW.ARCHPEDIATRICS.COM
1004
©2003 American Medical Association. All rights reserved.
Copyright 2003 American Medical Association. All Rights
Reserved. Applicable FARS/DFARS Restrictions
Apply to Government Use.
Trends in Psychotropic Medication Costsfor Children and Adol.docx

More Related Content

Similar to Trends in Psychotropic Medication Costsfor Children and Adol.docx

By Beth Han, Wilson M. Compton, Carlos Blanco, and Lisa J. Col
By Beth Han, Wilson M. Compton, Carlos Blanco, and Lisa J. ColBy Beth Han, Wilson M. Compton, Carlos Blanco, and Lisa J. Col
By Beth Han, Wilson M. Compton, Carlos Blanco, and Lisa J. ColTawnaDelatorrejs
 
Prescribing by specialty
Prescribing by specialtyPrescribing by specialty
Prescribing by specialtyPaul Coelho, MD
 
Antidepressants in Bipolar Disorder (mar 2007)
Antidepressants in Bipolar Disorder (mar 2007)Antidepressants in Bipolar Disorder (mar 2007)
Antidepressants in Bipolar Disorder (mar 2007)John Reites
 
Useand misusessummary
Useand misusessummaryUseand misusessummary
Useand misusessummaryBarry Duncan
 
Patterns of opioid use and risk of opioid overdose.
Patterns of opioid use and risk of opioid overdose.Patterns of opioid use and risk of opioid overdose.
Patterns of opioid use and risk of opioid overdose.Paul Coelho, MD
 
Patterns of Opioid Use and Risk of Opioid Overdose Death Among Medicaid Patients
Patterns of Opioid Use and Risk of Opioid Overdose Death Among Medicaid PatientsPatterns of Opioid Use and Risk of Opioid Overdose Death Among Medicaid Patients
Patterns of Opioid Use and Risk of Opioid Overdose Death Among Medicaid PatientsPaul Coelho, MD
 
COT and Adverse Risk Selection
COT and Adverse Risk SelectionCOT and Adverse Risk Selection
COT and Adverse Risk SelectionPaul Coelho, MD
 
A PROSPECTIVE STUDY OF DRUG UTILIZATION PATTERN AND EVALUATION USING WHO GUI...
 A PROSPECTIVE STUDY OF DRUG UTILIZATION PATTERN AND EVALUATION USING WHO GUI... A PROSPECTIVE STUDY OF DRUG UTILIZATION PATTERN AND EVALUATION USING WHO GUI...
A PROSPECTIVE STUDY OF DRUG UTILIZATION PATTERN AND EVALUATION USING WHO GUI...M.Arumuga Vignesh
 
Article On Memantine-1.pptx
Article On Memantine-1.pptxArticle On Memantine-1.pptx
Article On Memantine-1.pptxNimish Savaliya
 
Transition from methylphenidate or amphetamine to atomoxetine in children and...
Transition from methylphenidate or amphetamine to atomoxetine in children and...Transition from methylphenidate or amphetamine to atomoxetine in children and...
Transition from methylphenidate or amphetamine to atomoxetine in children and...hospital higueras
 
Literature Review Paper
Literature Review PaperLiterature Review Paper
Literature Review Papermslydiaw
 
Addictive Behaviors, Vol. 25, No. 3, pp. 441–443, 2000Copy.docx
Addictive Behaviors, Vol. 25, No. 3, pp. 441–443, 2000Copy.docxAddictive Behaviors, Vol. 25, No. 3, pp. 441–443, 2000Copy.docx
Addictive Behaviors, Vol. 25, No. 3, pp. 441–443, 2000Copy.docxnettletondevon
 
introductiontopharmacoepidemiology-230613144442-c713d639.pdf
introductiontopharmacoepidemiology-230613144442-c713d639.pdfintroductiontopharmacoepidemiology-230613144442-c713d639.pdf
introductiontopharmacoepidemiology-230613144442-c713d639.pdfOgunsina1
 
INTRODUCTION TO PHARMACOEPIDEMIOLOGY.pptx
INTRODUCTION TO PHARMACOEPIDEMIOLOGY.pptxINTRODUCTION TO PHARMACOEPIDEMIOLOGY.pptx
INTRODUCTION TO PHARMACOEPIDEMIOLOGY.pptxAmeena Kadar
 

Similar to Trends in Psychotropic Medication Costsfor Children and Adol.docx (20)

Physician Dispensing
Physician DispensingPhysician Dispensing
Physician Dispensing
 
Installment 5
Installment 5Installment 5
Installment 5
 
By Beth Han, Wilson M. Compton, Carlos Blanco, and Lisa J. Col
By Beth Han, Wilson M. Compton, Carlos Blanco, and Lisa J. ColBy Beth Han, Wilson M. Compton, Carlos Blanco, and Lisa J. Col
By Beth Han, Wilson M. Compton, Carlos Blanco, and Lisa J. Col
 
Prescribing by specialty
Prescribing by specialtyPrescribing by specialty
Prescribing by specialty
 
Modeling Opioid Risk
Modeling Opioid RiskModeling Opioid Risk
Modeling Opioid Risk
 
Antidepressants in Bipolar Disorder (mar 2007)
Antidepressants in Bipolar Disorder (mar 2007)Antidepressants in Bipolar Disorder (mar 2007)
Antidepressants in Bipolar Disorder (mar 2007)
 
Useand misusessummary
Useand misusessummaryUseand misusessummary
Useand misusessummary
 
Rise in Opioid Overdoses – Prevention Strategies
Rise in Opioid Overdoses – Prevention StrategiesRise in Opioid Overdoses – Prevention Strategies
Rise in Opioid Overdoses – Prevention Strategies
 
Patterns of opioid use and risk of opioid overdose.
Patterns of opioid use and risk of opioid overdose.Patterns of opioid use and risk of opioid overdose.
Patterns of opioid use and risk of opioid overdose.
 
Patterns of Opioid Use and Risk of Opioid Overdose Death Among Medicaid Patients
Patterns of Opioid Use and Risk of Opioid Overdose Death Among Medicaid PatientsPatterns of Opioid Use and Risk of Opioid Overdose Death Among Medicaid Patients
Patterns of Opioid Use and Risk of Opioid Overdose Death Among Medicaid Patients
 
psychotropic medication use in foster care youth
psychotropic medication use in foster care youth psychotropic medication use in foster care youth
psychotropic medication use in foster care youth
 
COT and Adverse Risk Selection
COT and Adverse Risk SelectionCOT and Adverse Risk Selection
COT and Adverse Risk Selection
 
A PROSPECTIVE STUDY OF DRUG UTILIZATION PATTERN AND EVALUATION USING WHO GUI...
 A PROSPECTIVE STUDY OF DRUG UTILIZATION PATTERN AND EVALUATION USING WHO GUI... A PROSPECTIVE STUDY OF DRUG UTILIZATION PATTERN AND EVALUATION USING WHO GUI...
A PROSPECTIVE STUDY OF DRUG UTILIZATION PATTERN AND EVALUATION USING WHO GUI...
 
Article On Memantine-1.pptx
Article On Memantine-1.pptxArticle On Memantine-1.pptx
Article On Memantine-1.pptx
 
Transition from methylphenidate or amphetamine to atomoxetine in children and...
Transition from methylphenidate or amphetamine to atomoxetine in children and...Transition from methylphenidate or amphetamine to atomoxetine in children and...
Transition from methylphenidate or amphetamine to atomoxetine in children and...
 
Literature Review Paper
Literature Review PaperLiterature Review Paper
Literature Review Paper
 
Addictive Behaviors, Vol. 25, No. 3, pp. 441–443, 2000Copy.docx
Addictive Behaviors, Vol. 25, No. 3, pp. 441–443, 2000Copy.docxAddictive Behaviors, Vol. 25, No. 3, pp. 441–443, 2000Copy.docx
Addictive Behaviors, Vol. 25, No. 3, pp. 441–443, 2000Copy.docx
 
introductiontopharmacoepidemiology-230613144442-c713d639.pdf
introductiontopharmacoepidemiology-230613144442-c713d639.pdfintroductiontopharmacoepidemiology-230613144442-c713d639.pdf
introductiontopharmacoepidemiology-230613144442-c713d639.pdf
 
INTRODUCTION TO PHARMACOEPIDEMIOLOGY.pptx
INTRODUCTION TO PHARMACOEPIDEMIOLOGY.pptxINTRODUCTION TO PHARMACOEPIDEMIOLOGY.pptx
INTRODUCTION TO PHARMACOEPIDEMIOLOGY.pptx
 
Weissman_GerPsych
Weissman_GerPsychWeissman_GerPsych
Weissman_GerPsych
 

More from willcoxjanay

Critical Response Rubric Category 0 1 1.5 2 Timelin.docx
Critical Response Rubric Category 0 1 1.5 2 Timelin.docxCritical Response Rubric Category 0 1 1.5 2 Timelin.docx
Critical Response Rubric Category 0 1 1.5 2 Timelin.docxwillcoxjanay
 
Critical Response Rubric- Please view the videos provided on Asha De.docx
Critical Response Rubric- Please view the videos provided on Asha De.docxCritical Response Rubric- Please view the videos provided on Asha De.docx
Critical Response Rubric- Please view the videos provided on Asha De.docxwillcoxjanay
 
Critical Reflective AnalysisIn developing your genogram and learni.docx
Critical Reflective AnalysisIn developing your genogram and learni.docxCritical Reflective AnalysisIn developing your genogram and learni.docx
Critical Reflective AnalysisIn developing your genogram and learni.docxwillcoxjanay
 
Critical Reflection Projectzzz.docx
Critical Reflection Projectzzz.docxCritical Reflection Projectzzz.docx
Critical Reflection Projectzzz.docxwillcoxjanay
 
Critical reflection on the reading from Who Speaks for Justice, .docx
Critical reflection on the reading from Who Speaks for Justice, .docxCritical reflection on the reading from Who Speaks for Justice, .docx
Critical reflection on the reading from Who Speaks for Justice, .docxwillcoxjanay
 
Critical Reflection ExerciseStudents are expected to have co.docx
Critical Reflection ExerciseStudents are expected to have co.docxCritical Reflection ExerciseStudents are expected to have co.docx
Critical Reflection ExerciseStudents are expected to have co.docxwillcoxjanay
 
Critical Reading StrategiesThe University of Minnesota published.docx
Critical Reading StrategiesThe University of Minnesota published.docxCritical Reading StrategiesThe University of Minnesota published.docx
Critical Reading StrategiesThe University of Minnesota published.docxwillcoxjanay
 
Critical Qualitative Research Designpages 70–76Related to un.docx
Critical Qualitative Research Designpages 70–76Related to un.docxCritical Qualitative Research Designpages 70–76Related to un.docx
Critical Qualitative Research Designpages 70–76Related to un.docxwillcoxjanay
 
Critical InfrastructuresThe U.S. Department of Homeland Security h.docx
Critical InfrastructuresThe U.S. Department of Homeland Security h.docxCritical InfrastructuresThe U.S. Department of Homeland Security h.docx
Critical InfrastructuresThe U.S. Department of Homeland Security h.docxwillcoxjanay
 
Critical Infrastructure Protection Discussion Questions How.docx
Critical Infrastructure Protection Discussion Questions How.docxCritical Infrastructure Protection Discussion Questions How.docx
Critical Infrastructure Protection Discussion Questions How.docxwillcoxjanay
 
Critical InfrastructuresIn terms of critical infrastructure and ke.docx
Critical InfrastructuresIn terms of critical infrastructure and ke.docxCritical InfrastructuresIn terms of critical infrastructure and ke.docx
Critical InfrastructuresIn terms of critical infrastructure and ke.docxwillcoxjanay
 
Critical Infrastructure Case StudyPower plants are an important .docx
Critical Infrastructure Case StudyPower plants are an important .docxCritical Infrastructure Case StudyPower plants are an important .docx
Critical Infrastructure Case StudyPower plants are an important .docxwillcoxjanay
 
Critical Infrastructure and a CyberattackPresidential Decisi.docx
Critical Infrastructure and a CyberattackPresidential Decisi.docxCritical Infrastructure and a CyberattackPresidential Decisi.docx
Critical Infrastructure and a CyberattackPresidential Decisi.docxwillcoxjanay
 
Critical Incident Protection (CIP)Plans need to have your name o.docx
Critical Incident Protection (CIP)Plans need to have your name o.docxCritical Incident Protection (CIP)Plans need to have your name o.docx
Critical Incident Protection (CIP)Plans need to have your name o.docxwillcoxjanay
 
Critical Evaluation of Qualitative or Quantitative Research Stud.docx
Critical Evaluation of Qualitative or Quantitative Research Stud.docxCritical Evaluation of Qualitative or Quantitative Research Stud.docx
Critical Evaluation of Qualitative or Quantitative Research Stud.docxwillcoxjanay
 
Critical Analysis of Phillips argument in her essay Zombie Studies.docx
Critical Analysis of Phillips argument in her essay Zombie Studies.docxCritical Analysis of Phillips argument in her essay Zombie Studies.docx
Critical Analysis of Phillips argument in her essay Zombie Studies.docxwillcoxjanay
 
Critical Appraisal Process for Quantitative ResearchAs you cri.docx
Critical Appraisal Process for Quantitative ResearchAs you cri.docxCritical Appraisal Process for Quantitative ResearchAs you cri.docx
Critical Appraisal Process for Quantitative ResearchAs you cri.docxwillcoxjanay
 
CriteriaExcellentSuperiorGoodWork neededFailingIntrodu.docx
CriteriaExcellentSuperiorGoodWork neededFailingIntrodu.docxCriteriaExcellentSuperiorGoodWork neededFailingIntrodu.docx
CriteriaExcellentSuperiorGoodWork neededFailingIntrodu.docxwillcoxjanay
 
Critical analysis of primary literature - PracticePurposeThis.docx
Critical analysis of primary literature - PracticePurposeThis.docxCritical analysis of primary literature - PracticePurposeThis.docx
Critical analysis of primary literature - PracticePurposeThis.docxwillcoxjanay
 
Critical analysis of one relevant curriculum approach or model..docx
Critical analysis of one relevant curriculum approach or model..docxCritical analysis of one relevant curriculum approach or model..docx
Critical analysis of one relevant curriculum approach or model..docxwillcoxjanay
 

More from willcoxjanay (20)

Critical Response Rubric Category 0 1 1.5 2 Timelin.docx
Critical Response Rubric Category 0 1 1.5 2 Timelin.docxCritical Response Rubric Category 0 1 1.5 2 Timelin.docx
Critical Response Rubric Category 0 1 1.5 2 Timelin.docx
 
Critical Response Rubric- Please view the videos provided on Asha De.docx
Critical Response Rubric- Please view the videos provided on Asha De.docxCritical Response Rubric- Please view the videos provided on Asha De.docx
Critical Response Rubric- Please view the videos provided on Asha De.docx
 
Critical Reflective AnalysisIn developing your genogram and learni.docx
Critical Reflective AnalysisIn developing your genogram and learni.docxCritical Reflective AnalysisIn developing your genogram and learni.docx
Critical Reflective AnalysisIn developing your genogram and learni.docx
 
Critical Reflection Projectzzz.docx
Critical Reflection Projectzzz.docxCritical Reflection Projectzzz.docx
Critical Reflection Projectzzz.docx
 
Critical reflection on the reading from Who Speaks for Justice, .docx
Critical reflection on the reading from Who Speaks for Justice, .docxCritical reflection on the reading from Who Speaks for Justice, .docx
Critical reflection on the reading from Who Speaks for Justice, .docx
 
Critical Reflection ExerciseStudents are expected to have co.docx
Critical Reflection ExerciseStudents are expected to have co.docxCritical Reflection ExerciseStudents are expected to have co.docx
Critical Reflection ExerciseStudents are expected to have co.docx
 
Critical Reading StrategiesThe University of Minnesota published.docx
Critical Reading StrategiesThe University of Minnesota published.docxCritical Reading StrategiesThe University of Minnesota published.docx
Critical Reading StrategiesThe University of Minnesota published.docx
 
Critical Qualitative Research Designpages 70–76Related to un.docx
Critical Qualitative Research Designpages 70–76Related to un.docxCritical Qualitative Research Designpages 70–76Related to un.docx
Critical Qualitative Research Designpages 70–76Related to un.docx
 
Critical InfrastructuresThe U.S. Department of Homeland Security h.docx
Critical InfrastructuresThe U.S. Department of Homeland Security h.docxCritical InfrastructuresThe U.S. Department of Homeland Security h.docx
Critical InfrastructuresThe U.S. Department of Homeland Security h.docx
 
Critical Infrastructure Protection Discussion Questions How.docx
Critical Infrastructure Protection Discussion Questions How.docxCritical Infrastructure Protection Discussion Questions How.docx
Critical Infrastructure Protection Discussion Questions How.docx
 
Critical InfrastructuresIn terms of critical infrastructure and ke.docx
Critical InfrastructuresIn terms of critical infrastructure and ke.docxCritical InfrastructuresIn terms of critical infrastructure and ke.docx
Critical InfrastructuresIn terms of critical infrastructure and ke.docx
 
Critical Infrastructure Case StudyPower plants are an important .docx
Critical Infrastructure Case StudyPower plants are an important .docxCritical Infrastructure Case StudyPower plants are an important .docx
Critical Infrastructure Case StudyPower plants are an important .docx
 
Critical Infrastructure and a CyberattackPresidential Decisi.docx
Critical Infrastructure and a CyberattackPresidential Decisi.docxCritical Infrastructure and a CyberattackPresidential Decisi.docx
Critical Infrastructure and a CyberattackPresidential Decisi.docx
 
Critical Incident Protection (CIP)Plans need to have your name o.docx
Critical Incident Protection (CIP)Plans need to have your name o.docxCritical Incident Protection (CIP)Plans need to have your name o.docx
Critical Incident Protection (CIP)Plans need to have your name o.docx
 
Critical Evaluation of Qualitative or Quantitative Research Stud.docx
Critical Evaluation of Qualitative or Quantitative Research Stud.docxCritical Evaluation of Qualitative or Quantitative Research Stud.docx
Critical Evaluation of Qualitative or Quantitative Research Stud.docx
 
Critical Analysis of Phillips argument in her essay Zombie Studies.docx
Critical Analysis of Phillips argument in her essay Zombie Studies.docxCritical Analysis of Phillips argument in her essay Zombie Studies.docx
Critical Analysis of Phillips argument in her essay Zombie Studies.docx
 
Critical Appraisal Process for Quantitative ResearchAs you cri.docx
Critical Appraisal Process for Quantitative ResearchAs you cri.docxCritical Appraisal Process for Quantitative ResearchAs you cri.docx
Critical Appraisal Process for Quantitative ResearchAs you cri.docx
 
CriteriaExcellentSuperiorGoodWork neededFailingIntrodu.docx
CriteriaExcellentSuperiorGoodWork neededFailingIntrodu.docxCriteriaExcellentSuperiorGoodWork neededFailingIntrodu.docx
CriteriaExcellentSuperiorGoodWork neededFailingIntrodu.docx
 
Critical analysis of primary literature - PracticePurposeThis.docx
Critical analysis of primary literature - PracticePurposeThis.docxCritical analysis of primary literature - PracticePurposeThis.docx
Critical analysis of primary literature - PracticePurposeThis.docx
 
Critical analysis of one relevant curriculum approach or model..docx
Critical analysis of one relevant curriculum approach or model..docxCritical analysis of one relevant curriculum approach or model..docx
Critical analysis of one relevant curriculum approach or model..docx
 

Recently uploaded

भारत-रोम व्यापार.pptx, Indo-Roman Trade,
भारत-रोम व्यापार.pptx, Indo-Roman Trade,भारत-रोम व्यापार.pptx, Indo-Roman Trade,
भारत-रोम व्यापार.pptx, Indo-Roman Trade,Virag Sontakke
 
Introduction to AI in Higher Education_draft.pptx
Introduction to AI in Higher Education_draft.pptxIntroduction to AI in Higher Education_draft.pptx
Introduction to AI in Higher Education_draft.pptxpboyjonauth
 
Introduction to ArtificiaI Intelligence in Higher Education
Introduction to ArtificiaI Intelligence in Higher EducationIntroduction to ArtificiaI Intelligence in Higher Education
Introduction to ArtificiaI Intelligence in Higher Educationpboyjonauth
 
Presiding Officer Training module 2024 lok sabha elections
Presiding Officer Training module 2024 lok sabha electionsPresiding Officer Training module 2024 lok sabha elections
Presiding Officer Training module 2024 lok sabha electionsanshu789521
 
“Oh GOSH! Reflecting on Hackteria's Collaborative Practices in a Global Do-It...
“Oh GOSH! Reflecting on Hackteria's Collaborative Practices in a Global Do-It...“Oh GOSH! Reflecting on Hackteria's Collaborative Practices in a Global Do-It...
“Oh GOSH! Reflecting on Hackteria's Collaborative Practices in a Global Do-It...Marc Dusseiller Dusjagr
 
Interactive Powerpoint_How to Master effective communication
Interactive Powerpoint_How to Master effective communicationInteractive Powerpoint_How to Master effective communication
Interactive Powerpoint_How to Master effective communicationnomboosow
 
KSHARA STURA .pptx---KSHARA KARMA THERAPY (CAUSTIC THERAPY)————IMP.OF KSHARA ...
KSHARA STURA .pptx---KSHARA KARMA THERAPY (CAUSTIC THERAPY)————IMP.OF KSHARA ...KSHARA STURA .pptx---KSHARA KARMA THERAPY (CAUSTIC THERAPY)————IMP.OF KSHARA ...
KSHARA STURA .pptx---KSHARA KARMA THERAPY (CAUSTIC THERAPY)————IMP.OF KSHARA ...M56BOOKSTORE PRODUCT/SERVICE
 
Solving Puzzles Benefits Everyone (English).pptx
Solving Puzzles Benefits Everyone (English).pptxSolving Puzzles Benefits Everyone (English).pptx
Solving Puzzles Benefits Everyone (English).pptxOH TEIK BIN
 
EPANDING THE CONTENT OF AN OUTLINE using notes.pptx
EPANDING THE CONTENT OF AN OUTLINE using notes.pptxEPANDING THE CONTENT OF AN OUTLINE using notes.pptx
EPANDING THE CONTENT OF AN OUTLINE using notes.pptxRaymartEstabillo3
 
CELL CYCLE Division Science 8 quarter IV.pptx
CELL CYCLE Division Science 8 quarter IV.pptxCELL CYCLE Division Science 8 quarter IV.pptx
CELL CYCLE Division Science 8 quarter IV.pptxJiesonDelaCerna
 
18-04-UA_REPORT_MEDIALITERAСY_INDEX-DM_23-1-final-eng.pdf
18-04-UA_REPORT_MEDIALITERAСY_INDEX-DM_23-1-final-eng.pdf18-04-UA_REPORT_MEDIALITERAСY_INDEX-DM_23-1-final-eng.pdf
18-04-UA_REPORT_MEDIALITERAСY_INDEX-DM_23-1-final-eng.pdfssuser54595a
 
Incoming and Outgoing Shipments in 1 STEP Using Odoo 17
Incoming and Outgoing Shipments in 1 STEP Using Odoo 17Incoming and Outgoing Shipments in 1 STEP Using Odoo 17
Incoming and Outgoing Shipments in 1 STEP Using Odoo 17Celine George
 
Software Engineering Methodologies (overview)
Software Engineering Methodologies (overview)Software Engineering Methodologies (overview)
Software Engineering Methodologies (overview)eniolaolutunde
 
call girls in Kamla Market (DELHI) 🔝 >༒9953330565🔝 genuine Escort Service 🔝✔️✔️
call girls in Kamla Market (DELHI) 🔝 >༒9953330565🔝 genuine Escort Service 🔝✔️✔️call girls in Kamla Market (DELHI) 🔝 >༒9953330565🔝 genuine Escort Service 🔝✔️✔️
call girls in Kamla Market (DELHI) 🔝 >༒9953330565🔝 genuine Escort Service 🔝✔️✔️9953056974 Low Rate Call Girls In Saket, Delhi NCR
 
Meghan Sutherland In Media Res Media Component
Meghan Sutherland In Media Res Media ComponentMeghan Sutherland In Media Res Media Component
Meghan Sutherland In Media Res Media ComponentInMediaRes1
 
Organic Name Reactions for the students and aspirants of Chemistry12th.pptx
Organic Name Reactions  for the students and aspirants of Chemistry12th.pptxOrganic Name Reactions  for the students and aspirants of Chemistry12th.pptx
Organic Name Reactions for the students and aspirants of Chemistry12th.pptxVS Mahajan Coaching Centre
 
Enzyme, Pharmaceutical Aids, Miscellaneous Last Part of Chapter no 5th.pdf
Enzyme, Pharmaceutical Aids, Miscellaneous Last Part of Chapter no 5th.pdfEnzyme, Pharmaceutical Aids, Miscellaneous Last Part of Chapter no 5th.pdf
Enzyme, Pharmaceutical Aids, Miscellaneous Last Part of Chapter no 5th.pdfSumit Tiwari
 
DATA STRUCTURE AND ALGORITHM for beginners
DATA STRUCTURE AND ALGORITHM for beginnersDATA STRUCTURE AND ALGORITHM for beginners
DATA STRUCTURE AND ALGORITHM for beginnersSabitha Banu
 

Recently uploaded (20)

भारत-रोम व्यापार.pptx, Indo-Roman Trade,
भारत-रोम व्यापार.pptx, Indo-Roman Trade,भारत-रोम व्यापार.pptx, Indo-Roman Trade,
भारत-रोम व्यापार.pptx, Indo-Roman Trade,
 
Introduction to AI in Higher Education_draft.pptx
Introduction to AI in Higher Education_draft.pptxIntroduction to AI in Higher Education_draft.pptx
Introduction to AI in Higher Education_draft.pptx
 
Introduction to ArtificiaI Intelligence in Higher Education
Introduction to ArtificiaI Intelligence in Higher EducationIntroduction to ArtificiaI Intelligence in Higher Education
Introduction to ArtificiaI Intelligence in Higher Education
 
Presiding Officer Training module 2024 lok sabha elections
Presiding Officer Training module 2024 lok sabha electionsPresiding Officer Training module 2024 lok sabha elections
Presiding Officer Training module 2024 lok sabha elections
 
“Oh GOSH! Reflecting on Hackteria's Collaborative Practices in a Global Do-It...
“Oh GOSH! Reflecting on Hackteria's Collaborative Practices in a Global Do-It...“Oh GOSH! Reflecting on Hackteria's Collaborative Practices in a Global Do-It...
“Oh GOSH! Reflecting on Hackteria's Collaborative Practices in a Global Do-It...
 
Interactive Powerpoint_How to Master effective communication
Interactive Powerpoint_How to Master effective communicationInteractive Powerpoint_How to Master effective communication
Interactive Powerpoint_How to Master effective communication
 
KSHARA STURA .pptx---KSHARA KARMA THERAPY (CAUSTIC THERAPY)————IMP.OF KSHARA ...
KSHARA STURA .pptx---KSHARA KARMA THERAPY (CAUSTIC THERAPY)————IMP.OF KSHARA ...KSHARA STURA .pptx---KSHARA KARMA THERAPY (CAUSTIC THERAPY)————IMP.OF KSHARA ...
KSHARA STURA .pptx---KSHARA KARMA THERAPY (CAUSTIC THERAPY)————IMP.OF KSHARA ...
 
Solving Puzzles Benefits Everyone (English).pptx
Solving Puzzles Benefits Everyone (English).pptxSolving Puzzles Benefits Everyone (English).pptx
Solving Puzzles Benefits Everyone (English).pptx
 
EPANDING THE CONTENT OF AN OUTLINE using notes.pptx
EPANDING THE CONTENT OF AN OUTLINE using notes.pptxEPANDING THE CONTENT OF AN OUTLINE using notes.pptx
EPANDING THE CONTENT OF AN OUTLINE using notes.pptx
 
Model Call Girl in Tilak Nagar Delhi reach out to us at 🔝9953056974🔝
Model Call Girl in Tilak Nagar Delhi reach out to us at 🔝9953056974🔝Model Call Girl in Tilak Nagar Delhi reach out to us at 🔝9953056974🔝
Model Call Girl in Tilak Nagar Delhi reach out to us at 🔝9953056974🔝
 
CELL CYCLE Division Science 8 quarter IV.pptx
CELL CYCLE Division Science 8 quarter IV.pptxCELL CYCLE Division Science 8 quarter IV.pptx
CELL CYCLE Division Science 8 quarter IV.pptx
 
18-04-UA_REPORT_MEDIALITERAСY_INDEX-DM_23-1-final-eng.pdf
18-04-UA_REPORT_MEDIALITERAСY_INDEX-DM_23-1-final-eng.pdf18-04-UA_REPORT_MEDIALITERAСY_INDEX-DM_23-1-final-eng.pdf
18-04-UA_REPORT_MEDIALITERAСY_INDEX-DM_23-1-final-eng.pdf
 
Incoming and Outgoing Shipments in 1 STEP Using Odoo 17
Incoming and Outgoing Shipments in 1 STEP Using Odoo 17Incoming and Outgoing Shipments in 1 STEP Using Odoo 17
Incoming and Outgoing Shipments in 1 STEP Using Odoo 17
 
Software Engineering Methodologies (overview)
Software Engineering Methodologies (overview)Software Engineering Methodologies (overview)
Software Engineering Methodologies (overview)
 
call girls in Kamla Market (DELHI) 🔝 >༒9953330565🔝 genuine Escort Service 🔝✔️✔️
call girls in Kamla Market (DELHI) 🔝 >༒9953330565🔝 genuine Escort Service 🔝✔️✔️call girls in Kamla Market (DELHI) 🔝 >༒9953330565🔝 genuine Escort Service 🔝✔️✔️
call girls in Kamla Market (DELHI) 🔝 >༒9953330565🔝 genuine Escort Service 🔝✔️✔️
 
Meghan Sutherland In Media Res Media Component
Meghan Sutherland In Media Res Media ComponentMeghan Sutherland In Media Res Media Component
Meghan Sutherland In Media Res Media Component
 
Organic Name Reactions for the students and aspirants of Chemistry12th.pptx
Organic Name Reactions  for the students and aspirants of Chemistry12th.pptxOrganic Name Reactions  for the students and aspirants of Chemistry12th.pptx
Organic Name Reactions for the students and aspirants of Chemistry12th.pptx
 
Enzyme, Pharmaceutical Aids, Miscellaneous Last Part of Chapter no 5th.pdf
Enzyme, Pharmaceutical Aids, Miscellaneous Last Part of Chapter no 5th.pdfEnzyme, Pharmaceutical Aids, Miscellaneous Last Part of Chapter no 5th.pdf
Enzyme, Pharmaceutical Aids, Miscellaneous Last Part of Chapter no 5th.pdf
 
DATA STRUCTURE AND ALGORITHM for beginners
DATA STRUCTURE AND ALGORITHM for beginnersDATA STRUCTURE AND ALGORITHM for beginners
DATA STRUCTURE AND ALGORITHM for beginners
 
OS-operating systems- ch04 (Threads) ...
OS-operating systems- ch04 (Threads) ...OS-operating systems- ch04 (Threads) ...
OS-operating systems- ch04 (Threads) ...
 

Trends in Psychotropic Medication Costsfor Children and Adol.docx

  • 1. Trends in Psychotropic Medication Costs for Children and Adolescents, 1997-2000 Andrés Martin, MD, MPH; Douglas Leslie, PhD Objective: To examine trends in psychotropic medi- cation utilization and costs for children and adolescents between January 1, 1997, and December 31, 2000. Methods: Pharmacy claims were analyzed for mental health users 17 years and younger (N = 83 039) from a national database covering 1.74 million privately in- sured youths. Utilization rates and costs for dispensed medications were compared across psychotropic drug cat- egories and individual agents over time. Results: Overall use of psychotropic drugs increased from 59.5% of mental health outpatients in 1997 (a 1-year prevalence of 28.7 per 1000) to 62.3% in 2000 (33.7 per 1000), a 4.7% increase. The largest changes in utiliza- tion were seen for atypical antipsychotics (138.4%), atypi- cal antidepressants (42.8%), and selective serotonin re- uptake inhibitors (18.8%). The average prescription price increased by 17.6% ($7.90 per prescription), a change in turn attributed to a shift toward costlier medications within the same category (55.1% of the increase, or $4.35) and to pure inflation (44.9% of the increase, or $3.55; P for trend �.001 for all comparisons). Almost half (46.7%) of the $2.7 million gross sales differential was accounted for by only 3 of the 39 drugs identified (am- phetamine compound, risperidone, and sertraline), and 75% was accounted for by 7 drugs (the previous 3 and
  • 2. bupropion, paroxetine, venlafaxine, and citalopram). Conclusions: Psychotropic drug expenditure increases during the late 1990s resulted from more youths being prescribed drugs, a preference for newer and costlier medi- cations, and the net effects of inflation. The impact of man- aged care and pharmaceutical marketing effects on these trends warrants further study. Arch Pediatr Adolesc Med. 2003;157:997-1004 T HE USE of psychotropic medications in children has become a highly visible is- sue, receiving regular at- tention from academics (for a recent summary, see Jensen et al1), poli- cymakers,2,3 and the lay press alike.4-6 In contrast to the controversial and at times charged reactions that the topic can en- gender, reliable national estimates of the extent of pediatric use of psychotropic drugs have only recently started to be- come available.7-9 Previous studies10,11 have documented that most psychotropic medi- cations are not prescribed by mental health specialists but rather by general practi- tioners, a pattern that is certainly appli- cable to stimulants, the most widely used psychotropic drug class for children: in 1995, pediatricians prescribed 50% of stimulants, family practitioners 20%, and psychiatrists only 13%.8
  • 3. The financial implications of pediat- ric pharmacotherapy have gone largely un- examined, an important shortcoming given that in the US expenditures for prescrip- tion drugs have continued to be the fastest growing component of health care across all ages.12 The financial burden of medica- tion-related expenditures is substantial: whereas overall health costs increased by 7% in 2000, prescription drug spending grew by 15%. For example, Medicaid spend- ing on prescription drugs more than tripled in the 1990s, from $4.8 billion (6.6% of total Medicaid costs) in 1990 to $17.0 billion (9.4% of total Medicaid costs) in 1999.13 The most recent national data on men- tal health utilization and costs specific for children and adolescents are from 1998,14 when overall national expenditures were es- timated to be $11.7 billion ($172 per child). Outpatient services accounted for 57% of the total costs, inpatient services for 33%, and psychotropic drugs for 9%. A study based on privately insured youths15 showed that during the same interval (1997 to 2000) that outpatient and inpatient psychiatric costs for American youths decreased (by 18.4% and 14.4%, respectively), medica- tion-related expenditures increased by 12.1%. Although it is plausible that higher psychotropic drug use may relate to cost savings in overall mental health services (by decreasing or obviating the need for other
  • 4. services, such as psychotherapy), no pedi- ARTICLE From the Child Study Center (Dr Martin) and the Departments of Psychiatry and Epidemiology and Public Health (Dr Leslie), Yale University School of Medicine, New Haven, Conn; and the Northeast Program Evaluation Center, West Haven, Conn (Dr Leslie). Dr Martin has received honoraria from Janssen Pharmaceuticals and Alza Corp and has been involved in an industry-sponsored clinical trial for Bristol-Myers Squibb. Dr Leslie has served as a consultant to Pfizer and Purdue Pharmaceuticals and has received grants from Bristol-Myers Squibb and AstraZeneca. (REPRINTED) ARCH PEDIATR ADOLESC MED/ VOL 157, OCT 2003 WWW.ARCHPEDIATRICS.COM 997 ©2003 American Medical Association. All rights reserved. atric cost-benefit studies have empirically addressed this possibility, to our knowledge.
  • 5. Both of the cited studies14,15 analyzed aggregate psy- chotropic medication expenditures and did not provide information on the drug classes or specific agents re- sponsible for driving cost changes. It is against this back- drop that this study aims to describe the main drivers un- derlying psychotropic medication cost changes at the level of drug classes and specific agents involved. METHODS STUDY DESIGN A cross-sectional design for each of 4 years (1997-2000) was used to characterize psychotropic medication utilization and cost trends for youths 17 years and younger. DATA SOURCE We used a research database (MarketScan; Medstat, Ann Arbor, Mich) to describe patterns of health care utilization and costs. The database, a publicly available fee-for-service medical and pre- scription claims resource, contains claims information for indi- viduals nationwide who are insured through the benefit plans of large employers and includes more than 200 different insur- ance companies. The working sample consisted of all individu- als in the database 17 years and younger who had a claim for mental health services and possible pharmacy claims data avail- able during the study (N = 83 039). We specifically did not ex- clude children younger than 3 years, as there is epidemiologic evidence for increasing rates of psychotropic medication use in this age group.16,17 Demographic information on the entire en- rolled population (N = 1 735 486) was also available. Individual information was stripped of any personal identifiers, stored anony-
  • 6. mously, and exclusively referenced through study-specific unique identifiers following published guidelines.18 STUDY POPULATION AND PROCEDURES The number and 1-year prevalence of enrolled children receiv- ing mental health services and psychotropic medications were calculated. Mental health claims were defined as those with a di- agnosis within the 290.00 to 319.99 range of International Clas- sification of Diseases, Ninth Revision, codes. Potentially relevant codes (eg, 799.2 for “nervousness” or 780.5 for “sleep distur- bance”) were not included, in keeping with earlier methods.15 In contrast to that earlier study,15 in which individual youths were the primary unit of analysis, this study focuses on prescrip- tions. Thus, sociodemographic and diagnostic trends seen dur- ing the study (such as an increase in the diagnosis of bipolar dis- order) are examined in detail in that complementary study.15 Psychotropic medications were identified on the basis of a comprehensive National Drug Code registry and were assigned to 1 of 6 drug classes: (1) �-agonists, (2) antidepressants, (3) antipsychotics, (4) mood stabilizers, (5) stimulants, and (6) anx- iolytics and sedative-hypnotics. Antihistamines (including hy- droxyzine hydrochloride), �-blockers, and anticholinergic agents were specifically excluded from analysis given the potential for ambiguity in determining their use as psychotropic agents. Charges associated with pharmacy claims were measured as the actual paid amounts instead of the billed charges to pro-
  • 7. vide a more accurate measure of cost. Paid amounts included patient payments (deductibles or copayments) and payments made by the patient’s insurance plan(s). Costs were adjusted for inflation using the medical care component of the Consumer Price Index, with all amounts expressed as 1997 dollars. After calculating costs for psychotropic medications as an aggregate annual amount, costs were estimated across psycho- tropic drug category and specific agent. Costs were estimated as overall and per-prescription amounts. Each drug’s share of utilization was then calculated by dividing the number of pre- scriptions filled by (1) the number of all prescriptions in that category and (2) the overall number of prescriptions filled in that year. Each drug’s share of overall and class-specific utili- zation, as well as mean prescription price, was compared across the 4 years of study. Next, the gross difference in psychotropic drug sales was calculated between 2000 and 1997, and the proportion of the total difference attributable to each medication category and each individual agent was determined. Each drug’s attribut- able proportion served as a weighting factor by which change in price and change in category utilization was multiplied. By summing the weighted price changes, an overall estimate of the impact of medication inflation was obtained; a measure of medi- cation shift (from one agent to another within the same cat- egory) was similarly arrived at by summing the weighted uti- lization changes. The fraction of overall psychotropic drug sales that could be attributed to an increase in the number of pre- scriptions filled was calculated by multiplying the difference in the number of prescriptions by the mean prescription price across the first and last study years. This amount, in turn, was divided into portions attributable to (1) larger membership en- rollment, (2) changing proportion of medicated enrollees, and (3) enrollees continuing drug treatment for longer periods.
  • 8. DATA ANALYSIS Linear trends over time were assessed for categorical variables by using the Cochran Mantel-Haenszel �2 test (df = 1) and for continuous variables by using general linear models (df = 3). Cost trends were calculated based on log-transformed amounts. RESULTS POPULATION CHARACTERISTICS Demographic and clinical characteristics of outpatient men- tal health users in this study group have been described in detail previously.15 Briefly, of 352 413 individuals 17 years and younger with linked pharmacy data who were en- rolled in 1997, 17 670 (5.0%) received outpatient mental health services vs 26 677 (5.6%) of 473 954 in 2000, rep- resenting a 34.5% increase in membership enrollment and a 12.2% increase in outpatient mental health utilization rates. PATTERNS OF PSYCHOTROPIC MEDICATION USE More than half of all outpatient users (60.1% across the 4 study years) were prescribed at least 1 psychotropic medi- cation during any given year. Table 1 gives the 1-year prevalence of psychotropic drug use across the various medi- cation categories. In addition to giving the proportions of outpatient mental health users dispensed psychotropic agents, 1-year prevalence per 1000 enrollees are also given, using the number of annual enrollees with pharmacy ben- efits as the denominator. The overall use of psychotropic drugs increased from 59.5% of mental health outpatients in 1997 (a 1-year prevalence of 28.7 per 1000) to 62.3% in
  • 9. 2000 (33.7 per 1000), representing a 4.7% increase. The largest increases in utilization were seen for atypical anti- psychotics (138.4%), other antidepressants (42.8%), and (REPRINTED) ARCH PEDIATR ADOLESC MED/ VOL 157, OCT 2003 WWW.ARCHPEDIATRICS.COM 998 ©2003 American Medical Association. All rights reserved. selective serotonin reuptake inhibitors (SSRIs) (18.8%). All categories had an increase in utilization, except for typical antipsychotics (–58.4%) and tricyclic antidepressants (TCAs) (–41.5%). Although the proportion of outpa- tients dispensed stimulants remained steady at 39% (P=.14), the prevalence of stimulant use at the enrollee level in- creased over time, increasing from 19.4 to 21.8 per 1000 (P�.001). Except for stimulants and �-agonists, all classes had statistically significant changes in utilization (Table 1). AGGREGATE PSYCHOTROPIC MEDICATION EXPENDITURES AND USE Table 2 reports aggregate medication use and expen- ditures. Gross expenditures increased from $4.1 mil- lion in 1997 to $6.8 million in 2000, a 65.2% increase. The increase represents more than just a larger enroll- ment base, as evidenced by the fact that psychotropic drug expenditures per enrollee increased by 22.8%. During this time, the average prescription increased in price by 17.6% ($7.90 per prescription) (P for trend �.001). Although 46.7% more prescriptions were filled in 2000, individu- als were, on average, dispensed fewer prescriptions an- nually (8.1 vs 8.7 in 1997; P for trend �.001), suggest-
  • 10. ing that most additional prescriptions were for children continuing psychotropic drug therapy for longer peri- ods or for newly treated youngsters. CATEGORY-SPECIFIC PSYCHOTROPIC MEDICATION EXPENDITURES AND USE Table 3 presents the costs and clinical share (overall and by category) of all psychotropic medications identified. As anticipated, stimulants were the most commonly pre- scribed class, accounting for 45.6% of all psychotropic pre- scriptions in 2000. Despite the large volume of stimulant prescriptions filled, they represented a relative reduction (–14.4%) from the 1997 total share, a reflection of the rapid rise in the prescription of other nonstimulant medica- tions to this age group, notably, antidepressants and mood stabilizers. Indeed, antidepressants increased their share of all psychotropic drug prescriptions by 16.5%, a mean change that does not capture the wide variability seen across subcategories: the atypical antidepressant and SSRI shares increased by 61.4% and 27.9%, respectively, compared with the large reduction (–51.4%) seen for TCAs. Mood stabi- lizers had an increase in their share (13.7%) and ac- counted for a larger volume of psychotropic prescrip- tions (8.6% in 2000) than did antipsychotics (5.7%). The latter experienced a radical shift from traditional to atypi- Table 1. Psychotropic Medication Prevalence by Drug Category Among MarketScan* Enrollees Aged 0 to 17 Years Psychotropic Drug Category No. (%) per 1000 Enrollees Change in Proportion
  • 11. 1997 (n = 17 670) 2000 (n = 26 677) % �21† P for Trend Any 10 516 (59.5) 28.7 16 622 (62.3) 33.7 4.7 56.55 �.001 �-Agonists 818 (4.6) 2.3 1207 (4.5) 2.6 −2.3 0.20 .65 Antidepressants 4409 (25.0) 12.5 7480 (28.0) 15.8 12.4 61.80 �.001 SSRIs 2932 (16.6) 8.3 5257 (19.7) 11.1 18.8 82.02 �.001 TCAs 1053 (6.0) 3.0 930 (3.5) 2.0 −41.5 157.12 �.001 Other 1237 (7.0) 3.5 2667 (10.0) 5.6 42.8 115.11 �.001 Antipsychotics 565 (3.2) 1.6 1344 (5.0) 2.8 57.6 105.52 �.001 Atypical 329 (1.9) 0.9 1184 (4.4) 2.5 138.4 245.52 �.001 Typical 156 (0.9) 0.4 98 (0.4) 0.2 −58.4 46.29 �.001 Mood stabilizers 972 (5.5) 2.9 1660 (6.2) 3.5 13.1 10.66 .001 Stimulants 6845 (38.7) 19.4 10 345 (38.8) 21.8 0.1 2.18 .14 Anxiolytics 685 (3.9) 1.9 1162 (4.4) 2.5 12.4 5.38 .02 Abbreviations: SSRIs, selective serotonin reuptake inhibitors; TCAs, tricyclic antidepressants. *Medstat, Ann Arbor, Mich. †Cochran Mantel-Haenszel �2. Table 2. Aggregate Psychotropic Medication Expenditures and Use, 1997-2000* Variable 1997 2000 Year Effect Change, % F df †
  • 12. Psychotropic drug expenditures, $ 4 118 337 6 803 123 65.2 NA NA Prescriptions, No. 91 862 134 724 46.7 NA NA Enrollees, No. 352 413 473 954 34.5 NA NA Psychotropic drug expenditures per enrollee, mean, $ 11.7 14.4 22.8 NA NA Psychotropic drug expenditures per prescription, mean (SD), $‡ 45.1 (64.2) 53.0 (53.0) 17.6 505.82 429 188§ Annual prescriptions per medicated outpatient, mean (SD), No. 8.7 (8.8) 8.1 (8.3) −7.2 20.47 52 560§ Abbreviation: NA, not applicable. *All dollar amounts are adjusted for inflation and are expressed as 1997 equivalents. †Denominator df ; numerator df is 3. ‡For a 30-day supply; not adjusted for dose equivalence. §P for trend �.001. (REPRINTED) ARCH PEDIATR ADOLESC MED/ VOL 157, OCT 2003 WWW.ARCHPEDIATRICS.COM 999 ©2003 American Medical Association. All rights reserved. cal agents. In fact, atypical antipsychotics had the most pro- nounced change in their share of all psychotropic drug pre- scriptions (113.6%). Although no attempt was made to categorize anticonvulsants according to their primary in- dication (psychiatric vs neurologic), the possible effect of misclassification is small given that all patients in the da- tabase had a psychiatric condition and that non–mood sta- bilizing anticonvulsants (such as phenytoin) were ex- cluded from analysis.
  • 13. In addition to TCAs and traditional antipsychotics, several drugs had their category share eroded by newer and generally more expensive agents. The clearest case is that of stimulants, where methylphenidate hydrochlo- ride decreased its category share by 23.4%. The stimulant class balance was largely affected by the introduction in 1996 of amphetamine compound (Adderall; Shire Rich- wood US Inc, Florence, Ky), whose share grew to 27.3%, offsetting the declines in the use of dextroamphetamine sulfate (–1.1%) and pemoline (–2.8%). In a similar man- ner, the 7.7% decrease in fluoxetine’s share of the antide- pressants was offset by increases in the use of newer SS- RIs (including citalopram, introduced in 2000) and atypical antidepressants. The price of fluoxetine did not change sub- stantially (+5.3%), reflective of the fact that generic fluox- etine, introduced after the patent exclusivity of Prozac (Eli Lilly & Co, Indianapolis, Ind) expired on December 31, 2000, was not yet captured in the interval covered by this data set. Older mood stabilizers, such as lithium carbon- ate, carbamazepine, and valproate, in turn, had their class shares eroded by newer-generation anticonvulsants, which experienced the most turbulent prescription shifts of any agents. For example, the number of topiramate, gabapen- tin, and lamotrigine prescriptions increased by 13.6-, 6.4- and 3.3-fold, respectively. With few exceptions, most of the newly intro- duced agents were more expensive—at times signifi- cantly so—than those they were supplanting. For ex- ample, atypical antipsychotic drug costs per prescription were on average 3.8 times higher than those of their con- ventional counterparts; SSRIs and atypical antidepres- Table 3. Psychotropic Medication Expenditures and Use, by
  • 14. Drug Category, 1997-2000* Psychotropic Drug Category 1997 2000 Change in Share, %‡ Prescriptions Filled, No. Prescription Cost, Mean, $† Share, % Prescriptions Filled, No. Prescription Cost, Mean, $† Share, % Of Category Of All Prescriptions Of
  • 15. Category Of All Prescriptions Of Category Of All Prescriptions Stimulants Methylphenidate hydrochloride 38 092 35 78.2 41.7 32 081 35 54.8 25.0 −23.4§ −40.0§ Amphetamine compound 4699 33 9.6 5.1 21 619 39 36.9 16.9 27.3§ 227.5§ Dextroamphetamine sulfate 4016 30 8.2 4.4 4179 34 7.1 3.3 −1.1§ −25.9§ Pemoline 1917 65 3.9 2.1 647 73 1.1 0.5 −2.8§ −76.0§ Subtotal 48 724 36 100.0 53.4 58 526 36 100.0 45.6 NA −14.4§ Antidepressants SSRIs Sertraline hydrochloride
  • 16. 4340 73 17.1 4.8 8223 69 19.8 6.4 2.7§ 34.9§ Fluoxetine 6353 85 25.0 7.0 7183 89 17.3 5.6 −7.7§ −19.5§ Paroxetine 2819 65 11.1 3.1 5721 66 13.8 4.5 2.7§ 44.5§ Citalopram NA NA NA NA 2725 57 6.6 2.1 NA NA Fluvoxamine maleate 715 122 2.8 0.8 1717 116 4.1 1.3 1.3§ 71.0§ Subtotal 14 227 79 56.0 15.6 25 569 76 61.5 19.9 5.5§ 27.9§ Other Bupropion hydrochloride 3204 55 12.6 3.5 6288 64 15.1 4.9 2.5§ 39.7§ Venlafaxine hydrochloride 717 65 2.8 0.8 2840 79 6.8 2.2 4.0§ 182.0§ Mirtazapine 126 79 0.5 0.1 855 59 2.1 0.7 1.6§ 383.1§ Other atypical 1232 24 4.9 1.3 1984 25 4.8 1.5 −0.1 14.6§ Subtotal 5279 49 20.8 5.8 11 967 61 28.8 9.3 8.0§ 61.4§ TCAs Imipramine hydrochloride 3414 12 13.4 3.7 2140 14 5.1 1.7 −8.3§ −55.4§ Nortriptyline hydrochloride
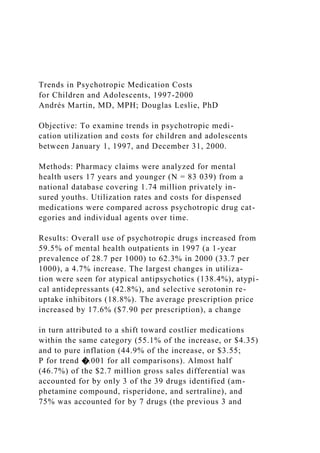
  • 17. 814 36 3.2 0.9 580 23 1.4 0.5 −1.8§ −49.3§ Clomipramine hydrochloride 531 56 2.1 0.6 406 47 1.0 0.3 −1.1§ −45.6§ Other TCA 1130 13 4.4 1.2 898 12 2.2 0.7 −2.3§ −43.4§ Subtotal 5889 20 23.2 6.4 4024 18 9.7 3.1 −13.5§ −51.4§ Subtotal 25 395 59 100.0 27.8 41 560 66 100.0 32.4 NA 16.5§ (continued) (REPRINTED) ARCH PEDIATR ADOLESC MED/ VOL 157, OCT 2003 WWW.ARCHPEDIATRICS.COM 1000 ©2003 American Medical Association. All rights reserved. sants were 4.1 and 3.4 times, respectively, more expen- sive than TCAs, and the price ratio between lamotrigine and lithium reached a high of 7.9. PSYCHOTROPIC MEDICATION SALES DIFFERENTIAL AND UNDERLYING FACTORS Figure 1 presents the gross differential in psychotropic drug sales between 1997 and 2000 as proportionally at- tributed to various psychotropic drug classes and indi- vidual agents. Antidepressants accounted for the largest fraction of the overall sales change (46.6%), with most of the share driven by SSRIs (30.6%). Antipsychotics fol- lowed as a category (21.1%), with virtually all change due
  • 18. to atypical agents. Other antidepressants, stimulants, and mood stabilizers accounted for a similar fraction each (ap- proximately 15%). Almost half of the overall sales differ- ential (46.7%) was accounted for by only 3 of the 39 drugs identified (amphetamine compound, risperidone, and ser- traline hydrochloride), and 75% by 7 drugs (the previous 3, together with bupropion hydrochloride, paroxetine, ven- lafaxine hydrochloride, and citalopram). Five of the 7 agents are antidepressants, and all of them are available only as brand name preparations given their recent introduction to the marketplace. The seemingly low share of the overall sales differen- tial accounted for by stimulants (14.5%) can be under- stood on the basis of the cost shift seen within the cat- Table 3. Psychotropic Medication Expenditures and Use, by Drug Category, 1997-2000* (cont) Psychotropic Drug Category 1997 2000 Change in Share, %‡ Prescriptions Filled, No. Prescription Cost, Mean, $† Share, %
  • 19. Prescriptions Filled, No. Prescription Cost, Mean, $† Share, % Of Category Of All Prescriptions Of Category Of All Prescriptions Of Category Of All Prescriptions Mood stabilizers Valproate 3533 57 50.9 3.9 5328 62 48.1 4.2 −2.8§ 7.4� Carbamazepine 1798 33 25.9 2.0 1988 33 17.9 1.5 −8.0§ −21.3§ Lithium 1238 16 17.8 1.4 1499 22 13.5 1.2 −4.3§ −13.8§ Gabapentin 192 79 2.8 0.2 1229 91 11.1 1.0 8.3§ 356.7§ Topiramate 43 95 0.6 0.0 586 150 5.3 0.5 4.9§ 870.1§ Lamotrigine 135 234 1.9 0.1 450 174 4.1 0.4 2.1§ 137.3§
  • 20. Subtotal 6939 48 100.0 7.6 11 080 64 100.0 8.6 NA 13.7§ Antipsychotics Atypical Risperidone 1616 110 50.9 1.8 4240 118 58.4 3.3 7.5§ 86.8§ Olanzapine 427 218 13.5 0.5 1167 189 16.1 0.9 2.6¶ 94.6§ Quetiapine fumarate 6 143 0.2 0.0 947 125 13.1 0.7 12.9§ NA Clozapine 125 230 3.9 0.1 170 134 2.3 0.1 1.6¶ −3.2 Subtotal 2174 138 68.5 2.4 6524 132 89.9 5.1 −21.4§ 113.6§ Typical Haloperidol 356 23 11.2 0.4 196 14 2.7 0.2 −8.5§ −60.8§ Pimozide 146 36 4.6 0.2 194 46 2.7 0.2 1.9§ −5.4 Thioridazine 345 13 10.9 0.4 168 16 2.3 0.1 −8.6§ −65.3§ Molindone hydrochloride 17 41 0.5 0.0 38 78 0.5 0.0 0.0 59.1 Other typical 136 27 4.3 0.1 136 58 1.9 0.1 2.4§ −28.8§ Subtotal 1000 22 31.5 1.1 732 34 10.1 0.6 −21.4§ −47.9§ Subtotal 3174 102 100.0 3.5 7256 123 100.0 5.7 NA 62.7§ Agonists Clonidine 3858 14 80.3 4.2 5093 14 77.1 4.0 −3.2§ −6.0§ Guanfacine hydrochloride 948 44 19.7 1.0 1512 37 22.9 1.2 3.2§ 13.5¶
  • 21. Subtotal 4806 20 100.0 5.3 6605 19 100.0 5.1 NA −2.2§ Anxiolytics Buspirone hydrochloride 762 79 33.3 0.8 1356 92 41.6 1.1 8.3§ 26.7§ Clonazepam 579 42 25.3 0.6 633 29 19.4 0.5 −5.9§ −22.2§ Lorazepam 314 50 13.7 0.3 367 54 11.2 0.3 −2.5¶ −16.8¶ Zolpidem tartrate 166 61 7.3 0.2 271 55 8.3 0.2 1.0 16.2 Other 468 26 20.4 0.5 636 39 19.5 0.5 −1.0 −3.3 Subtotal 2289 54 100.0 2.5 3263 62 100.0 2.5 NA 1.5§ Abbreviations: NA indicates not applicable; SSRIs, selective serotonin reuptake inhibitors; TCAs, tricyclic antidepressants. *All dollar amounts are adjusted for inflation and are expressed as 1997 equivalents. †For a 30-day supply; not adjusted for dose equivalence. ‡Significance tested by Cochran Mantel-Haenszel �21. §P�.001. �P�.05. ¶P�.01. (REPRINTED) ARCH PEDIATR ADOLESC MED/ VOL 157, OCT 2003 WWW.ARCHPEDIATRICS.COM 1001 ©2003 American Medical Association. All rights reserved. egory: the single largest increase of cost differential (25.3%) was that of amphetamine compound (Adderall), but it was largely offset by the 2 single largest decreases seen for the generic stimulants methylphenidate (–8.6%) and pemo-
  • 22. line (–2.9%). Although these opposing trends provide an- other line of evidence for the shift effect seen within this drug category, it is not exclusive to stimulants. Indeed, the shift toward newer and generally more expensive medica- tions can be conceptualized as one of the two drivers to prescription-related cost shifts over time. The other factor is “pure” price inflation, reflective of higher costs for the same medications due to cost increases at the manufac- turer, wholesale, retail, pharmacy, or all levels combined. Figure 2 depicts the various factors accounting for the increase in psychotropic drug expenditures. The larg- est component, responsible for 78.3% of the increment seen, is the volume of prescriptions filled, a change that can be attributed to a larger enrollment base (52.9%), to more medicated enrollees (17.5%), and to enrollees con- tinuing medication use for longer periods (8.7%). In ad- dition, prescription price changes, through shifts to newer medications and pure inflation, accounted for similar parts of the remaining portion: 11.3% and 9.6%, respectively. COMMENT In this study, data from a national group of privately in- sured children and adolescents were used to examine changes in psychotropic drug expenditures. We found that relatively few drugs accounted for a large portion of the change in psychotropic medication expenditures over time and that a combination of more drugs being prescribed, a preference for newer and costlier drugs, and the net effect of inflation had a compounded effect on price trends. Gross psychotropic drug expenditures for this sample showed a $2.7 million (65.2%) increase between 1997 and 2000. Most of that change (78.3%) was due to the large in-
  • 23. crease in the volume of prescriptions filled (46.7%). This finding is in keeping with the observation that, particu- larly after 1994, growth in utilization, rather than price, has been the primary driver of increased pharmaceutical spend- ing.19 In addition, a shift toward newer (and generally more By Class SSRIs Atypical APs Other ADs Stimulants Mood Stabilizers Anxiolytics α-Agonists Typical APs TCAs By Agent Amphetamine Compound Risperidone Sertraline Hydrochloride Bupropion Hydrochloride Paroxetine Venlafaxine Hydrochloride Citalopram All Others Olanzapine Valproate
  • 24. Quetiapine Fumarate Fluvoxamine Maleate Fluoxetine Gabapentin Topiramate Buspirone Hydrochloride Pemoline Methylphenidate Hydrochloride –10 – 5 2520151050 30 35 Attributed Proportion, % Figure 1. Psychotropic medication overall sales differential, 1997-2000. Totals by class and by agent sum to 100% ($2.7 million) each. SSRI indicates selective serotonin reuptake inhibitor; APs, antipsychotics; ADs, antidepressants; and TCAs, tricyclic antidepressants. 9.6% Price 2: Pure Inflation 11.3% Price 1: Shift Effect 8.7% Volume 3: Longer Time
  • 25. on Medication 17.5% Volume 2: Proportion of Medicated Enrollees 52.9% Volume 1: Membership Enrollment Figure 2. Prescription-related factors contributing to increased psychotropic drug expenditures, 1997-2000. The values are the percentages of the $2.7 million difference in gross sales (equivalent to a 65.2% increase in gross sales between 1997 and 2000). (REPRINTED) ARCH PEDIATR ADOLESC MED/ VOL 157, OCT 2003 WWW.ARCHPEDIATRICS.COM 1002 ©2003 American Medical Association. All rights reserved. expensive, brand name–only) agents and a pure inflation- ary effect explained almost one quarter of the price change. Expressed at the prescription level, at a time when the av- erage price increased by 17.6% (or $7.90 per prescrip- tion), it is estimated that 55.1% ($4.35) was attributable to the shift effect and 44.9% ($3.55) to pure inflation.
  • 26. The fact that the large number of new prescriptions did not lead to a parallel increase in the number of pre- scriptions per treated youth (a number that in fact de- creased slightly), combined with the constant rates of mul- tiple psychotropic pharmacotherapy20 seen (approximately 7.5 per 100 outpatients,21 data not shown), indicate that most of the additional prescriptions in 2000 were written for newly treated children. Stated alternatively, more in- dividual youths were initially given or continued taking for longer periods of time psychotropic medications rather than a growing number being medicated with multiple agents. A few psychotropic agents accounted for a dispro- portionate fraction of the observed cost shifts. Almost half of the overall sales differential (46.7%) was accounted for by only 3 individual drugs, and 25.3% was accounted for by amphetamine compound (Adderall) alone. Although the price ratio between amphetamine compound and meth- ylphenidate was low (1.1), a series of new, nongeneric stimulant preparations had only recently been intro- duced to the marketplace. Thus, these may be conserva- tive estimates of price differentials given that newer and more expensive agents that have gained stimulant market share since then (eg, Concerta [Alza Corp, Mountain View, Calif]) had not yet been introduced to market in 2000. Several factors may help explain the observed trends: 1. Improved newer products and an expanding evi- dence base. The virtual shifts from traditional to atypical antipsychotics, or from TCAs to SSRIs, are supported by a growing body of clinical trials specifically tailored to the pediatric population.22 As pertinent examples, random- ized controlled trials have documented the short-term efficacy in children and adolescents of the SSRIs parox- etine in major depression,23 sertraline in obsessive-
  • 27. compulsive disorder,24 and fluvoxamine in generalized anxiety disorder25 and of the atypical antipsychotic ris- peridone in the treatment of disruptive behaviors in chil- dren with subaverage intelligence26 or autism.27 2. Preference. Clinicians may have lower thresholds to prescribe medication for conditions amenable to phar- macologic treatment, especially when using newer agents with more favorable safety and adverse effect profiles that may not require as intense monitoring by specialists (eg, serum levels with lithium or electrocardiographic moni- toring with TCAs). Despite the steadily growing range of effective pharmacologic treatments for psychiatrically ill youths, a cautionary note is warranted, as clinicians may use more psychotropic agents in the context of fewer in- patient and outpatient resources to rely on; for example, the increase in the use of mood stabilizers to target bipolar and other externalizing disorders has limited underlying supportive evidence, particularly for newer-generation an- ticonvulsants.28 Moreover, there is a paucity of informa- tion regarding long-term effects on the developing brain of early and prolonged exposure to psychotropic drugs.29 3. Marketing pressures. Few truly new (ie, mecha- nistically distinct) agents have been introduced to the mar- ketplace during the past decade. Instead, variations of suc- cessful compounds are crowding an existing repertoire, a pattern that was most apparent for stimulants and SS- RIs. Pharmaceutical industry marketing-sales and mar- keting-research ratios have to be successively higher for newer agents to overcome the advantages of early mov- ers in the marketplace19: direct-to-consumer and direct- to-prescriber advertising practices have been an increas- ingly common mechanism for the pharmaceutical industry to gain market share for their products.30 The effects of
  • 28. these advertising practices on clinical practice are still poorly understood but are likely to be substantial, as sug- gested by the large shifts within category share occur- ring during the relatively short interval of this study. The public largely experiences (and pays for) the es- calating costs of their pharmaceuticals indirectly— through more expensive insurance premiums. Indeed, the generous pharmacy benefits typically associated with pri- vate insurance plans lead to increasing costs as consum- ers become “price insensitive” and request and feel en- titled to the latest (and more expensive) drugs.1 3 Conversely, the uninsured often pay the highest price for drugs, as they are not covered by copayments and they lack the bargaining clout that large insurers and pharmacies have to obtain medications at a discount.13 As a result, those who are insured take more medications and fill prescrip- tions more often, and the uninsured often go without nec- essary treatment. As a case in point, for the approxi- mately 1 in 6 children in the United States without health insurance, use of psychotropic agents remained far be- low that for those covered under public or private plans in 1996 (1.5%, 5.3%, and 4.1%, respectively).7 Such economic disparities, and the overall trends de- scribed herein, need to be considered in the context of potential cost savings, as it is plausible that effective phar- macotherapy may be related to reduced expenditures in other areas, such as hospitalization or outpatient costs. Similar to our earlier study,15 this descriptive study can- not provide the formal cost-benefit analyses that the field of pediatric psychopharmacology is in need of. This study has several shortcomings, including lim- ited generalizability. The psychotropic utilization rates
  • 29. reported herein (28.7 per 1000 in 1997) are signifi- cantly lower than recently published prevalence esti- mates derived from 1996 nationally representative samples (39 per 1000)7 or population-based analyses of regional community practices (59-63 per 1000).9 Although the ex- clusively privately insured nature of our study popula- tion can explain part of the difference in prevalence, the estimates presented herein are also lower than those of comparable employer-insured samples; for example, our 2000 prevalence for stimulant use (21.8 per 1000) is well below the 1999 rate of 26.5 per 1000 reported in a re- cent study.8 (SSRI prevalence rates were more similar across the two studies: 11.1 and 10.3 per 1000, respec- tively.) The prevalence estimates presented herein are in- tended as a general guide only, as MarketScan data are not obtained in any systematic or randomly stratified man- ner and are thus not intended to be epidemiologically rep- resentative. A second important limitation is the lack of information regarding quality of care, clinical out- comes, or patient satisfaction variables, which does not (REPRINTED) ARCH PEDIATR ADOLESC MED/ VOL 157, OCT 2003 WWW.ARCHPEDIATRICS.COM 1003 ©2003 American Medical Association. All rights reserved. allow for a full cost-benefit analysis of these findings. Third, the fact that prescription prices were not ad- justed for dosage equivalence may have resulted in bi- ased cost estimates, especially relevant to the calcula- tion of market share within given drug categories. Although real, the impact of such a factor is likely to be small and nondifferentially distributed across drugs.
  • 30. In conclusion, despite its limitations, this study docu- ments how a relatively few drugs accounted for a large por- tion of the change in psychotropic drug expenditures seen during this interval and how a combination of more youths being prescribed drugs, a preference for newer and cost- lier medications, and the net effect of inflation had a com- pounded effect on price trends. These results expand on earlier evidence of a shift toward medication-based men- tal health treatment modalities in children and adoles- cents. Future studies should further address the impact of managed care and pharmaceutical marketing effects on these trends of clinical care. Accepted for publication April 24, 2003. This study was supported in part by Scientist Career Development Award K01 MH01792 (Dr Martin); by grants M01 RR06022, 5P01 HD1DC35482, and 5P01 HD03008 from the Public Health Service; by Research Units on Pedi- atric Psychopharmacology contract MH97 CR0001 to Yale University; and by a grant from the Child Health and De- velopment Institute of Connecticut, Farmington. This work on the costs of child psychiatry is dedi- cated to our teacher and mentor, the late Donald J. Cohen, MD (1940-2001), who taught us so much about the values at the very core of our field. We thank Robert Rosenheck, MD, John Schowalter, MD, and James F. Leckman, MD, for their helpful comments on earlier drafts of this manuscript. Corresponding author: Andrés Martin, MD, MPH, Child Study Center, Yale University School of Medicine, 230 S Frontage Rd, PO Box 207900, New Haven, CT 06520 (e-mail:
  • 31. [email protected]). REFERENCES 1. Jensen PS, Edelman A, Nemeroff R. Pediatric psychopharmacoepidemiology: who is prescribing, and for whom, how, and why? In: Martin A, Scahill L, Charney DS, Leckman JF, eds. Pediatric Psychopharmacology: Principles and Practice. New York, NY: Oxford University Press; 2003:701-711. 2. Mental Health: A Report of the Surgeon General. Rockville, Md: US Dept of Health and Human Services, Substance Abuse and Mental Health Services Administra- tion, Center for Mental Health Services, National Institutes of Health, National Institute of Mental Health; 1999. 3. National Institute of Mental Health. Treatment of young children with mental con- ditions: White House Conference fact sheet, 2000. Available at: http://www.nimh .nih.gov/publicat/whmedchild.cfm. Accessed May 3, 2002. 4. Gibbs N. The age of Ritalin. Time. 1998; November 30:17- 19. 5. Kluger J. Next up: Prozac. Time. 1998; November 30:21. 6. Kalb C. Drugged out toddlers. Newsweek. 2000; March 6:15- 16. 7. Olfson M, Marcus SC, Weissman MM, Jensen PS. National trends in the use of psychotropic medications by children. J Am Acad Child Adolesc Psychiatry. 2002;
  • 32. 41:514-521. 8. Shatin D, Drinkard CR. Ambulatory use of psychotropics by employer-insured children and adolescents in a national managed care organization. Ambul Pedi- atr. 2002;2:111-119. 9. Zito JM, Safer DJ, DosReis S, et al. Psychotropic practice patterns for youth: a 10-year perspective. Arch Pediatr Adolesc Med. 2003;157:17- 25. 10. Zarin DA, Tanielian TL, Suarez AP, Marcus SC. Treatment of attention-deficit hy- peractivity disorder by different physician specialties [Datapoints]. Psychiatr Serv. 1998;49:171. 11. Wolraich ML, Lindgren S, Stromquist A, Milich R, Davis C, Watson D. Stimulant medication use by primary care physicians in the treatment of attention deficit hyperactivity disorder. Pediatrics. 1990;86:95-101. 12. National Institute for Health Care Management Research and Educational Foun- dation. Prescription drug expenditures in 2001: another year of escalating costs. Available at: http://www.nihcm.org/spending2001.pdf. Accessed May 5, 2002. 13. National Institute for Health Care Management Research and Educational Foun- dation. Prescription drug expenditures in 2000: the upward trend continues. Avail-
  • 33. able at: http://www.nihcm.org/spending2000.pdf. Accessed May 5, 2002. 14. Ringel JS, Sturm R. National estimates of mental health utilization and expen- ditures for children in 1998. J Behav Health Serv Res. 2001;28:319-333. 15. Martin A, Leslie D. Psychiatric inpatient, outpatient, and medication utilization and costs among privately insured youths, 1997-2000. Am J Psychiatry. 2003; 160:757-764. 16. Zito JM, Safer DJ, dosReis S, Gardner JF, Boles M, Lynch F. Trends in the prescrib- ing of psychotropic medications to preschoolers. JAMA. 2000;283:1025-1030. 17. Vitiello B. Psychopharmacology for young children: clinical needs and research opportunities. Pediatrics. 2001;108:983-989. 18. Simon GE, Unutzer J, Young BE, Pincus HA. Large medical databases, population- based research, and patient confidentiality. Am J Psychiatry. 2000;157:1731- 1737. 19. Berndt ER. The US pharmaceutical industry: why major growth in times of cost containment? Health Aff (Millwood). 2001;20:100-114. 20. Martin A, Van Hoof T, Stubbe D, Sherwin T, Scahill L. Multiple psychotropic phar- macotherapy among child and adolescent enrollees in
  • 34. Connecticut Medicaid man- aged care. Psychiatr Serv. 2003;54:72-77. 21. Martin A, Sherwin T, Stubbe D, Van Hoof T, Scahill L, Leslie D. Use of multiple psychotropic drugs by Medicaid-insured and privately insured children [Data- points]. Psychiatr Serv. 2002;53:1508. 22. Riddle MA, Kastelic EA, Frosch E. Pediatric psychopharmacology. J Child Psy- chol Psychiatry. 2001;42:73-90. 23. Keller MB, Ryan ND, Strober M, et al. Efficacy of paroxetine in the treatment of adolescent major depression: a randomized, controlled trial. J Am Acad Child Adolesc Psychiatry. 2001;40:762-772. 24. March JS, Biederman J, Wolkow R, et al. Sertraline in children and adolescents with obsessive-compulsive disorder: a multicenter randomized controlled trial. JAMA. 1998;280:1752-1756. 25. Fluvoxamine for the treatment of anxiety disorders in children and adolescents: the Research Unit on Pediatric Psychopharmacology Anxiety Study Group. N Engl J Med. 2001;344:1279-1285. 26. Aman MG, De Smedt G, Derivan A, Lyons B, Findling RL. Double-blind, placebo- controlled study of risperidone for the treatment of disruptive behaviors in chil- dren with subaverage intelligence. Am J Psychiatry.
  • 35. 2002;159:1337-1346. 27. Research Units on Pediatric Psychopharmacology Autism Network. Risperi- done in children with autism and serious behavioral problems. N Engl J Med. 2002;347:314-321. 28. Davanzo P, McCraken J. Mood stabilizers: lithium and anticonvulsants. In: Mar- tin A, Scahill L, Charney DS, Leckman JF, eds. Pediatric Psychopharmacology: Principles and Practice. New York, NY: Oxford University Press; 2003:309-327. 29. Leckman JF, Young C. Commentary on noradrenergic and serotonergic neuro- endocrine responses in prepubertal, peripubertal, and postpubertal rats pre- treated with desipramine and sertraline. J Am Acad Child Adolesc Psychiatry. 2002;41:1007-1009. 30. Rosenthal MB, Berndt ER, Donohue JM, Frank RG, Epstein AM. Promotion of prescription drugs to consumers. N Engl J Med. 2002;346:498- 505. What This Study Adds Psychotropic drug use prevalence among children and adolescents has steadily increased during the past de- cade, with most medications prescribed by pediatri- cians and family practitioners. Previous studies have shown increasing psycho-
  • 36. tropic drug expenditures at the aggregate level but have not provided information on the drug classes or spe- cific agents responsible for such cost trends. Half of the gross sales differential seen in this study was accounted for by only 3 drugs (amphetamine com- pound, risperidone, and sertraline), and 75% was ac- counted for by 7 drugs (the previous 3, together with bupropion, paroxetine, venlafaxine, and citalopram). Children receiving psychotropics more often and for longer periods, a shift toward newer (and costlier) agents within a same therapeutic class, and the net ef- fects of inflation all had an impact on increased phar- maceutical spending. (REPRINTED) ARCH PEDIATR ADOLESC MED/ VOL 157, OCT 2003 WWW.ARCHPEDIATRICS.COM 1004 ©2003 American Medical Association. All rights reserved. Copyright 2003 American Medical Association. All Rights Reserved. Applicable FARS/DFARS Restrictions Apply to Government Use.