SlideShare a Scribd company logo
1 of 110
Improving Marketing’s Contribution to
New Product Development
Wenzel Drechsler, Martin Natter, and Peter S. H. Leeflang
In many firms, the marketing department plays a minor role in
new product development (NPD). However, recent
research demonstrates that marketing capabilities more strongly
influence firm performance than other areas such as
research and development. This finding underscores the
importance of identifying relevant capabilities that can
improve the position of marketing within the NPD process as
part of the quest to improve innovation performance.
However, thus far, it has remained unclear precisely how the
marketing department can increase its influence on NPD
to enhance a firm’s innovation performance. The results of this
study demonstrate that the relationship between
marketing capabilities and innovation performance is generally
mediated by the decision influence of marketing on
NPD. In particular, both marketing research quality and the
ability to translate customer needs into product charac-
teristics serve to increase marketing’s influence on NPD. This
increased influence, in turn, positively contributes to
overall firm innovation performance. Hence, these results show
that in addition to having the appropriate marketing
capabilities, the marketing department must achieve a status in
which these capabilities can translate into performance
implications.
Introduction
T
he creation of new products is an important strat-
egy for any firm trying to survive in highly com-
petitive and fragmented markets. Each new
product development (NPD) project usually involves
identifying customer needs and conducting a preliminary
market assessment (Calantone and di Benedetto, 1988).
However, managers often believe that marketing research
fails to provide timely, accurate, and relevant information
about consumers and markets relevant to decision making
(Johnson and Ambrose, 2009). In particular, they are
convinced that new product failure rates are still high1
due to a flawed understanding of consumer preferences
and market needs (Cooper and Kleinschmidt, 1995;
Johnson and Ambrose, 2009).
Identifying and assessing opportunities for the devel-
opment of new products usually falls under marketing’s
domain, because this process represents the customer–
product connection (Fine, 2009; Moorman and Rust
1999). Kandybin and Kihn (2004) propose that top inno-
vators heavily involve the marketing department in the
NPD process. However, the prevailing view in most com-
panies is that marketing offers no distinct function; in
other words, there is a sense that everyone can do market-
ing (McKenna, 1991; Sheth and Sisodia, 2005). This is
one of the reasons why marketing is in heavy decline and
further implies that little attention is paid to the marketing
department’s knowledge and opinion (Webster, Malter,
and Ganesan, 2005). In addition, prior research indicates
that especially in NPD, the research and development
(R&D) department often dominates the marketing depart-
ment (e.g., Rein, 2004; Workman, 1993).
The question arises regarding which specific capabili-
ties marketing departments require to contribute to the
success of NPD. From the R&D perspective, marketing
could increase its influence by improving the credibility
of its knowledge with respect to NPD (Workman, 1993).
Considering this concept, Atuahene-Gima and Evange-
lista (2000) show that increased “expert power,” defined
as “the degree to which an individual is regarded as
having expert knowledge about the relevant issues in the
NPD process,” leads to increased marketing department
influence on the NPD process.
Because the role of marketing has been either mini-
mized or eliminated in many firms, recent research has
considered how marketing departments can reestablish
their integrity and their influence on corporate decisions
(e.g., Verhoef and Leeflang, 2009; Webster, 2005).
According to Verhoef and Leeflang (2009) and Verhoef
et al. (2011), the marketing department’s ability to link its
Address correspondence to: Wenzel Drechsler, Goethe
University
Frankfurt, Department of Marketing, Strothoff Chair of
Retailing, Grueneb-
urgplatz 1, 60054 Frankfurt, Germany. E-mail: [email protected]
wiwi.uni-frankfurt.de. Tel: +49 (0)69 798 34637.
1 Estimates of failure rates vary from more than 50% to
approximately
80–90% (Johnson and Ambrose, 2009; Sachdev, 2001; Sudhir
and Rao,
2006).
J PROD INNOV MANAG 2013;30(2):298–315
© 2012 Product Development & Management Association
DOI: 10.1111/j.1540-5885.2012.01010.x
strategies and actions to financial performance measures
(accountability) is a major factor driving its overall influ-
ence within the firm. They also show that being innova-
tive with regard to NPD is another major driver of respect
and influence for marketing departments. However,
knowledge about specific capabilities that improve the
marketing department’s contribution to NPD is scarce
(Atuahene-Gima and Evangelista, 2000; Griffin and
Hauser, 1996). This lack of knowledge calls for the devel-
opment of a more specific framework that identifies these
relevant marketing capabilities in order to improve mar-
keting’s position in NPD and, subsequently, a firm’s
innovation performance.
The present study aims to empirically investigate the
relationship between marketing capabilities and innova-
tion performance, as mediated by the influence of mar-
keting on NPD. Therefore, this study first identifies
marketing capabilities that are relevant for NPD. Then the
study investigates whether these capabilities help the
marketing department strengthen its position and influ-
ence within the NPD process. Finally, the study links the
marketing department’s influence and capabilities to firm
innovation performance.
The study’s results provide evidence that firms with
strong marketing departments are more successful with
their new products. This competitive advantage is attrib-
uted to how marketing-related capabilities contribute to
the marketing department’s influence on NPD issues.
Hence, these findings reveal that firms need not only key
marketing capabilities and skills but also a marketing
department that itself functions as an expert to execute
the relevant functions with respect to NPD.
The remainder of the paper is organized as follows.
The first section discusses general characteristics of mar-
keting capabilities; it is followed by the introduction of
the conceptual model. The next section specifies the
hypotheses and expected effects. This section is followed
by a discussion of the data and variables and the presen-
tation of the model. The final sections present the empiri-
cal results and discuss the main conclusions.
Conceptual Model
The literature suggests that distinct capabilities more than
resources help some firms outperform others (Grant, 1996;
Teece, Pisano, and Shuen, 1997). In particular, these capa-
bilities are manifested in specific business activities such
as developing new products (Day, 1994) and are therefore
important to identify. Adopting a knowledge-based view,
the present study views capabilities as embodied in the
knowledge and skills of employees and thus located within
a firm’s different departments.
A closer look at the NPD process helps to identify
specific marketing capabilities that are relevant for the
success of new products. The new NPD process is defined
as the process of generating and transforming new
product ideas into commercial outputs as an integrated
flow (Calantone and di Benedetto, 1988). Throughout
this process, the marketing department’s main tasks are to
identify and understand customer needs and to assess the
market potential of new product ideas (Calantone and di
Benedetto, 1988; Ernst, Hoyer, and Rübsaamen, 2010).
Thus, the marketing department’s capabilities are based
on knowledge about customer needs, past experience,
forecasting, and responding to needs (Day, 1994). Prior
research proposes that by increasing such distinct knowl-
edge and by demonstrating relevant skills, the marketing
department should be able to achieve higher levels of
status within specific business activities such as NPD
(Leonard-Barton, 1992).
In the context of NPD, the marketing department
usually conducts marketing research in order to gain rel-
evant information about customer needs and new product
ideas. Formal research is undertaken because managers
expect the resulting information to minimize uncertainty
when making important decisions in areas such as NPD
(Deshpandé and Zaltman, 1982). Hence, the ability to
acquire knowledge based upon high-quality marketing
research is a crucial capability that should relate to the
influence of marketing on NPD. According to Moorman
and Rust (1999), marketing’s emphasis is also on provid-
BIOGRAPHICAL SKETCHES
Dr. Wenzel Drechsler received his Ph.D. from the Marketing
Department,
Goethe University Frankfurt, Germany. His research interests
include
pricing, marketing strategy, and innovation management. His
research
papers have been published in journals such as Journal of
Product
Innovation Management, Journal of Interactive Marketing,
Technology
Analysis and Strategic Management, and Journal of Business
Research.
Prof. Martin Natter is the Hans Strothoff Chair of Retail
Marketing at
the Goethe University Frankfurt, Germany. He received his
Ph.D. from
Vienna University of Economics and Business Administration,
Austria.
His research interests include retail pricing, new product
decisions, and
competitive analysis. His research papers have been published
in jour-
nals such as Management Science, Journal of Marketing, and
Marketing
Science.
Prof. Peter S. H. Leeflang is the Distinguished Frank M. Bass
Professor
of Marketing, Department of Marketing, Faculty of Economics
and
Business, University of Groningen, the Netherlands. He also
holds the
BAT-chair of Marketing at LUISS Guido Carli at Rome, Italy,
and a
Research Chair at the Aston Business School of Aston
University,
United Kingdom. He is member of the Royal Academy of Arts
and
Sciences in the Netherlands.
IMPROVING MARKETING’S CONTRIBUTION TO NPD J
PROD INNOV MANAG 299
2013;30(2):298–315
ing knowledge and skills that connect the customer to
product design, functionalities, and quality issues. Hence,
marketing’s ability to translate customer needs into tech-
nical specifications, i.e., its technical skills (TS), should
on the one hand help reduce the number of products that
fail to satisfy market needs. On the other hand, good TS
should also be valued by other areas including the R&D
department as they increase the marketing department’s
credibility (Moorman and Rust, 1999; Workman, 1993).
The latter point also applies to the marketing depart-
ment’s general knowledge of marketing and business
issues (e.g., Enright, 2005). In particular, this capability
should allow the marketing department to support man-
agement in detailed business analyses concerning deci-
sions such as the selection of the most promising new
product ideas (Calantone and di Benedetto, 1988).
The discussion above shows that with respect to NPD,
the marketing department’s capabilities are mainly
knowledge based and rely on the acquisition, manage-
ment, and use of information. Usually, this knowledge is
tacitly held and difficult for rivals to copy due to its
imperfect imitability (Day, 1994; Krasnikov and Jay-
achandran, 2008).
The conceptual model in Figure 1 is based on the
assumption that specific knowledge (capabilities) of the
marketing department can only contribute to the success
of new products when the marketing department has the
power to influence important decisions. This assumption
is based on literature indicating that good capabilities and
skills within marketing departments are regarded as
crucial for fostering innovation success and strengthening
the marketing department’s position within the overall
innovation process (Atuahene-Gima and Evangelista,
2000). Hence, this discussion suggests that the relation-
ship between marketing capabilities and innovation per-
formance is mediated by the marketing department’s
influence on NPD. Therefore, the marketing department’s
knowledge-based capabilities (marketing research
quality [MR], TS, knowledge about marketing and
general management [MK]) are linked to the marketing
department’s influence on NPD. Following Homburg,
Workman, and Krohmer (1999), marketing’s influence is
defined as the exercised power of the marketing depart-
ment. Accordingly, this study uses two variables to
measure this influence: (1) the decision influence (DI) on
NPD (MI1) and (2) the fraction of new products or ser-
vices (NPD projects) initiated by the marketing depart-
ment (MI2). To assess their mediating role, these two
influence measures are directly linked to firm innovation
performance.
A firm’s innovation performance is linked to its
overall business performance to establish the convergent
Business
Performance (BP)
Controls:
•General innovativeness
•Number of new products
•Firm size
•Short-term emphasis
Marketing's
Influence on NPD
• Decision influence (MI1)
• Initiated NPD projects (MI2)
Controls
• Past market development
• Generic strategy
Controls:
Marketing Department Characteristics
• Accountability
• Integration/Cooperation with R&D
Firm Characteristics
• CEO – Technical background
• CEO – Marketing background
• B2C versus B2B
• Goods versus services
Environmental Characteristics
• Market-related turbulence
Innovation
Performance (IP)
Knowledge-Based
Marketing Capabilities
• Marketing research quality (MR)
• Technical skills (TS)
• Knowledge about
marketing & general management (MK)
Main paths of interest
Control paths
Figure 1. Conceptual Model
NPD, new product development
300 J PROD INNOV MANAG W. DRECHSLER ET AL.
2013;30(2):298–315
validity of the proposed conceptual model (Srivastava,
Shervani, and Fahey, 1999). In addition to considering
elements of financial performance such as profitability,
sales, and cost level, the overall business performance
measure used in this study also captures nonfinancial
elements of performance such as customer satisfaction
and customer loyalty (cf. Appendix A). To account for
both dimensions of business performance is consistent
with previous research indicating that nonfinancial per-
formance is closely related to improved financial perfor-
mance (Rust, Zahorik, and Kleiningham, 1995).
The conceptual model also controls for marketing
department characteristics, firm characteristics, and an
environmental characteristic (market-related turbulence).
Following Verhoef and Leeflang (2009), this study
uses accountability and integration/cooperation between
departments (in this case, marketing and R&D) as
potential antecedents that explain the influence of
marketing on NPD. Following Homburg et al. (1999),
firm characteristics such as the marketing background
of the chief executive officer (CEO) and the type of
industry (business-to-consumer [B2C] versus business-
to-business [B2B]) are also included as potential anteced-
ents in the model. Furthermore, the study controls for the
influence of a number of other variables that may affect
innovation and business performance, including firm
strategy, firm size, firm innovativeness, and past market
development (Song and Thieme, 2006).
Hypotheses Development and
Expected Effects
Marketing’s Knowledge-Based Capabilities
MR. The task of the marketing function is to develop a
thorough understanding of the market to ensure that the
firm produces goods and services that the consumer
requires and desires. Many firms perceive marketing
research to be an important support for their NPD
projects (Webster, 1992). In reality, however, marketing
researchers work under tight deadlines and even tighter
budgets, and they increasingly have trouble finding a
sufficient number of qualified respondents (Arnold,
2005). As a result, many marketing departments know
little or nothing about their customers (Schultz, 2003),
and MR is perceived to be low, which causes a decline in
the status of these departments within firms (Schultz,
2003).
The academic marketing literature includes numerous
studies on the use of market research (e.g., Deshpandé
and Zaltman, 1982). These studies suggest that the per-
ceived quality, actionability, and surprise factor of a given
piece of marketing research are positively linked with its
use. The increased use of high-quality marketing research
could improve the influence of the marketing department
because this department is usually in charge of collecting
market data. This assumption leads to the following
hypothesis:
H1: MR is positively related to the influence of marketing
on NPD.
TS. Studies of source credibility and the theory of
interpersonal trust (Giffin, 1967; Hovland, Janis, and
Kelley, 1953; Moorman, Desphandé, and Zaltman, 1993)
demonstrate that the perceived knowledge, expertise, and
technical competence of marketers induce a more posi-
tive attitude toward their ideas. For instance, the market-
ing department’s TS are relevant for effectively working
with important tools in NPD such as the House of Quality
(Hauser and Clausing, 1988; Natter, Mild, Feurstein,
Dorffner, and Taudes, 2001), in which customer require-
ments are translated into technical product specifications.
The greater the marketing department’s ability to link
customer requirements to technical product specifica-
tions, the more likely it is that a new product will be
successfully marketed (Hauser, 1993). TS of the market-
ing department may also contribute to the NPD success of
firms, because technical innovations can be better trans-
lated into customer benefits (e.g., via the positioning
strategy). Consequently, this study also assumes that a
marketing department’s TS, defined as its ability to trans-
late customer needs into product characteristics, will
increase its influence on NPD. In this vein, Leonard-
Barton (1992) underlines that some of the most necessary
elements of a core capability are excellent technical and
professional skills and a knowledge base relevant to
major products. On this basis, hypothesis H2 reads as
follows:
H2: The TS of the marketing department are positively
related to the influence of marketing on NPD.
MK. Marketing jobs have become more complex,
forcing chief marketing officers (CMOs) to become
general business managers (SpencerStuart, 2008). The
most promising CMOs are therefore those who happen to
be gifted marketers themselves and who are focused on
continually developing their team, both internally and
externally. This fact implies that apart from marketing
information (which is captured in marketing research),
general knowledge of marketing and management is also
a crucial asset (Glazer, 1991; Srivastava, Shervani, and
IMPROVING MARKETING’S CONTRIBUTION TO NPD J
PROD INNOV MANAG 301
2013;30(2):298–315
Fahey, 1998). Within the academic marketing literature,
although knowledge is now considered to be an important
resource, there is a lack of attention to the influence of
marketing knowledge within organizations. In addition to
having marketing knowledge, a marketer should also
have some knowledge of general management and busi-
ness (e.g., Enright, 2005). If marketing departments are
able to achieve growth via their marketing knowledge,
then the marketing department may be perceived as a
growth champion within the firm (Landry, Tipping, and
Kumar, 2006). This assumption leads to the following
hypothesis:
H3: MK is positively related to the influence of marketing
on NPD.
Control Variables—Marketing Influence
Marketing accountability. The importance of market-
ing department accountability has been widely acknowl-
edged (Lehmann, 2004; Rust, Ambler, Carpenter, Kumar,
and Srivastava, 2004). Both Moorman and Rust (1999)
and Verhoef and Leeflang (2009) show a positive rela-
tionship between accountability and the overall influence
of the marketing department within the firm, and
O’Sullivan and Abela (2007) report that top management
tends to be satisfied with the marketing department when
the latter is accountable. Hence, this study expects that
accountability also drives the influence of marketing on
NPD.
Integration with R&D. Generally, cross-functional
cooperation is considered to be beneficial for firms
(Srivastava et al., 1998). Because managing the interface
between different departments such as marketing, R&D,
finance, and operations is a critical element of successful
NPD, this study accounts for possible interdepartmental
conflicts related to the coordination of their activities.
Interdepartmental conflicts create barriers to innovation
due to departmental differences in time horizons, com-
munication depth, and contact frequency (Roussel, Saad,
and Erickson, 1991). Thus, this study assumes that any
problems that arise between the marketing and R&D
departments potentially reduce marketing’s influence on
NPD.
Firm characteristics. In their seminal work, Saxberg
and Slocum (1968) find inherent personality differences
between managers with marketing and R&D back-
grounds due to differences in their education. Marketing
professionals are trained in general problem solving and
decision making to ensure profitable company perfor-
mance. In contrast, R&D professionals, who often have a
technical background, are more interested in testing and
solving technical problems (Dougherty, 1992; Griffin and
Hauser, 1996; Saxberg and Slocum, 1968). Accordingly,
this study includes the CEO’s background as another
antecedent in the model. Marketing is expected to play a
more important role within firms that have a CEO with a
marketing background (Homburg et al., 1999). For this
purpose, this study includes two variables that reflect a
CEO’s marketing or technical background. Following
Verhoef and Leeflang (2009), this study also includes two
industry characteristics (B2C versus B2B and services
versus goods) as potential determinants of a marketing
department’s influence.
Market-related turbulence. Many different industries
now face increasing market turbulence. In particular,
shorter product life cycles, rising development costs, and
more intense competition force companies to think about
how to become more efficient and successful in their
innovation activities (Carrilo and Franza, 2006; Ches-
brough, 2007). Correspondingly, a firm needs a strong
marketing department that can face these challenges and
introduce high-quality market knowledge to help the
company successfully innovate. However, in turbulent
times, marketing budgets are often reduced or allocated
to other departments (Deleersnyder, Dekimpe, Steen-
kamp, and Leeflang, 2009; Nielsen 2009), thus reducing
the influence of the marketing department on NPD.
The Mediating Role of Marketing Influence on
Innovation Performance
Many firms, except for those that emphasize strongly the
role of the marketing department in NPD, suffer from
high new product failure rates (Kandybin and Kihn,
2004). This observation suggests that the marketing
department is likely to have an impact on the outcomes of
the NPD process not just by merely participating but also
by its status within the firm, which determines the degree
of influence it exercises on NPD (Atuahene-Gima and
Evangelista, 2000). The marketing department’s influ-
ence is reflected in its exercised power with respect to
specific activities important to the success of the firm
(Emerson, 1962; Homburg et al., 1999). This definition
implies that the NPD-specific knowledge of the market-
ing department can only contribute to the success of new
products when the marketing department has the power to
influence important decisions. Marketing has the oppor-
tunity to achieve this status within the NPD process by
302 J PROD INNOV MANAG W. DRECHSLER ET AL.
2013;30(2):298–315
demonstrating that its underlying capabilities and skills
are of high quality (Leonard-Barton, 1992). This
improved status should in turn allow marketing to influ-
ence performance outcomes (Wall, Stark, and Standifer,
2001). As such, the marketing department’s specific NPD
capabilities are expected to influence a firm’s innovation
performance indirectly through its influence on NPD.
Thus, this discussion leads to the following hypothesis:
H4: The relationship between marketing capabilities and
innovation performance is mediated by marketing’s
influence on NPD.
Control Variables—Performance Outcomes
To assess the impact of marketing departments’ DI on
innovation performance, this study controls for several
important constructs, including firm size (Laursen and
Salter, 2006) and firm innovation orientation: i.e., general
innovativeness (Han, Kim, and Srivastava, 1998). The
study also includes the firm’s time frame for its strategic
decisions because a short-term emphasis potentially
impedes product/service innovations (Verhoef and
Leeflang, 2009). Because only a small fraction of newly
introduced products do not fail, the firm’s number of new
products introduced during the past five years is also
accounted for.
Concerning firm strategy, Gemuenden and Heyde-
breck (1995) demonstrate that cost leaders tend to be less
innovative and hence less successful. However, other
researchers demonstrate that both cost leaders and differ-
entiators can achieve a high level of customer satisfaction
and business performance (Olson, Slater, and Hult, 2005;
Vorhies and Morgan, 2003; Yamin, Gunasekaran, and
Mavondo, 1999). These findings suggest that it is impor-
tant to account for a firm’s generic strategy (cost leader-
ship versus differentiation) in explaining business
performance. Finally, business performance is clearly
related to developments in the firm’s core market over the
last five years.
Research Methodology
Data Collection
A total of 1850 questionnaires were sent out to finance,
marketing, and R&D executives of German for-profit
firms with more than 200 employees. Several methods
were used to encourage responses. Respondents were
offered either customized reports or two popular articles
related to marketing and R&D. Nonrespondents were
called after four weeks, and their cooperation was
requested. In total, 279 questionnaires were returned,
yielding a response rate of 15.1%. Sixteen respondents
were excluded from the sample because they did not
complete the entire survey, and 24 respondents were
excluded because they stated that they were public rela-
tions managers or executives who were not involved in the
innovation activities of their firms. Hence, the analyses are
based on 239 respondents. The key informants all
belonged to top management teams: CEOs (9.6%), CMOs
(63.8%), chief technology officers/R&D executives
(8.3%), and chief financial officers (18.3%). In only two
cases were there two respondents per firm. Following
previous research, the present study did not average these
replies but instead considered each respondent as a sepa-
rate case (Van Bruggen, Lilien, and Kacker, 2002; Verhoef
and Leeflang, 2009). Because the key informants worked
intensively in the area under study, single informant bias
should not affect the results (Kumar, Stern, and Anderson,
1993). This view is also supported by the high degree of
perceptual agreement between the multiple informants at
the above-mentioned two firms (correlation = .98).
Sample Description
Table 1 indicates that the average number of employees
serving as full-time equivalents per firm is 3520. Further-
more, the firms in the sample are active in a variety of
industries, although most firms are active in the industrial
sector (60%).
The descriptive statistics in Appendix B show that the
firms in the sample mainly operate in B2B markets with
a 2.97 average score on a 10-point scale (1 = “turnover
totally from B2B,” and 10 = “turnover totally from
B2C”). The firms primarily focus on goods with an
average score of 4.02 on a 10-point scale (1 = “turnover
totally from goods,” and 10 = “turnover totally from ser-
vices”). In 22% of cases, the CEO’s background is mar-
keting. Most of the firms (72%) pursue a differentiation
strategy. Compared with their competitors and relative to
their own stated objectives, firms show above-average
innovation (mean = 4.68) and business performance
(mean = 4.93). These figures correspond to a moderate
market increase over the last three years
(mean = 6.24 ª 5%).
Key Measures
To measure the key variables, the study uses a range of
established scales available in the extant literature on
marketing strategy and market orientation. For example,
IMPROVING MARKETING’S CONTRIBUTION TO NPD J
PROD INNOV MANAG 303
2013;30(2):298–315
to operationalize the marketing department’s influence on
NPD decisions, a scale is used that was originally devel-
oped by Homburg et al. (1999). Each respondent was
asked to distribute 100 points to reflect the degree of
influence of four departments (marketing, sales, finance,
and R&D) on NPD decision making. The points assigned
to the marketing department are used to determine its
influence on NPD. The second marketing influence
measure (initiated NPD projects) is based on answers to
the following question: “What is the percentage of new
products or services introduced in the last five years that
were initiated by the following departments? Please
divide 100 points across the four departments: R&D,
Marketing, Sales, Other.” The points assigned to the mar-
keting department are used to indicate its influence.
To assess the relative influence of the marketing and
R&D departments, Table 2 reports the average percent-
age scores for both influence measures. The DI score of
the marketing department is 24%, whereas the influence
score of the R&D department is 43%. This result is
similar to the number of new products and services initi-
ated by each department. Over the last five years, 28% of
new products were initiated by the marketing department,
whereas the R&D department initiated 37% of all new
products.
To measure innovation and business performance,
Moorman and Rust’s (1999) subjective performance
scale is used both for the firm itself and for the firm
relative to its competitors. The present study uses this
type of performance data because previous studies find a
strong correlation between objective performance data
and subjective assessments of performance by key infor-
mants (Morgan, Kaleka, and Katsikeas, 2004; Olson
et al., 2005). More detailed information about the mea-
surement of each of the constructs, the items, the descrip-
tive statistics, and the literature source (as well as the
coefficient alphas and composite reliability) is provided
in Appendices A and B.
Validity and Reliability of Measures
The coefficient alphas of most of the multi-item scales are
greater than .80. The reliability and validity of the scales
are further assessed by exploratory and confirmatory
factor analysis (EFA and CFA). The EFA reveals suffi-
ciently high loadings per item per construct, and the items
belonging to each construct are classified as separate
factors. CFA for the reflective multi-item scales in the
model (see Appendix A) includes the marketing depart-
ment capabilities (including accountability). This model
demonstrates a good fit (goodness-of-fit index = .96; con-
firmatory fit index = .99; root mean square error of
approximation = .05), and all standardized factor load-
ings are greater than .5 (p < .05). The composite reliabili-
ties are all above .60 (Bagozzi and Yi, 1988; Steenkamp
and van Trijp, 1991).
It is also tested whether early respondents and late
respondents significantly differ in their response behav-
ior. The results show no nonresponse bias when using
Armstrong and Overton’s (1977) recommended test for
comparing early respondents and late respondents.
Finally, the existence of possible common method bias
was tested in two ways. First, potential common method
bias is assessed by using Harman’s single-factor test
(Malhotra, Kim, and Patil, 2006; Podsakoff, MacKenzie,
Lee, and Podskoff, 2003). In this single-factor test, all of
Table 1. Sample Descriptives
Industry
In Which Sector Is Your Firm Mostly Active? Fraction in %
Industrial sector (including FMCG) 60.00
Public services 2.90
Construction 4.60
Trade and retail 6.30
Catering services 1.30
Financial services 3.80
Transport, storage, and communications 6.30
Other business services 15.00
Firm Size in FTEs
Number of Employees Fraction in %
�500 35.80
501–1000 25.80
1001–1500 12.90
1501–2000 4.20
2001–2500 5.00
2501–3000 2.50
3001–3500 2.50
>3500 11.30
Mean (SD) 3520 (11,099)
n = 239.
FMCG, fast-moving consumer goods; FTE, full-time
equivalents; SD, stan-
dard deviation.
Table 2. Influence on New Product Development (NPD):
Average Percentage Scores of the Marketing and
Research and Development (R&D) Department
Marketing R&D Othersa
Decision influence on NPD 24 43 34
Initiated NPD projects 28 37 35
a Including sales and finance.
304 J PROD INNOV MANAG W. DRECHSLER ET AL.
2013;30(2):298–315
the items in the study are subject to EFA. Common
method bias is assumed to exist if (1) a single factor
emerges from unrotated factor solutions or (2) a first
factor explains the majority of the variance in the vari-
ables. The results of the EFA of all included items reveal
that the relevant factors explain 73.4% of the variance. If
one general factor were derived, then it would explain
only 17.2% of the variance. Next, Lindell and Whitney’s
(2001) marker variable technique is used. In particular,
the survey included a question that was not related to the
topic (degree of confidence in the economy) and corre-
lated this question with the derived constructs. The results
show no significant correlation between the answers to
this question and the important constructs and questions
in the model. Together, these two tests indicate no evi-
dence of common method bias.
Model Specification
Based on the conceptual model in Figure 1, the following
econometric model is used to test the hypotheses:
MI MC MD
FC MT
k k k m m
m
k d d
d
k f f
f
= + +
+ + +
=
+
=
+
=
∑ ∑
∑
α α α
α α
, , ,
,
0
1
3
3
1
2
5
1
4
10 εεk MIk k, ,=( )1 2
(1)
IP MI MC Zk k
k
m m
m
c c
c
IP= + + + +
=
+
=
+
=
∑ ∑ ∑β β β β ε0
1
2
2
1
3
5
1
4
(2)
BP IP GS MGk k
k
BP= + + + ++
=
∑γ γ γ γ ε0 1 1
1
2
4 (3)
Equation (1) is used to analyze the antecedents of the
marketing department’s influence on NPD. In this equa-
tion, MIk represents the two variables measuring the mar-
keting department’s influence on NPD. MCm is the three
knowledge-based marketing capabilities, MDd is the two
general marketing department characteristics (account-
ability and integration/cooperation), and FCf is the four
general firm characteristics. MT captures the degree of
market turbulence in a firm’s core market. The distur-
bance terms of equation (1) are represented by ek,MIk. In
equations (2) and (3), IP and BP represent a firm’s inno-
vation and business performance respectively. Zc repre-
sents the three control variables (e.g., firm size), GS
represents the two variables for a firm’s generic strategy
(cost leadership versus differentiation), and MG accounts
for past growth in the firm’s core market. eIP and eBP are
the disturbance terms of equations (2) and (3).
To account for contemporaneous correlations between
the error terms, the model is estimated using seemingly
unrelated regression (SUR). To justify the use of SUR,
the study conducted two tests. First, it employed the
Breusch–Pagan test to detect contemporaneous correla-
tions between the error terms. The resulting test statistic
for the system of equations was highly significant
(p = .000), indicating that contemporaneous correlation
exists and that it is appropriate to use SUR. Second, it
tested the performance of SUR as compared with ordi-
nary least squares (OLS). In particular, the model was
estimated as separate equations using OLS. The estima-
tion results based on OLS feature higher standard errors
for the coefficients, which emphasizes the usefulness of
estimating the system of equations via SUR.
It is also tested whether multicollinearity might possi-
bly affect the estimation results. The majority of the cor-
relation coefficients are less than .4 (see the correlation
matrix in Appendix B), and the variance inflation factor
scores are all below two, which indicates that no severe
multicollinearity problems exist (Hair, Anderson,
Tatham, and Black, 1998).
Model Results
To test whether the proposed marketing capabilities lead
to a higher influence of the marketing department on
NPD and whether their effects on innovation perfor-
mance are mediated by marketing’s influence, the study
applies a modeling procedure as follows. First, the study
assesses the relationship between the three marketing
capabilities and the two marketing influence measures
(MI1 and MI2). This relation is represented by equation
(1). The results are presented in the next subsection. Next,
the study assesses the mediating effects by computing the
indirect effects of the marketing capabilities on innova-
tion performance (Baron and Kenny, 1986; Zhao, Lynch,
and Chen, 2010).
The Impact of Marketing Capabilities on the
Marketing Department’s Influence on NPD
The estimation results in Table 3 clearly show that the
quality of marketing research and the capability to trans-
late customer needs into technical product specifications
positively contribute to both marketing influence mea-
sures (p � .05). These results provide strong support to
H1 and H2. The contribution measure of explained vari-
ance (EV) suggests that MR and the TS of the marketing
IMPROVING MARKETING’S CONTRIBUTION TO NPD J
PROD INNOV MANAG 305
2013;30(2):298–315
department have a particularly great impact (sum of
EV = 32.5%) on marketing’s DI on NPD (MI1). Further-
more, these capabilities enable the marketing department
to influence NPD by initiating NPD projects (MI2) within
the firm (sum of EV = 36.8%). With an EV score ranging
from 17.0% to 19.9%, MR emerges as the main underly-
ing capability that helps marketing departments achieve
high status within NPD. MK does not seem to drive the
influence of marketing, and this may be because every
department within a firm must have a certain degree of
knowledge about general management and business.
Thus, such knowledge does not function as a distinguish-
ing capability.
Accountability does not have a significant impact on
the variables that measure the marketing department’s
influence on NPD. The underlying reason might be that
the ability to link marketing strategies and actions to
financial performance is more relevant for existing prod-
ucts (e.g., due to the availability of past data and experi-
ence). Finally, it is surprising that the degree of
cooperation between the marketing and R&D depart-
ments does not have a significant impact on the marketing
department’s influence on NPD. This finding might be
the result of the strong differences in the influence
(status), which could result in a lack of communication
between both departments. A low average value of 2.89 in
this variable (see Appendix B) confirms this view.
The results indicate that having CEOs with marketing
backgrounds (p < .10) positively affects the influence of
marketing on NPD decision making. The CEO’s back-
ground has no effect on the number of new products
initiated by marketing. Furthermore, the influence of the
marketing department is greater in B2C firms than in B2B
firms (p < .05). Together, these results confirm the find-
ings of previous studies. For instance, Homburg et al.
(1999) show that the marketing background of a CEO and
the type of industry (B2C) are indeed positively related to
the influence of marketing within the firm. As expected,
the results also show a marginal negative effect of market
turbulence on marketing’s degree of influence on deci-
sion making (p < .10). This negative effect seems to
confirm that in turbulent times, marketing budgets are
among the first to be cut, thus reducing marketing’s
influence.
The literature suggests that gathering market informa-
tion can be critical, depending on the industry, because of
frequent changes in customer expectations and shifts in
technology (Harmancioglu, Grinstein, and Goldman,
2010). Therefore, the robustness of the results is evalu-
ated by estimating additional moderated regression
models to test the interaction between marketing capa-
bilities (marketing research and TS), firm focus (B2C),
industry (services versus goods), and market-related tur-
bulence. The results show no significant interactions;
Table 3. Estimation Results: The Impact of Marketing
Capabilities on the Marketing Department’s Influence (MIk)
on New Product Development (NPD) (Equation [1])
MI1 MI2
Decision Influence on NPD Initiated NPD Projects
Coefficient Standard Error EV (%) Coefficient Standard Error
EV (%)
Constant -13.13 8.718 2.32 7.785
Knowledge-based marketing capabilities
Marketing research quality (MR) 3.10*** 1.096 17.0 2.25**
.979 19.9
Technical skills (TS) 2.61*** 1.008 15.5 1.75** .900 16.9
Knowledge (MK) (marketing and general management) 1.20
1.224 5.9 .18 1.093 1.4
Controls
Marketing department characteristics
Accountability 1.60 1.071 9.0 1.17 .957 10.6
Marketing–R&D cooperation 1.03 .866 7.1 .51 .774 5.7
Firm characteristics
CEO—technical background -2.90 2.729 6.4 -1.48 2.437 5.3
CEO—marketing background 5.08* 2.925 10.4 3.23 2.612 10.7
B2C .96** .426 13.5 .96** .380 21.9
Services versus goods .33 .406 4.9 -.07 .363 1.6
Market-related turbulence -2.37* 1.378 10.3 -.86 1.231 6.1
R2 (adjusted R2) .25 (.21) .16 (.12)
* p � .10; ** p � .05; *** p � .01.
B2C, business-to-consumer; CEO, chief executive officer, EV,
contribution to explained variance; R&D, research and
development.
306 J PROD INNOV MANAG W. DRECHSLER ET AL.
2013;30(2):298–315
however, the main effects remain the same, which dem-
onstrates that MR and TS are the most important market-
ing capabilities in the context of NPD.
In summary, the estimation results demonstrate that it
is important for a marketing department to possess and
develop specific knowledge that is highly relevant to the
development of new products. In particular, the quality of
marketing research activities and the department’s ability
to connect customer needs to products help it to play an
important role in a firm’s NPD projects.
Marketing Capabilities and
Innovation Performance
The results of this analysis are presented in Table 4. To
get a more differentiated picture of the effects, the study
first directly relates the three marketing capabilities to
innovation performance (Model 1). Second, it relates the
two marketing influence measures (MI1 and MI2) to inno-
vation performance in the absence of the three marketing
capabilities measures (Model 2). Third, it establishes the
relationships between the three marketing capabilities
and innovation performance (Model 3 = equation [2])
while accounting for the marketing influence measures.
In Model 1, the most important marketing capability is
MR (EV = 19.6%), which has a significant positive effect
on innovation performance (p < .05). The results in
Model 2 reveal that the DI of marketing (MI1) has a
strong positive significant effect (p < .01) on innovation
performance. In Model 3, both the level of DI that mar-
keting departments enjoy (p < .01) and MR (p < .05) have
a significant effect on innovation performance.
The results in Table 4, however, indicate that there is
no direct effect of marketing’s TS on innovation perfor-
mance before (Model 1) or after controlling for its influ-
ence (Model 3). Together, marketing capabilities and
influence explain a considerable amount of the variance
in Model 3 (sum of EVs = 42.6%), where marketing DI
(EV = 14.8%) and research quality (EV = 11.8%) are the
major driving factors. These figures highlight the impor-
tance of marketing DI (MI1) and capabilities in driving
innovation performance. However, no significant effects
result from the second marketing influence measure
(MI2) on innovation performance.
The Mediating Role of Marketing’s DI
Given the significant impact of marketing’s DI (MI1) on
innovation performance, this section tests whether this
influence also mediates the impact of marketing’s spe-
cific capabilities on innovation performance (H4).
Recent research demonstrates that one just has to
assess the significance of the indirect effect of an inde-
pendent variable on an outcome variable, i.e., the effect
that an independent variable exhibits via an intervening
(mediating) variable, in order to determine the kind of
Table 4. Estimation Results: Innovation Performance—The
Mediating Role of Marketing’s Influence (Equation [2])
Model 1 (with Marketing
Capabilities)
Model 2 (with
Marketing Influence)
Model 3 = Equation (2)
(Full Model)
Coefficient
Standard
Error
EV
(%) Coefficient
Standard
Error
EV
(%) Coefficient
Standard
Error
EV
(%)
Constant 3.29*** .500 3.14*** .481 2.98*** .539
Knowledge-based marketing capabilities
Marketing research quality (MR) .12** .053 19.6 — — — .13**
.059 11.8
Technical skills (TS) -.04 .049 8.0 — — — -.07 .054 7.4
Knowledge (MK) (marketing and
general management)
.01 .056 2.1 — — — .03 .060 2.4
Marketing influence on NPD
Decision influence on NPD (MI1) — — — .01*** .004 24.2
.01*** .004 14.8
Initiated NPD projects (MI2) — — — .00 .004 6.6 -.01 .004 6.3
Controls
Innovativeness of the firm .06* .034 14.9 .04 .037 6.6 .04 .037
5.5
Number of new product introductions .21*** .052 35.8 .33***
.056 38.3 .33*** .056 31.4
Firm size -.01 .044 1.5 -.03 .047 4.0 -.06 .048 6.4
Short-term emphasis -.06** .027 18.1 -.09*** .030 20.2 -.08***
.030 14.1
R2 (adjusted R2) .18(.15) .20(.18) .22(.19)
* p � .10; ** p � .05; *** p � .01.
EV, contribution to explained variance; NPD, new product
development; R&D, research and development.
IMPROVING MARKETING’S CONTRIBUTION TO NPD J
PROD INNOV MANAG 307
2013;30(2):298–315
mediation (Zhao et al., 2010).2 To fully understand the
magnitude of marketing capabilities’ contribution to
innovation performance and the role of the marketing
department’s influence, the indirect effects are computed
to assess the type of mediation. Following the product-
of-coefficients method, the indirect effects (l) of MR and
TS on innovation performance are computed by multi-
plying their estimated coefficients in Table 3 with the
corresponding coefficient of marketing’s DI on NPD in
Table 4 (Model 3). Following Preacher and Hayes
(2008), the present study assesses the significance of the
indirect effects (l) by bootstrapped standard errors and
bias-corrected 95% confidence intervals.
The results show that MR (lMR = .031 [= 3.10*.01],
p < .05) and marketing departments’ TS (lTS = .026
[= 2.61*.01], p < .05) also exhibit positive significant
indirect effects on innovation performance through the DI
of marketing. These results confirm that the effect of TS
and MR on innovation performance is indeed mediated
by the DI of marketing (MacKinnon, Warsi, and Dwyer,
1995; Shrout and Bolger, 2002). Following the typology
proposed by Zhao et al. (2010), the mediating effect in
case of MR is complementary mediation, i.e., the medi-
ated effect (indirect effect) and direct effect both exist and
point in the same direction. In the case of TS, the result is
indirect-only mediation because TS do not show any sig-
nificant direct effect on innovation performance. Hence,
the performance impact of the marketing department’s
TS is fully carried through marketing’s DI on NPD (i.e.,
the indirect effect equals the total effect) (Shrout and
Bolger, 2002). In the case of MR, 19.3% of the total
effect (.031/[.031 + .13]) on innovation performance is
carried through marketing’s DI on NPD quality.3
In general, the above-described mediation analysis
highlights that marketing research and the marketing
department’s TS unfold performance contribution
through the department’s DI on NPD. As such, it is nec-
essary for a firm not only to develop these capabilities but
also to ensure that the marketing department has the
power to translate this knowledge into performance-
driving activities and decisions within the NPD process.
Innovation Performance and Business Performance
Models 2 and 3 in Table 5 confirm that innovation per-
formance significantly improves overall business perfor-
mance (p < .01). Past market development strongly
affects firm business performance (p < .01), whereas a
firm’s generic strategy shows no significant differentiat-
ing effect. The latter result supports findings from previ-
ous research, showing that the fit between the generic
strategy and its implementation is more important than
the chosen strategy (Olson et al., 2005).
Additional Analyses
Prior research indicates that marketing potentially
directly contributes to a firm’s business performance
2 Unlike Baron and Kenny’s (1986) proposition, there is no
need for a
significant zero-order direct effect in the case of mediation.
Further, it is not
necessary to compare the size of the coefficients across the
different equa-
tions in order to detect mediating effects (Zhao et al., 2010). 3
Baron and Kenny (1986) would call this result partial
mediation.
Table 5. Estimation Results: Business Performance (Equation
[3])
Model 1 (with Marketing
Influence)
Model 2 = Equation (3)
(with Innovation Performance) Model 3 (Full Model)
Coefficient
Standard
Error Coefficient
Standard
Error Coefficient
Standard
Error
Constant 4.52*** .146 2.61*** .217 2.59*** .227
Innovation performance — — .45*** .040 .44*** .040
Marketing influence on NPD
Decision influence on NPD (MI1) .01*** .003 — — .00 .003
Initiated NPD projects (MI2) .00 .003 — — .00 .003
Controls
Generic strategy
Cost leadership .05 .171 .11 .157 .10 .157
Differentiation .01 .123 .02 .112 .01 .113
Past market development .09*** .026 .07*** .024 .08*** .024
R2 (adjusted R2) .06(.04) 32(.31) .32(.31)
* p � .10; ** p � .05; *** p � .01.
NPD, new product development.
308 J PROD INNOV MANAG W. DRECHSLER ET AL.
2013;30(2):298–315
through its distinct knowledge-based capabilities (Kras-
nikov and Jayachandran, 2008). Therefore, it is also
tested whether there are direct effects of the marketing
department’s influence on business performance and
whether these effects are mediated by innovation perfor-
mance. Model 3 shows that the effect of marketing DI on
business performance is mediated by innovation perfor-
mance with an indirect effect of lDI = .005 (p < .01).
Computing the indirect effects of MR (lMR = .014,
p < .05) and TS (lTS = .012, p < .05) reveals that these
two marketing capabilities also indirectly affect overall
business performance through marketing DI and innova-
tion performance.
Robustness Checks
One might argue that perceptions of influence may
depend on the background of the respondent (Atuahene-
Gima and Evangelista, 2000). This problem would imply
that the results potentially suffer from respondent back-
ground bias, which in turn would imply that pooling
responses from respondents with different functional
backgrounds are not allowed. To test whether this
problem affects the estimation results, several robustness
checks were conducted.
First, equations (1) and (2) were reestimated by
including interaction terms among the respondent back-
ground (marketing versus others), the marketing capabili-
ties, and the two influence measures. The results did not
show any significant interaction in these models, which
gives a first indication that the respondent background
bias does not affect the results. Second, a Chow test was
applied to test whether respondents’ background affects
overall model results. This means that the hypothesis of
parameter homogeneity between the two groups of
respondents was tested (Chow, 1960; Leeflang, Dick,
Wittink, Michel, and Philippe, 2000). The null hypothesis
of homogeneity was not rejected, which underlines that
pooling the observations from respondents with different
functional backgrounds is statistically justified. A third
test of respondent bias involves the comparison of two
random samples. In particular, Equations (1) to (3) were
reestimated based on two equally sized random samples.
The results remained stable, which again emphasizes the
robustness of the results.
Discussion and Managerial Implications
The prevailing view in most companies is that marketing
is not a distinct function, and therefore, everyone can do
marketing. As a result, the status of the marketing depart-
ment is in a steep decline, which is especially observable
within the NPD process. This development is surprising
because it seems that top innovators strongly involve the
marketing department in the NPD process. Hence,
strengthening the marketing department’s position with
respect to NPD should be a priority to improve innovation
performance.
This problem leads to the following questions:
(1) How can the marketing department strengthen its
position in the NPD process and drive innovation perfor-
mance? (2) What role does the marketing department’s
position play in influencing innovation outcomes and
firm performance? With this idea in mind, the aim of this
study was to identify relevant marketing capabilities that
positively contribute to firm innovation performance and
help strengthen the marketing department’s influence on
NPD. To ensure generalizable results, the analyses are
based on a substantial sample of 239 respondents in B2B
and B2C firms operating in a variety of industries (goods
and services).
The empirical results summarized in Figure 2 clearly
show that marketing as a distinct function is important for
driving innovation success. In particular, this study shows
that in contrast to the commonly held view, not everyone
in a firm can do marketing, and therefore, the marketing
department should have a higher status in NPD.
This recommendation is based on the following facts.
First, if the marketing department demonstrates that its
MR and its ability to translate consumer needs into tech-
nical specifications (TS) is high, it can achieve a higher
status within NPD. Hence, this result answers the ques-
tion regarding how the marketing department can achieve
a higher influence in the NPD process and drive innova-
tion performance. Second, the results of the mediation
analysis depicted in Figure 2 show that these distinct
marketing capabilities coupled with an influential status
of the marketing department in NPD together drive inno-
vation performance. In the case of MR, the results show
a positive direct and indirect effect through marketing’s
influence on innovation performance. In addition, mar-
keting’s TS exhibit an indirect influence on innovation
performance. In particular, nearly 20% of the total effect
of the MR on innovation performance is mediated by
(carried through) marketing’s influence and its relation to
innovation performance. In the case of TS, this effect is
much stronger. Because TS show only an indirect effect
on innovation performance, their performance contribu-
tion can be fully attributed to marketing’s influence. This
latter finding demonstrates that without having the status
to influence NPD decisions, marketing’s ability to trans-
late customer needs into technical product specification
IMPROVING MARKETING’S CONTRIBUTION TO NPD J
PROD INNOV MANAG 309
2013;30(2):298–315
does not have any performance implications. Accord-
ingly, this result, together with the fact that the marketing
department still plays a minor role in many firms, seems
to confirm the widespread belief that reductions in the
customer–product connection have led to a rise of new
product failure rates.
The previously discussed results have the following
managerial implications. First, because marketing
research skills and the ability to translate customer needs
into technical product specifications are concentrated
within the marketing department, firms should value mar-
keting as a distinct function especially in the development
of new products. Second, to show that marketing has its
right to exist as a distinct function within the firm, mar-
keters involved in NPD projects should not only have a
strong knowledge of the market but also have a good
understanding of a firm’s product portfolio and those
products’ characteristics. Because NPD-specific market-
ing capabilities appear to have an indirect influence on
firm-level innovation performance, firms should enrich
their marketing teams with marketers who have special-
ized backgrounds including a deep knowledge of market-
ing research methods. Third, the marketing department
should use methods and tools that help to achieve a good
understanding of the markets and customer needs so that
these needs can be translated into technical product speci-
fications. In particular, the marketing department should
find ways to regularly interact with consumers in order to
get a better understanding of their needs. Particularly, the
Internet provides new forms of support for NPD. For
instance, an attractive tool for sourcing, filtering, and
evaluating new product ideas is the use of idea markets,
which utilize widely distributed knowledge, market
power, and the Internet to support the crucial initial tasks
of the NPD process (Soukhoroukova, Spann, and Skiera,
2012). Applying such tools encourages the innovation
Decision influence (MI1)
Marketing Capability Marketing Influence (MIk)
Hypothesis
(expected effect) Result
H1(+)
Initiated NPD projects (MI2)
Decision influence (MI1)
H2 (+)
Initiated NPD projects (MI2)
Decision influence (MI1)
H3 (+)
n.s.
n.s.Initiated NPD projects (MI2)
Marketing research quality (MR)
Technical skills (TS)
Knowledge (MK)
(marketing and general management)
Marketing Capabilities and Innovation Performance (IP):
The Mediating Role of Marketing’s Decision Influence (MI1)
The Impact of Marketing Capabilities on the Marketing
Department’s Influence on NPD
MI1
MR IP
(+) (+)
(+)
MI1
TS IP
(+) (+)
(n.s.)
Result:
Complementary mediation
(19% of the total effect)
Result:
Indirect-only mediation
(full mediation)
Marketing research quality (MR) Technical skills (TS)
H4
Figure 2. Overview of Main Results
NPD, new product development; n.s., not significant
310 J PROD INNOV MANAG W. DRECHSLER ET AL.
2013;30(2):298–315
process to shift from being mainly internally driven to
integrating external know-how and ideas (Laursen and
Salter, 2006).
Notably, the overview of results in Figure 2 also indi-
cates that general knowledge about marketing and man-
agement does not help marketing departments to increase
their status in the context of NPD. This result may be
because currently, general knowledge in marketing and
management is seen as nothing special; for instance,
engineers must attend courses on the principles of mar-
keting and general management. From an educational
perspective, the results presented above indicate that uni-
versities should provide marketing students with more
than a broad base of knowledge in marketing from
diverse areas. More importantly, marketing students
should be given highly specialized tool sets such as con-
joint analysis and latent class segmentation for perform-
ing high-quality marketing research along with better
technical training (e.g., education regarding the use tools
such as the House of Quality) so that they will be able to
more effectively translate customer requirements into
new product specifications. Additional analyses show that
MR, TS, and the DI of the marketing department also
indirectly contribute to overall business performance.
This result demonstrates that top management officials
should strengthen the marketing department’s position
within the firm and especially within NPD.
Limitations and Further Research
The first limitation of this study is that it does not distin-
guish between different stages in the NPD process. The
impact of the marketing department is different during
each stage of the NPD process. For example, the influ-
ence of marketing may be greater during earlier stages
such as idea generation, idea screening, and concept
development, and perhaps also during later stages such as
testing and commercialization. A second limitation is that
this study only accounts for problems concerning the
coordination between marketing and R&D on an aggre-
gate level. However, the degree of conflict between the
marketing and R&D departments may also differ accord-
ing to the particular stage in the NPD process and, con-
sequently, across firms. The third limitation is that this
study uses self-reported performance outcomes to assess
the impact of the marketing department within a firm.
Even though prior studies have found a strong correlation
between objective performance data and subjective
assessments of performance by key informants (Morgan
et al., 2004; Olson et al., 2005), this limitation can poten-
tially lead to biased estimates of the relationship between
the marketing department’s influence and a firm’s perfor-
mance outcomes (Cano, Carrillat, and Jaramillo, 2004).
These limitations provide avenues for future research.
For instance, it would be interesting to investigate and
identify more specific capabilities that are relevant during
the different stages of the NPD process. Based on these
results, it would also be worthwhile to investigate what
type of information supplied by marketing research teams
is particularly important to managers involved in NPD.
Future research could identify “ideal” combinations of
marketing and R&D departments for different firms and
industries (cf. Homburg, Jensen, and Krohmer, 2008). In
exploring relevant R&D capabilities, one might begin to
identify combinations of marketing and R&D that maxi-
mize innovation performance. These combinations would
allow for a more detailed assessment of marketing’s
influence on NPD and its performance outcomes. From
the managerial point of view, such ideal combinations of
marketing and R&D would help managers to increase
their understanding of the specificities of marketing and
R&D configurations at the firm level and thus develop
alternative solutions.
References
Armstrong, J. S., and T. S. Overton. 1977. Estimating non-
response bias in
mail surveys. Journal of Marketing Research 14 (3): 396–402.
Arnold, C. 2005. Self-examination. Marketing News 39 (2): 55–
56.
Atuahene-Gima, K., and F. Evangelista. 2000. Cross-functional
influence in
new product development: An exploratory study of marketing
and
R&D perspectives. Management Science 46 (10): 1269–84.
Bagozzi, R. P., and Y. Yi. 1988. On the evaluation of structural
equation
models. Journal of the Academy of Marketing Science 16 (1):
74–94.
Baker, M. J., C. D. Black, and S. Hart. 1988. The
competitiveness of British
industry: What really makes the difference? European Journal of
Mar-
keting 22 (2): 70–85.
Baron, R. M., and D. A. Kenny. 1986. The moderator–mediator
variable
distinction in social psychological research: Conceptual,
strategic, and
statistical considerations. Journal of Personality and Social
Psychol-
ogy 51 (6): 1173–82.
Calantone, R. J., and C. A. di Benedetto. 1988. An integrative
model of the
new product development process—An empirical validation.
Journal
of Product Innovation Management 5 (3): 201–15.
Cano, C. R., F. A. Carrillat, and F. Jaramillo. 2004. A meta-
analysis of the
relationship between market orientation and business
performance:
Evidence from five continents. International Journal of
Research in
Marketing 21 (2): 179–200.
Carrilo, J. E., and R. M. Franza. 2006. Investing in product
development
and production capabilities: The crucial linkage between time-
to-
market and ramp-up time. European Journal of Operational
Research
171 (2): 536–56.
Chesbrough, H. W. 2007. Why companies should have open
business
models. MIT Sloan Management Review 48 (2): 21–28.
Chow, G. C. 1960. Tests for equality between sets of
coefficients in two
linear regressions. Econometrica 28: 591–605.
Cooper, R. G., and E. J. Kleinschmidt. 1995. Benchmarking the
firm’s
critical success factors in new product development. Journal of
Product
Innovation Management 12: 374–91.
IMPROVING MARKETING’S CONTRIBUTION TO NPD J
PROD INNOV MANAG 311
2013;30(2):298–315
Covin, J. J., and D. P. Slevin. 1989. Strategic management of
small firms in
hostile and benign environments. Strategic Management Journal
10
(1): 75–87.
Day, G. S. 1994. The capabilities of market-driven
organizations. Journal
of Marketing 58 (4): 37–52.
Deleersnyder, B., M. G. Dekimpe, J.-B. E. M. Steenkamp, and
P. S. H.
Leeflang. 2009. The role of national culture in advertising’s
sensitivity
to business cycles: An investigation across continents. Journal
of Mar-
keting Research 46 (5): 623–36.
Deshpandé, R., and G. Zaltman. 1982. Factors affecting the use
of market
research information: A path analysis. Journal of Marketing
Research
19 (1): 14–31.
Dougherty, D. 1992. Interpretive barriers to successful product
innovation
in large firms. Organization Science 3 (2): 179–202.
Emerson, R. M. 1962. Power–dependence relations. American
Sociological
Review 27 (1): 31–41.
Enright, A. 2005. Future finder. Marketing News 39 (16): 14–
16.
Ernst, H., W. D. Hoyer, and C. Rübsaamen. 2010. Sales,
marketing, and
research-and-development cooperation across new product
develop-
ment stages: Implications for success. Journal of Marketing 74
(3):
80–92.
Fine, L. M. 2009. The bottom line: Marketing and firm
performance.
Business Horizons 52: 209–14.
Gemuenden, H. G., and P. Heydebreck. 1995. The influence of
business
strategies on technological network activities. Research Policy
24 (6):
831–49.
Giffin, K. 1967. The contribution of studies of source
credibility to a theory
of interpersonal trust in the communication process.
Psychological
Bulletin 68 (2): 104–20.
Glazer, R. 1991. Marketing in an information-intensive
environment: Stra-
tegic implications of knowledge as an asset. Journal of
Marketing 55
(4): 1–19.
Grant, R. M. 1996. Toward a knowledge-based theory of the
firm. Strategic
Management Journal 17: 109–22.
Griffin, A., and J. R. Hauser. 1996. Integrating R&D and
marketing: A
review and analysis of literature. Journal of Product Innovation
Man-
agement 13 (3): 191–215.
Hair, J. F., R. E. Anderson, R. L. Tatham, and W. C. Black.
1998. Multi-
variate data analysis. Upper Saddle River, NJ: Prentice Hall.
Han, J. K., N. Kim, and R. K. Srivastava. 1998. Market
orientation and
organizational performance: Is innovation a missing link?
Journal of
Marketing 62 (4): 30–45.
Harmancioglu, N., A. Grinstein, and A. Goldman. 2010.
Innovation and
performance outcomes of market information collection efforts:
The
role of top management team involvement. International Journal
of
Research in Marketing 27 (1): 33–43.
Hauser, J. R. 1993. How Puritan-Bennett used the house of
quality. Sloan
Management Review 34 (3): 61–70.
Hauser, J. R., and D. Clausing. 1988. The house of quality.
Harvard
Business Review (May–June): 63–73.
Homburg, C., J. P. Workman, and H. Krohmer. 1999.
Marketing’s influence
within the firm. Journal of Marketing 63 (2): 1–17.
Homburg, C., O. Jensen, and H. Krohmer. 2008. Configurations
of market-
ing and sales: A taxonomy. Journal of Marketing 72 (2): 133–
54.
Hovland, C. I., I. L. Janis, and H. H. Kelley. 1953.
Communication and
persuasion. New Haven, CT: Yale University Press.
Johnson, G. J., and P. J. Ambrose. 2009. Welcome to the bazaar.
Marketing
Research 20 (4): 18–24.
Kandybin, A., and M. Kihn. 2004. Raising your return on
innovation
investment. Strategy & Business 35: 38–49.
Krasnikov, A., and S. Jayachandran. 2008. The relative impact
of market-
ing, research-and-development, and operations capabilities on
firm per-
formance. Journal of Marketing 72 (4): 1–11.
Kumar, N., L. W. Stern, and J. C. Anderson. 1993. Conducting
interorga-
nizational research using key informants. Academy of
Management
Journal 36 (6): 1633–51.
Landry, E., A. Tipping, and J. Kumar. 2006. Growth champions:
What
distinguishes a truly great marketeer? In an era of unlimited
opportu-
nities but constrained resources, the only metric that matters is
growth.
Strategy & Business 43: 60–69.
Laursen, K., and A. Salter. 2006. Open for innovation: The role
of openness
in explaining innovation performance among U.K.
manufacturing
firms. Strategic Management Journal 27 (2): 131–50.
Leeflang, P., S. H. Dick, R. Wittink, W. Michel, and A. N.
Philippe. 2000.
Building models for marketing decisions. Boston, MA: Kluwer.
Lehmann, D. R. 2004. Metrics for making marketing matter.
Journal of
Marketing 68 (4): 73–75.
Leonard-Barton, D. 1992. Core capabilities and core rigidities:
A paradox
in managing new product development. Strategic Management
Journal
13 (S1): 111–25.
Lindell, M. K., and D. J. Whitney. 2001. Accounting for
common method
variance in cross-sectional research designs. Journal of Applied
Psy-
chology 86 (1): 114–21.
MacKinnon, D. P., G. Warsi, and J. H. Dwyer. 1995. A
simulation study of
mediated effect measures. Multivariate Behavioral Research 30
(1):
41–62.
Malhotra, N. K., S. S. Kim, and A. Patil. 2006. Common method
variance
in IS research: A comparison of alternative approaches and a
reanalysis
of past research. Management Science 52 (12): 1865–83.
Maltz, E., and A. K. Kohli. 1996. Market intelligence
dissemination across
functional boundaries. Journal of Marketing Research 33 (1):
47–61.
McKenna, R. 1991. Marketing is everything. Harvard Business
Review
Jan–Feb: 65–70.
Menon, A., S. G. Bharadwaj, P. T. Adidam, and S. W. Edison.
1999.
Antecedents and consequences of marketing strategy making: A
model
and a test. Journal of Marketing 63 (2): 18–40.
Moorman, C., R. Desphandé, and G. Zaltman. 1993. Factors
affecting trust
in market research relationships. Journal of Marketing 57 (1):
81–101.
Moorman, C. and R. T. Rust 1999. The role of marketing.
Journal of
Marketing 63: 180–97.
Morgan, N., A. Kaleka, and C. S. Katsikeas. 2004. Antecedents
of export
venture performance: A theoretical model and empirical
assessment.
Journal of Marketing 68 (1): 90–108.
Natter, M., A. Mild, M. Feurstein, G. Dorffner, and A. Taudes.
2001. The
effect of incentive schemes and organizational arrangements on
the new
product development process. Management Science 47 (8):
1029–45.
Nielsen. 2009. U.S. ad spending fell 15.4% in the first half.
Available at:
http://www.nielsen.com/us/en/insights/press-room/2009/us_ad_
spending_fell.html. Accessed October 20, 2012.
O’Sullivan, D., and A. V. Abela. 2007. Marketing performance
measure-
ment ability and firm performance. Journal of Marketing 71 (2):
79–83.
Olson, E. M., S. F. Slater, and G. T. M. Hult. 2005. The
performance
implications of fit among business strategy, marketing
organization
structure, and strategic behavior. Journal of Marketing 59 (3):
49–65.
Podsakoff, P. M., S. B. MacKenzie, J. Y. Lee, and N. P.
Podskoff. 2003.
Common method biases in behavior research: A critical review
of the
literature and recommended remedies. Journal Applied
Psychology 88
(5): 879–903.
Porter, M. E. 1980. Competitive strategy. New York: The Free
Press.
Preacher, K. J., and A. F. Hayes. 2008. Asymptotic and
resampling strate-
gies for assessing and comparing indirect effects in multiple
mediator
models. Behavioral Research Methods 40: 879–91.
Rein, G. L. 2004. From experience: Creating synergy between
marketing
and research and development. Journal of Product Innovation
Manage-
ment 21 (1): 33–43.
Roussel, P. A., K. N. Saad, and T. J. Erickson. 1991. Third
generation R&D.
Boston, MA: Harvard Business School Press.
312 J PROD INNOV MANAG W. DRECHSLER ET AL.
2013;30(2):298–315
Rust, R. T., A. J. Zahorik, and T. L. Kleiningham. 1995. Return
on quality:
Making service quality financially accountable. Journal of
Marketing
59 (2): 58–70.
Rust, R. T., T. Ambler, G. S. Carpenter, V. Kumar, and R. K.
Srivastava.
2004. Measuring marketing productivity: Current knowledge
and
future direction. Journal of Marketing 69 (4): 76–89.
Sachdev, A. 2001. Chicago market research firm’s study says
most new
products fail. Chicago Tribune. May 1.
Saxberg, B. O., and J. W. Slocum Jr. 1968. The management of
scientific
manpower. Management Science 14 (8): B473–B89.
Schultz, D. E. 2003. Marketing gets no respect in the
boardroom. Market-
ing News 37 (24): 9.
Sheth, J. N., and R. S. Sisodia. 2005. Does marketing need
reform? In
marketing renaissance: Opportunities and imperatives for
improving
marketing thought, practice, and infrastructure. Journal of
Marketing
69: 1–25.
Shrout, P. E., and N. Bolger. 2002. Mediation in experimental
and nonex-
perimental studies: New procedures and recommendations.
Psycho-
logical Methods 7 (4): 422–45.
Song, M., and R. J. Thieme. 2006. A cross-national
investigation of the
R&D–Marketing interface in the product innovation process.
Industrial
Marketing Management 35 (3): 308–22.
Soukhoroukova, A., M. Spann, and B. Skiera. 2012. Generating
and evalu-
ating new product ideas with idea markets. Journal of Product
Inno-
vation Management 29 (1): 100–12.
Spencer Stuart. 2008. Beyond sales support: The increasingly
strategic role
of the industrial CMO. Available at http://content.spencerstuart.
com/sswebsite/pdf/lib/CMOind08.pdf. Accessed March 3, 2010.
Srivastava, R. K., T. A. Shervani, and L. Fahey. 1998. Market-
based assets
and shareholder value: A framework for analysis. Journal of
Marketing
62 (1): 2–18.
Srivastava, R. K., T. A. Shervani, and L. Fahey. 1999.
Marketing, business
process and shareholder value: An organizational embedded
view of
marketing activities and discipline of marketing. Journal of
Marketing
60 (4): 168–79.
Steenkamp, J.-B. E. M., and H. C. M. van Trijp. 1991. The use
of LISREL
in validating marketing constructs. International Journal of
Research
in Marketing 8 (4): 283–99.
Sudhir, K., and V. R. Rao. 2006. Do slotting allowances
enhance efficiency
or hinder competition? Journal of Marketing Research 43 (2):
137–55.
Teece, D. J., G. P. Pisano, and A. Shuen. 1997. Dynamic
capabilities and
strategic management. Strategic Management Journal 18 (7):
509–33.
Van Bruggen, G. H., G. L. Lilien, and M. Kacker. 2002.
Informants in
organizational marketing research: Why use multiple informants
and
how to aggregate responses. Journal of Marketing Research 39
(4):
469–78.
Verhoef, P. C., and P. S. H. Leeflang. 2009. Understanding the
marketing
department’s influence within the firm. Journal of Marketing 73
(2):
14–37.
Verhoef, P. C., P. S. H. Leeflang, J. Reiner, M. Natter, W.
Baker, A.
Grinstein, A. Gustafsson, P. Morrison, and J. Saunders. 2011. A
cross-
national investigation into the marketing department’s influence
within
the firm: Towards initial empirical generalizations. Journal of
Interna-
tional Marketing 19 (3): 59–86.
Vorhies, D. W., and N. A. Morgan. 2003. A configuration
theory assessment
of marketing organization fit with business strategy and its
relationship
with marketing performance. Journal of Marketing 67 (1): 100–
15.
Wall, J. A. Jr., J. B. Stark, and R. Standifer. 2001. Mediation—
A current
review and theory development. Journal of Conflict Resolution
45 (3):
370–91.
Webster, F. E. 1992. The changing role of marketing in the
corporation.
Journal of Marketing 56 (4): 1–17.
Webster, F. E. 2005. Back to the future: Integrating marketing
as tactics,
strategy, and organizational culture. In marketing renaissance:
Oppor-
tunities and imperatives for improving marketing thought,
practice, and
infrastructure. Journal of Marketing 69 (4): 1–25.
Webster, F. E., A. J. Malter, and S. Ganesan. 2005. The decline
and disper-
sion of marketing competence. MIT Sloan Management Review
46 (4):
35–43.
Workman, J. P. 1993. Marketing’s limited role in new product
development
in one computer systems firm. Journal of Marketing Research
30 (4):
405–21.
Yamin, S., A. Gunasekaran, and F. T. Mavondo. 1999.
Relationship
between generic strategies, competitive advantage and
organizational
performance. Technovation 19 (8): 507–18.
Zhao, X., J. G. Lynch Jr., and Q. Chen. 2010. Reconsidering
Baron and
Kenny: Myths and truths about mediation analysis. Journal of
Con-
sumer Research 37 (2): 197–206.
Appendix A. Used Scales
Construct/Variable (Inspired
or Based on) Items
Coefficient
Alpha/Composite
Reliability
CEO functional
background (Homburg
et al., 1999)
What is the primary background of the CEO within your firm?
– Marketing, engineering, science, finance law, other (1/0)
NA
Decision influence of the
marketing department on
NPD (Homburg et al.,
1999)
Distribute 100 points over the following departments:
Sales, Marketing, R&D, Finance: Departments with a high
influence on NPD receive more
points than departments with a low influence.
NA
Initiated NPD projects by
the marketing
department
What is the percentage of introduced new products or services
in the last five years that were
initiated by the following department? Please divide 100 points
across four departments:
1. R&D, 2. Marketing, 3. Sales, 4. Other.
NA
Lack of cooperation
(Maltz and Kohli, 1996)
(formative)
To what extent have the marketing department and the R&D
department experienced
problems concerning coordination of activities in the past three
years? (1 = no problems at
all, 7 = very many problems)
To what extent have the marketing department and the R&D
department hindered each
other’s performance in the past three years?
(1 = not hindered at all, 7 = hindered a lot)
.84/NA
B2B versus B2C (Verhoef
and Leeflang, 2009)
Please indicate the percentage of your turnover that arise from
B2B or B2C markets:
B2B (1) . . . B2C (10)
NA
IMPROVING MARKETING’S CONTRIBUTION TO NPD J
PROD INNOV MANAG 313
2013;30(2):298–315
Appendix A. Continued
Construct/Variable (Inspired
or Based on) Items
Coefficient
Alpha/Composite
Reliability
Goods versus services
(Verhoef and Leeflang,
2009)
Please indicate the percentage of your turnover that arise from
goods or service markets:
Services (1) . . . Goods (10)
NA
Firm size (ln) What are approximately the total number
employees in your firm (in FTEs)? NA
Innovativeness of the firm
(Covin and Slevin, 1989)
In our firm, top managers have a strong emphasis on selling
goods/services known and
proven in the market (1) . . . a strong emphasis on R&D,
technological leadership and
innovations (10)
NA
Number of new product
introductions
How many products and services has your firm marketed in the
past five years?
(1 = none, 7 = very many)
NA
Market-related turbulence
(Menon, Bharadwaj,
Adidam, and Edison,
1999) (formative)
Can you indicate the level of change in the last three years in
the most important market
where your firm was active on the following elements
– production/process technology
– introduction of new products/services
– R&D activities
– competitive intensity
– customer preferences
(1 = no change, 7 = very frequent changes)
.78/NA
Marketing research quality
(Deshpandé and
Zaltman, 1982)
(reflective)
– The marketing department possesses high-quality market
information.
– The results of conducted market research can be used to solve
problems within our
organization.
– The used market information is of high quality.
(1 = fully disagree, 7 = fully agree)
.82/.80
Technical skills (Moorman
and Rust, 1999)
(reflective)
The marketing department in our firm
– is effective at translating customer needs into new products or
services.
– has no sufficient knowledge and skills to translate customer
needs into technical
specifications. (reverse coded)
(1 = fully disagree, 7 = fully agree)
.61/.62
Knowledge (marketing and
general management)
(reflective)
– The marketing knowledge of the employees of the marketing
department is good.
– The knowledge on business economics of employees of the
marketing department is good.
(1 = fully disagree, 7 = fully agree)
.83/.83
Accountability of the
marketing department
(Moorman and Rust,
1999) (reflective)
The marketing department in our firm
– is effective at linking their activities to financial outcomes.
– shows the financial outcomes of their plans.
– has little attention for financial outcomes of their activities
(reverse coded).
(1 = fully disagree, 7 = fully agree)
.83/.79
Innovation performance
(Moorman and Rust,
1999) (formative)
Relative to your firm’s stated objectives, how is your firm
performing on innovation success?
(1 = much worse, 7 = much better)
Relative to your competitors, how is your organization
performing on innovation success?
(1 = much worse, 7 = much better)
.80/NA
Business performance
(Moorman and Rust,
1999) (formative)
Relative to your firm’s stated objectives, how is your firm
performing on: (1 = much worse,
7 = much better)
Relative to your competitors, how is your organization
performing on: (1 = much worse,
7 = much better)
– Customer satisfaction, customer loyalty, turnover,
profitability, market share, cost level
.87/NA
Past market development Over the last three years, what was the
average annual market growth or decline for the
largest market where your firm was active?
(1 = decrease by more than 20%, 9 = increase of more than
20%)
NA
Generic strategy (Porter,
1980; Verhoef and
Leeflang, 2009)
Please indicate which of the following generic business
strategies is most applicable for your
firm:
– Cost leadership: strategy to obtain the lowest costs in the
market
– Differentiation: focusing on being better in different features
of the product/service that
are important to customers
– Cost focus: targeting a relative small segment in the market
that is cost-consciousness
– Differentiation focus: targeting a relatively small segment in
the market that desires a
unique and good product and that is willing to pay a higher
price for this
NA
Short-term orientation
(Baker, Black, and Hart,
1988)
If you would describe the orientation of your firm is this:
a short-term orientation (1) . . . a long-term
orientation (10)
NA
B2B, business-to-business; B2C, business-to-consumer; CEO,
chief executive officer; FTE, full-time equivalents; NA, not
applicable; NPD, new product
development; R&D, research and development.
314 J PROD INNOV MANAG W. DRECHSLER ET AL.
2013;30(2):298–315
Appendix B. Correlation Matrix of Constructs in Model (n =
239)
M SD (1) (2) (3) (4) (5) (6) (7) (8) (9)
(1) Decision influence on NPD 23.76 21.25 1
(2) Initiated NPD projects 27.59 17.96 .543** 1
(3) Innovation performance 4.68 1.11 .165** .041 1
(4) Business performance 4.83 .83 .116* .027 .543** 1
(5) Marketing research quality 4.48 1.30 .358** .293** .219**
.213** 1
(6) Technical product skills 4.97 1.36 .324** .253** .068 .105
.352** 1
(7) General marketing knowledge 4.99 1.24 .302** .207**
.119* .163 .422** .420** 1
(8) Accountability 4.28 1.36 .312** .245** .091 .061 .362**
.370** .507** 1
(9) Marketing-R&D cooperation 2.89 1.41 .040 .029 -.043 -.049
-.041 -.049 -.019 .016 1
(10) CEO—technical background .28 .45 -.144* -.102 .053 .039
-.073 -.070 -.102 -.169** .043
(11) CEO—marketing background .22 .41 .131* .102 .112 .073
.087 .065 -.030 .043 -.009
(12) Short-term emphasis 4.02 2.20 .129* -.017 -.199** -.162* -
.163* -.017 -.065 -.002 .082
(13) Cost leadership .12 .32 .018 .088 -.010 .021 -.008 .062
.018 -.041 .029
(14) Differentiation .71 .45 .078 -.025 -.039 -.046 .120 .144
.075 .092 -.031
(15) B2C 2.93 3.05 .265** .250** .161* .072 .290** .136*
.149* .218** .016
(16) Services versus goods 4.02 3.12 .099 .045 .056 -.008 .119 -
.003 .056 .056 -.152*
(17) Firm size 3234.34 11,119.66 -.014 .073 .050 -.041 .217
.087 .126 .017 .048
(18) Innovativeness of the firm 4.53 1.78 -.174** -.154* .128*
.010 -.069 -.049 -.127* -.159* .015
(19) Number of new product introductions 5.32 1.17 .042 .046
.375** .353** .112 .159* .095 .026 .023
(20) Past market development 6.24 1.87 -.083 -.107 .074 .208**
-.008 -.068 -.024 -.109 .035
(21) Market turbulence 4.33 .89 -.052 -.006 .143* -.004 .123
.025 -.058 .042 .053
(10) (11) (12) (13) (14) (15) (16) (17) (18) (19) (20) (21)
(1) Decision influence on NPD
(2) Initiated NPD projects
(3) Innovation performance
(4) Business performance
(5) Marketing research quality
(6) Technical product skills
(7) General marketing knowledge
(8) Accountability
(9) Marketing-R&D cooperation
(10) CEO—technical background 1
(11) CEO—marketing background -.081 1
(12) Short-term emphasis .066 -.097 1
(13) Cost leadership -.083 -.066 .085 1
(14) Differentiation -.014 .023 -.082 -.486 1
(15) B2C -.139* .012 .041 -.005 .077 1
(16) Services versus goods -.121 .031 -.018 -.027 -.011 .239**
1
(17) Firm size .000 -.090 -.061 -.041 .117 .095 .029 1
(18) Innovativeness of the firm .223** .094 -.133* -.006 .040 -
.147* -.183** .054 1
(19) Number of new product introductions .027 .158* -.134* -
.078 .033 -.003 -.165* .135* .185** 1
(20) Past market development .043 -.067 -.074 -.034 -.124 -
.134* -.029 .060 .121 .127* 1
(21) Market turbulence .010 .045 -.099 -.136* .158* .035 .140*
.065 .115 .182** .042 1
** Correlation is significant at the .01 level (two-tailed). *
Correlation is significant at the .05 level (two-tailed).
B2C, business-to-consumer; M, mean; NPD, new product
development; SD, standard deviation; R&D, research and
development.
IMPROVING MARKETING’S CONTRIBUTION TO NPD J
PROD INNOV MANAG 315
2013;30(2):298–315
This document is a scanned copy of a printed document. No
warranty is given about the accuracy of the copy.
Users should refer to the original published version of the
material.
International Economic Journal
Vol. 22, No. 1, March 2008, 113–126
Does trade regionalism increase stock
market segmentation within
a trading bloc?
Chee Wooi Hooy*
Finance Section, School of Management, University Sains
Malaysia, Penang, Malaysia
(Received 29 June 2006; final version received 7 February 2007
)
Whether trade regionalism remains a stumbling block to
economic globalization remains
a debatable issue. This paper investigates the impact of trade
regionalism on stock market
segmentation for the case of AFTA, EU and NAFTA. We
exploit the pricing error of the
trading-bloc capital asset pricing model (TB-CAPM) as an
indicator for stock market seg-
mentation based on Akdogan (1992) and Adler and Qi (2003).
We use intra-trade ratio as the
indicator for trade regionalism. Controlling for other
determinants for market integration,
evidence is found that trade regionalism helps to explain stock
market segmentation in EU
and NAFTA, which are both dominated by developed countries.
For NAFTA, the higher the
intra-trade ratio the lower the degree of market segmentation
within the trading bloc. For
EU however, the intra-trade ratio contributes to higher stock
market segmentation.
Keywords: stock market segmentation; trade regionalism; TB-
CAPM; intra-trade ratio
Introduction
The global trend in trade regionalism has entered a new era. The
number of trading
blocs formally registered with WTO has been accelerating over
the last few years. Before
the 1990s, only 27 agreements were established. The number
jumped to a surprising
162 by 2005, and continues to surge to a total of 205 as of July
2007.1 A hot debate on
this phenomenon of increasing regionalism is whether it will
hinder or promote a mul-
tilateral trading system. Many scholars, including Bhagwati
(1993) and Frankel et al.
(1995) found that the recent trade regionalism is more likely to
be welfare reducing
and works against world economic globalization. WTO,
however, believes that such
development is a complementary progress as long as it can help
trade flow more freely
*Email: [email protected]
ISSN 1016-8737 print/ISSN 1743-517X online
© 2008 Korea International Economic Association
DOI: 10.1080/10168730801887083
http://www.informaworld.com
114 C. W. Hooy
within the bloc, without barriers being raised on trade outside
the bloc (see GATT
Article 24). Regionalism is seen as an instrument that allows
groups of countries to
negotiate rules and commitments that go beyond what are
possible multilaterally, in
the hope that they will develop into topics of discussion in
WTO later. This view is
attributed mainly to MacMillan (1993).
In principle, when real sectors get more integrated, capital
markets will become
less segmented. The intuitive sense is that international finance
serves to facilitate
international trade. When a country becomes more integrated
with their trading bloc
counterparts in terms of trade, it will take an initiative to lock-
in economic and political
reforms to accelerate the transition to a market economy
(Hoekman and Kostecki,
2001). This will further lead to policy coordination in both
monetary and fiscal aspects
among the member countries. With increasing real sector
integration, intra-bloc capital
flows are likely to be enhanced across borders. The
liberalization effort will also reduce
cross-market frictions, and the law of one price will play its
role to prevent investors
from taking advantage of any pricing discrepancies among the
bloc members. If the
WTO is correct that trade regionalism will promote
globalization, then the integration
process goes beyond the bloc basis. This means that the
reduction in capital market
segmentation will happen not only within the bloc, but at the
same time, with the rest
of the world.
Unfortunately, empirical works relating trade regionalism to
stock market
integration/segmentation remain scarce in the literature. This is
probably due to
the fact that trade flow information is often not incorporated in
the investor’s pric-
ing decision. The impact of trade flow can always prevail
through various economic
fundamentals because they are more easily accessed by the
investors. Therefore,
macroeconomics-oriented variables are often taken as quite
reasonable factors in
explaining stock market integration. Among the macroeconomic
variables that have
been considered in asset pricing models include trade openness,
business cycle,
exchange rates and interest rates. In addition, others also
explore the role of microstruc-
ture oriented variables such as dividend yield, liquidity, book-
to-market, or even market
volatility to explain stock market integration.2
The works of Heaney, Hooper and Jaugietis (2000) and Heaney
and Hooper (2001)
are the only studies we found to relate integration of the stock
market with trading
bloc grouping. Both papers utilized cluster analysis to examine
whether stock markets
form a grouping in a hierarchical dendogram and they recorded
clear evidence of world
stock market segmentation that is very much consistent with the
existence of regional
trading bloc and economic ties between the sample countries.
Many other market
integration studies have pointed out the role of trade
regionalism on market integration.
Nevertheless, it was not in their objective to test for the direct
relationship between
the two. These include Heaney and Hooper (1999) and Ng
(2002) on AFTA; Akdogan
(1992), Corhay, Rad and Urbain (1993), Johnson and Soenen
(1993), Johnson, Lindvall
and Soenen (1994), Monadjemi and Perry (1996), Choudhry
(1996), Kanas (1998)
and Fratzscher (2002) on EMU; Soydemir (2000), Seabra
(2001), Edwards and Susmel
(2001), Chen, Firth and Rui (2002), Heaney, Hooper and
Jaugietis (2002) and Johnson
and Soenen (2003) on MERCOSUR; and Adler (1995), Ewing,
Payne and Sowell (1999),
Adler and Qi (2003) on NAFTA. These works have provided
strong grounds for further
empirical investigation on this issue, but call for a more direct
approach.
The focus of this paper is to explore how trade regionalism
affects the segmentation
of stock markets within the trading bloc. We aim to find out if
trade regionalism
has helped to integrate stock markets among the trading
members, or whether it
has induced more segmentation among the stock markets within
the trading bloc.
International Economic Journal 115
The empirical findings of this paper allow the macroeconomic
policymakers who are
engaged in the trading bloc agreements to understand better the
likely impact of real
sector convergence on the financial sector integration. In
addition, the findings allow
the related central banks and security exchanges to take note of
the sources of their
asset pricing divergences with those of the trading-bloc binding
member countries.
This paper contributes in two ways. First, we use a mix of a
determinant model for
market integration, and a cross-section asset pricing approach to
investigate the impact
of trade regionalism on trading bloc stock market segmentation.
Our approach is
different from the cluster analysis of Heaney, Hooper and
Jaugietis (2000) and Heaney
and Hooper (2001). Our model has controlled other important
determinants in the
market integration process. This leads to the second
contribution of this paper. The
modeling of trade regionalism as a determinant for market
segmentation/integration
has extended the determinant model used in Carrieri, Errunza
and Hogan (2007)
in explaining stock market integration. In fact, we find that
trade regionalism plays
a relatively important and significant role in explaining stock
market segmentation
within a trading bloc, as compared to the other integration
determinants suggested in
Carrieri, Errunza and Hogan (2007).
This paper is organized as follows. The next section outlines the
framework of
analysis and the data employed. The third section presents the
statistical results and
discussions on the major findings. Concluding comments are in
the final section of the
paper.
Methodology and data
Empirical indicators are used to measure the degree of trade
regionalism and stock
market segmentation in a trading bloc. The level of trade
regionalism is represented by
the intra-trade ratio, which is referred to as the Trade
Regionalism Index (TRI). The
TRI for trading bloc T is defined as:
TRIT,t =
1
nT
nT∑
i=1
BTTit
WTTit
(1)
where nT is the number of member countries in trading bloc T,
BTTit is the total bilateral
import and export of country-i with the other member countries
of the same bloc, and
WTTit is the total trade (import plus export) of country-i with
the world market. This
base measure for goods movement serves to compare real
integration within a trading
bloc in comparison to total movement to the world market.3
7 According to Korajczyk (1996), pricing errors estimated
within the framework of
some form of asset pricing model can be used to measure how
segmented a subject
market is to the world market. Korajczyk (1996) developed an
index to capture the
dynamic integration states of market integration from the
pricing errors estimated
under the framework of International Arbitrage Pricing Theory
(IAPT). The idea was
applied and extended in Levine and Zervos (1998) using both
IAPT and World Capital
Asset Pricing Model (WCAPM) to study stock market
development and economic
growth.
In this paper, we are interested in measuring stock market
segmentation among
members that bind under a trade agreement. A variant of asset
pricing model applied
by Akdogan (1992) and Adler and Qi (2003) is appropriate for
this purpose. The model,
116 C. W. Hooy
which we shall term as Trading-Bloc Asset Pricing Model (TB-
CAPM henceforth)
asserts that the pricing of cost of capital can be determined in a
linear return-generating
process given as follows:
rit = αi + βirTB,t + εit ; ∀ i (2)
where rit represent the excess market returns of individual
country-i and rTB,t represent
the excess returns of a portfolio of equal weighted stock indices
from a trading bloc.
Given that investors are mean-variance optimizers, the beta βi
measures the systematic
risk of stock market-i with respect to the trading-bloc portfolio
movements. The error
term εit captures the idiosyncratic risk that is orthogonal to the
trading bloc portfolio.
The aggregate relative risk aversion of individual investors is
assumed to be constant
(Chan, Gup and Pan 1992). Akdogan (1995) and Adler and Qi
(2003) have explored the
use the above TB-CAPM setting in pricing the ‘regionalism
effect’ in EU and NAFTA,
respectively.
With the assumption of perfect trading bloc integration, the
intercept αi in model (2)
should be equal to zero. This is essentially another version of
Black’s (1972) zero-beta
CAPM. If αi is significantly different from zero, the hypothesis
of perfect integration
with the trading bloc is rejected. The pricing error captures the
deviation from an
integration state. It is therefore appropriate to interpret it as a
measure of the degree
of segmentation among the stock markets in the trading-bloc
portfolio.
The pricing error is used to construct an indicator for trading-
bloc stock market
segmentation. Following Levine and Zervos (1998), the pricing
error is adjusted using
the following transformation:
SMSIT = − |αT| (3)
where αT =
∑nT
i=1(αi/nT). We refer to this as the stock market segmentation
index
(SMSI). By making the adjustment, the SMSI is negatively
correlated with the degree
of segmentation. The value of the index decreases with higher
official barriers and
taxes to international asset trading, bigger transaction costs, and
larger impediments
to the flow of firm information (see Korajczyk, 1996).
Therefore, the measure indicates
that a higher value of SMSI corresponds to a lower degree of
market segmentation.
Perfect integration with the world market occurs when SMSI is
equal to zero.
There are various econometric techniques that can be used to
generate a stochastic
time series for SMSI. While Korajczyk (1996) used a simple
rolling approach, Levine and
Zervos (1998) only estimated a static model for cross-sectional
pricing errors. In this
paper, we follow a popular cross-sectional regression method
suggested by Fama and
MacBeth (1973). This is a two-step procedure based on rolling
time-series regression.
In the first step, we estimate model (2) for t = 1, 2, . . . , N,
where N is the number
of observations for the first 5 years, and i = 1, 2, . . . , nT. The
estimated beta, β̂TBi , is
obtained, and treated as the ex-ante beta for period N + 1,
denoted as β̂Wi,N+1. In the
second step, the ex-post excess return for period N + 1 is
regressed on the ex-ante beta.
The following cross-sectional regression is estimated for i = 1,
2, . . . , nT:
ri,N+1 = αN+1 + γN+1β̂TBi,N+1 + εi,N+1 (4)
From here, the pricing error is obtained and SMSIT,N+1 is
computed. The two steps are
repeated by moving one observation down the 5-year window,
i.e. for t = 2, 3, . . . , N +
1 to compute SMSIT,N+2. The time series SMSIT,t is generated
by repeating the whole
International Economic Journal 117
process until the last observation. After computing SMSIT,t and
TRIT,t for each trading
bloc, we estimate the following model:
SMSI = a + b1TRI + b′Z + ε (5)
In model 5, the SMSI is regressed to the TRI, controlling for a
set of information related
to the stock market integration process, as captured by the
vector of Z.4 Following
Carrieri, Errunza and Hogan (2007), we included three variables
Improving Marketing’s Contribution toNew Product Development.docx

More Related Content

Similar to Improving Marketing’s Contribution toNew Product Development.docx

Marketing Mix Startegies and Its Impact on Organizational Performance Efficie...
Marketing Mix Startegies and Its Impact on Organizational Performance Efficie...Marketing Mix Startegies and Its Impact on Organizational Performance Efficie...
Marketing Mix Startegies and Its Impact on Organizational Performance Efficie...IJRTEMJOURNAL
 
MCM741_6-1InvestigationPaper_Stansell
MCM741_6-1InvestigationPaper_StansellMCM741_6-1InvestigationPaper_Stansell
MCM741_6-1InvestigationPaper_StansellAngela Stansell, MS
 
Linking Design, Marketing, and Innovation: Managing the Connection for Compet...
Linking Design, Marketing, and Innovation: Managing the Connection for Compet...Linking Design, Marketing, and Innovation: Managing the Connection for Compet...
Linking Design, Marketing, and Innovation: Managing the Connection for Compet...Waqas Tariq
 
TOPIC_1_Introduction_to_Product_Manageme.ppt
TOPIC_1_Introduction_to_Product_Manageme.pptTOPIC_1_Introduction_to_Product_Manageme.ppt
TOPIC_1_Introduction_to_Product_Manageme.pptPrashantMishra919139
 
Aligning sales and operations management an agenda for inquir.docx
Aligning sales and operations management an agenda for inquir.docxAligning sales and operations management an agenda for inquir.docx
Aligning sales and operations management an agenda for inquir.docxsimonlbentley59018
 
Marketing Involvement in New product development
Marketing Involvement in New product development Marketing Involvement in New product development
Marketing Involvement in New product development Nomanzakir127
 
Goins Effective Marketing Plan
Goins Effective Marketing PlanGoins Effective Marketing Plan
Goins Effective Marketing PlanKelly Goins, MBA
 
Innovative competitive advantages in business notes
Innovative competitive advantages in business notesInnovative competitive advantages in business notes
Innovative competitive advantages in business notesAylya B.S
 
A study on effectiveness of cause related marketing [crm] as a strategic phil...
A study on effectiveness of cause related marketing [crm] as a strategic phil...A study on effectiveness of cause related marketing [crm] as a strategic phil...
A study on effectiveness of cause related marketing [crm] as a strategic phil...IAEME Publication
 
Sales force competence management
Sales force competence managementSales force competence management
Sales force competence managementAlexander Decker
 
MKT574 WK1 Assignment Concepts and Applications WorksheetWorks
MKT574 WK1 Assignment Concepts and Applications WorksheetWorksMKT574 WK1 Assignment Concepts and Applications WorksheetWorks
MKT574 WK1 Assignment Concepts and Applications WorksheetWorksIlonaThornburg83
 
ASSIGNMENT PROJECT FRONT SHEET CIM Membership Number Module Title
ASSIGNMENT PROJECT FRONT SHEET CIM Membership Number  Module TitleASSIGNMENT PROJECT FRONT SHEET CIM Membership Number  Module Title
ASSIGNMENT PROJECT FRONT SHEET CIM Membership Number Module TitleAudrey Britton
 
Introduction to strategic marketing planning
Introduction to strategic marketing planningIntroduction to strategic marketing planning
Introduction to strategic marketing planningMaxwell Ranasinghe
 
Running Head Marketing PlanSWOT Analysis .docx
Running Head Marketing PlanSWOT Analysis                      .docxRunning Head Marketing PlanSWOT Analysis                      .docx
Running Head Marketing PlanSWOT Analysis .docxcowinhelen
 

Similar to Improving Marketing’s Contribution toNew Product Development.docx (20)

Marketing Mix Startegies and Its Impact on Organizational Performance Efficie...
Marketing Mix Startegies and Its Impact on Organizational Performance Efficie...Marketing Mix Startegies and Its Impact on Organizational Performance Efficie...
Marketing Mix Startegies and Its Impact on Organizational Performance Efficie...
 
MCM741_6-1InvestigationPaper_Stansell
MCM741_6-1InvestigationPaper_StansellMCM741_6-1InvestigationPaper_Stansell
MCM741_6-1InvestigationPaper_Stansell
 
Linking Design, Marketing, and Innovation: Managing the Connection for Compet...
Linking Design, Marketing, and Innovation: Managing the Connection for Compet...Linking Design, Marketing, and Innovation: Managing the Connection for Compet...
Linking Design, Marketing, and Innovation: Managing the Connection for Compet...
 
TOPIC_1_Introduction_to_Product_Manageme.ppt
TOPIC_1_Introduction_to_Product_Manageme.pptTOPIC_1_Introduction_to_Product_Manageme.ppt
TOPIC_1_Introduction_to_Product_Manageme.ppt
 
Internal marketing
Internal marketingInternal marketing
Internal marketing
 
Aligning sales and operations management an agenda for inquir.docx
Aligning sales and operations management an agenda for inquir.docxAligning sales and operations management an agenda for inquir.docx
Aligning sales and operations management an agenda for inquir.docx
 
Marketing Involvement in New product development
Marketing Involvement in New product development Marketing Involvement in New product development
Marketing Involvement in New product development
 
Goins Effective Marketing Plan
Goins Effective Marketing PlanGoins Effective Marketing Plan
Goins Effective Marketing Plan
 
Chapter 2 sales and marketing strategy of sm es
Chapter 2  sales and marketing strategy of sm esChapter 2  sales and marketing strategy of sm es
Chapter 2 sales and marketing strategy of sm es
 
Agnes Jumah, Marketing Metrics
Agnes Jumah, Marketing MetricsAgnes Jumah, Marketing Metrics
Agnes Jumah, Marketing Metrics
 
Innovative competitive advantages in business notes
Innovative competitive advantages in business notesInnovative competitive advantages in business notes
Innovative competitive advantages in business notes
 
Mm 2 for class
Mm 2 for classMm 2 for class
Mm 2 for class
 
A study on effectiveness of cause related marketing [crm] as a strategic phil...
A study on effectiveness of cause related marketing [crm] as a strategic phil...A study on effectiveness of cause related marketing [crm] as a strategic phil...
A study on effectiveness of cause related marketing [crm] as a strategic phil...
 
Sales force competence management
Sales force competence managementSales force competence management
Sales force competence management
 
MKT574 WK1 Assignment Concepts and Applications WorksheetWorks
MKT574 WK1 Assignment Concepts and Applications WorksheetWorksMKT574 WK1 Assignment Concepts and Applications WorksheetWorks
MKT574 WK1 Assignment Concepts and Applications WorksheetWorks
 
Sales management
Sales managementSales management
Sales management
 
ASSIGNMENT PROJECT FRONT SHEET CIM Membership Number Module Title
ASSIGNMENT PROJECT FRONT SHEET CIM Membership Number  Module TitleASSIGNMENT PROJECT FRONT SHEET CIM Membership Number  Module Title
ASSIGNMENT PROJECT FRONT SHEET CIM Membership Number Module Title
 
Introduction to strategic marketing planning
Introduction to strategic marketing planningIntroduction to strategic marketing planning
Introduction to strategic marketing planning
 
Running Head Marketing PlanSWOT Analysis .docx
Running Head Marketing PlanSWOT Analysis                      .docxRunning Head Marketing PlanSWOT Analysis                      .docx
Running Head Marketing PlanSWOT Analysis .docx
 
SCOPE OF MARKETING
SCOPE OF MARKETINGSCOPE OF MARKETING
SCOPE OF MARKETING
 

More from wilcockiris

Barbara Silva is the CIO for Peachtree Community Hospital in Atlanta.docx
Barbara Silva is the CIO for Peachtree Community Hospital in Atlanta.docxBarbara Silva is the CIO for Peachtree Community Hospital in Atlanta.docx
Barbara Silva is the CIO for Peachtree Community Hospital in Atlanta.docxwilcockiris
 
BARGAIN CITY Your career is moving along faster than you e.docx
BARGAIN CITY Your career is moving along faster than you e.docxBARGAIN CITY Your career is moving along faster than you e.docx
BARGAIN CITY Your career is moving along faster than you e.docxwilcockiris
 
Barbara schedules a meeting with a core group of clinic  managers. T.docx
Barbara schedules a meeting with a core group of clinic  managers. T.docxBarbara schedules a meeting with a core group of clinic  managers. T.docx
Barbara schedules a meeting with a core group of clinic  managers. T.docxwilcockiris
 
Barbara schedules a meeting with a core group of clinic managers.docx
Barbara schedules a meeting with a core group of clinic managers.docxBarbara schedules a meeting with a core group of clinic managers.docx
Barbara schedules a meeting with a core group of clinic managers.docxwilcockiris
 
Barbara schedules a meeting with a core group of clinic managers. Th.docx
Barbara schedules a meeting with a core group of clinic managers. Th.docxBarbara schedules a meeting with a core group of clinic managers. Th.docx
Barbara schedules a meeting with a core group of clinic managers. Th.docxwilcockiris
 
Barbara Rosenwein, A Short History of the Middle Ages 4th edition (U.docx
Barbara Rosenwein, A Short History of the Middle Ages 4th edition (U.docxBarbara Rosenwein, A Short History of the Middle Ages 4th edition (U.docx
Barbara Rosenwein, A Short History of the Middle Ages 4th edition (U.docxwilcockiris
 
BARBARA NGAM, MPAShoreline, WA 98155 ▪ 801.317.5999 ▪ [email pro.docx
BARBARA NGAM, MPAShoreline, WA 98155 ▪ 801.317.5999 ▪ [email pro.docxBARBARA NGAM, MPAShoreline, WA 98155 ▪ 801.317.5999 ▪ [email pro.docx
BARBARA NGAM, MPAShoreline, WA 98155 ▪ 801.317.5999 ▪ [email pro.docxwilcockiris
 
Banks 5Maya BanksProfessor Debra MartinEN106DLGU1A2018.docx
Banks    5Maya BanksProfessor Debra MartinEN106DLGU1A2018.docxBanks    5Maya BanksProfessor Debra MartinEN106DLGU1A2018.docx
Banks 5Maya BanksProfessor Debra MartinEN106DLGU1A2018.docxwilcockiris
 
Banking industry•Databases that storeocorporate sensiti.docx
Banking industry•Databases that storeocorporate sensiti.docxBanking industry•Databases that storeocorporate sensiti.docx
Banking industry•Databases that storeocorporate sensiti.docxwilcockiris
 
BAOL 531 Managerial AccountingWeek Three Article Research Pape.docx
BAOL 531 Managerial AccountingWeek Three Article Research Pape.docxBAOL 531 Managerial AccountingWeek Three Article Research Pape.docx
BAOL 531 Managerial AccountingWeek Three Article Research Pape.docxwilcockiris
 
bankCustomer1223333SmithJamesbbbbbb12345 Abrams Rd Dallas TX 75043.docx
bankCustomer1223333SmithJamesbbbbbb12345 Abrams Rd Dallas TX 75043.docxbankCustomer1223333SmithJamesbbbbbb12345 Abrams Rd Dallas TX 75043.docx
bankCustomer1223333SmithJamesbbbbbb12345 Abrams Rd Dallas TX 75043.docxwilcockiris
 
Barbara and Judi entered into a contract with Linda, which provi.docx
Barbara and Judi entered into a contract with Linda, which provi.docxBarbara and Judi entered into a contract with Linda, which provi.docx
Barbara and Judi entered into a contract with Linda, which provi.docxwilcockiris
 
bappsum.indd 614 182014 30258 PMHuman Reso.docx
bappsum.indd   614 182014   30258 PMHuman Reso.docxbappsum.indd   614 182014   30258 PMHuman Reso.docx
bappsum.indd 614 182014 30258 PMHuman Reso.docxwilcockiris
 
Bank ReservesSuppose that the reserve ratio is .25, and that a b.docx
Bank ReservesSuppose that the reserve ratio is .25, and that a b.docxBank ReservesSuppose that the reserve ratio is .25, and that a b.docx
Bank ReservesSuppose that the reserve ratio is .25, and that a b.docxwilcockiris
 
Bank Services, Grading GuideFIN366 Version 21Individual.docx
Bank Services, Grading GuideFIN366 Version 21Individual.docxBank Services, Grading GuideFIN366 Version 21Individual.docx
Bank Services, Grading GuideFIN366 Version 21Individual.docxwilcockiris
 
Baldwins Kentucky Revised Statutes AnnotatedTitle XXXV. Domesti.docx
Baldwins Kentucky Revised Statutes AnnotatedTitle XXXV. Domesti.docxBaldwins Kentucky Revised Statutes AnnotatedTitle XXXV. Domesti.docx
Baldwins Kentucky Revised Statutes AnnotatedTitle XXXV. Domesti.docxwilcockiris
 
Bank confirmations are critical to the cash audit. What information .docx
Bank confirmations are critical to the cash audit. What information .docxBank confirmations are critical to the cash audit. What information .docx
Bank confirmations are critical to the cash audit. What information .docxwilcockiris
 
BalShtBalance SheetBalance SheetBalance SheetBalance SheetThe Fran.docx
BalShtBalance SheetBalance SheetBalance SheetBalance SheetThe Fran.docxBalShtBalance SheetBalance SheetBalance SheetBalance SheetThe Fran.docx
BalShtBalance SheetBalance SheetBalance SheetBalance SheetThe Fran.docxwilcockiris
 
BAM 515 - Organizational Behavior(Enter your answers on th.docx
BAM 515 - Organizational Behavior(Enter your answers on th.docxBAM 515 - Organizational Behavior(Enter your answers on th.docx
BAM 515 - Organizational Behavior(Enter your answers on th.docxwilcockiris
 
BalanchineGeorge Balanchine is an important figure in the histor.docx
BalanchineGeorge Balanchine is an important figure in the histor.docxBalanchineGeorge Balanchine is an important figure in the histor.docx
BalanchineGeorge Balanchine is an important figure in the histor.docxwilcockiris
 

More from wilcockiris (20)

Barbara Silva is the CIO for Peachtree Community Hospital in Atlanta.docx
Barbara Silva is the CIO for Peachtree Community Hospital in Atlanta.docxBarbara Silva is the CIO for Peachtree Community Hospital in Atlanta.docx
Barbara Silva is the CIO for Peachtree Community Hospital in Atlanta.docx
 
BARGAIN CITY Your career is moving along faster than you e.docx
BARGAIN CITY Your career is moving along faster than you e.docxBARGAIN CITY Your career is moving along faster than you e.docx
BARGAIN CITY Your career is moving along faster than you e.docx
 
Barbara schedules a meeting with a core group of clinic  managers. T.docx
Barbara schedules a meeting with a core group of clinic  managers. T.docxBarbara schedules a meeting with a core group of clinic  managers. T.docx
Barbara schedules a meeting with a core group of clinic  managers. T.docx
 
Barbara schedules a meeting with a core group of clinic managers.docx
Barbara schedules a meeting with a core group of clinic managers.docxBarbara schedules a meeting with a core group of clinic managers.docx
Barbara schedules a meeting with a core group of clinic managers.docx
 
Barbara schedules a meeting with a core group of clinic managers. Th.docx
Barbara schedules a meeting with a core group of clinic managers. Th.docxBarbara schedules a meeting with a core group of clinic managers. Th.docx
Barbara schedules a meeting with a core group of clinic managers. Th.docx
 
Barbara Rosenwein, A Short History of the Middle Ages 4th edition (U.docx
Barbara Rosenwein, A Short History of the Middle Ages 4th edition (U.docxBarbara Rosenwein, A Short History of the Middle Ages 4th edition (U.docx
Barbara Rosenwein, A Short History of the Middle Ages 4th edition (U.docx
 
BARBARA NGAM, MPAShoreline, WA 98155 ▪ 801.317.5999 ▪ [email pro.docx
BARBARA NGAM, MPAShoreline, WA 98155 ▪ 801.317.5999 ▪ [email pro.docxBARBARA NGAM, MPAShoreline, WA 98155 ▪ 801.317.5999 ▪ [email pro.docx
BARBARA NGAM, MPAShoreline, WA 98155 ▪ 801.317.5999 ▪ [email pro.docx
 
Banks 5Maya BanksProfessor Debra MartinEN106DLGU1A2018.docx
Banks    5Maya BanksProfessor Debra MartinEN106DLGU1A2018.docxBanks    5Maya BanksProfessor Debra MartinEN106DLGU1A2018.docx
Banks 5Maya BanksProfessor Debra MartinEN106DLGU1A2018.docx
 
Banking industry•Databases that storeocorporate sensiti.docx
Banking industry•Databases that storeocorporate sensiti.docxBanking industry•Databases that storeocorporate sensiti.docx
Banking industry•Databases that storeocorporate sensiti.docx
 
BAOL 531 Managerial AccountingWeek Three Article Research Pape.docx
BAOL 531 Managerial AccountingWeek Three Article Research Pape.docxBAOL 531 Managerial AccountingWeek Three Article Research Pape.docx
BAOL 531 Managerial AccountingWeek Three Article Research Pape.docx
 
bankCustomer1223333SmithJamesbbbbbb12345 Abrams Rd Dallas TX 75043.docx
bankCustomer1223333SmithJamesbbbbbb12345 Abrams Rd Dallas TX 75043.docxbankCustomer1223333SmithJamesbbbbbb12345 Abrams Rd Dallas TX 75043.docx
bankCustomer1223333SmithJamesbbbbbb12345 Abrams Rd Dallas TX 75043.docx
 
Barbara and Judi entered into a contract with Linda, which provi.docx
Barbara and Judi entered into a contract with Linda, which provi.docxBarbara and Judi entered into a contract with Linda, which provi.docx
Barbara and Judi entered into a contract with Linda, which provi.docx
 
bappsum.indd 614 182014 30258 PMHuman Reso.docx
bappsum.indd   614 182014   30258 PMHuman Reso.docxbappsum.indd   614 182014   30258 PMHuman Reso.docx
bappsum.indd 614 182014 30258 PMHuman Reso.docx
 
Bank ReservesSuppose that the reserve ratio is .25, and that a b.docx
Bank ReservesSuppose that the reserve ratio is .25, and that a b.docxBank ReservesSuppose that the reserve ratio is .25, and that a b.docx
Bank ReservesSuppose that the reserve ratio is .25, and that a b.docx
 
Bank Services, Grading GuideFIN366 Version 21Individual.docx
Bank Services, Grading GuideFIN366 Version 21Individual.docxBank Services, Grading GuideFIN366 Version 21Individual.docx
Bank Services, Grading GuideFIN366 Version 21Individual.docx
 
Baldwins Kentucky Revised Statutes AnnotatedTitle XXXV. Domesti.docx
Baldwins Kentucky Revised Statutes AnnotatedTitle XXXV. Domesti.docxBaldwins Kentucky Revised Statutes AnnotatedTitle XXXV. Domesti.docx
Baldwins Kentucky Revised Statutes AnnotatedTitle XXXV. Domesti.docx
 
Bank confirmations are critical to the cash audit. What information .docx
Bank confirmations are critical to the cash audit. What information .docxBank confirmations are critical to the cash audit. What information .docx
Bank confirmations are critical to the cash audit. What information .docx
 
BalShtBalance SheetBalance SheetBalance SheetBalance SheetThe Fran.docx
BalShtBalance SheetBalance SheetBalance SheetBalance SheetThe Fran.docxBalShtBalance SheetBalance SheetBalance SheetBalance SheetThe Fran.docx
BalShtBalance SheetBalance SheetBalance SheetBalance SheetThe Fran.docx
 
BAM 515 - Organizational Behavior(Enter your answers on th.docx
BAM 515 - Organizational Behavior(Enter your answers on th.docxBAM 515 - Organizational Behavior(Enter your answers on th.docx
BAM 515 - Organizational Behavior(Enter your answers on th.docx
 
BalanchineGeorge Balanchine is an important figure in the histor.docx
BalanchineGeorge Balanchine is an important figure in the histor.docxBalanchineGeorge Balanchine is an important figure in the histor.docx
BalanchineGeorge Balanchine is an important figure in the histor.docx
 

Recently uploaded

Nutritional Needs Presentation - HLTH 104
Nutritional Needs Presentation - HLTH 104Nutritional Needs Presentation - HLTH 104
Nutritional Needs Presentation - HLTH 104misteraugie
 
microwave assisted reaction. General introduction
microwave assisted reaction. General introductionmicrowave assisted reaction. General introduction
microwave assisted reaction. General introductionMaksud Ahmed
 
Sports & Fitness Value Added Course FY..
Sports & Fitness Value Added Course FY..Sports & Fitness Value Added Course FY..
Sports & Fitness Value Added Course FY..Disha Kariya
 
SOCIAL AND HISTORICAL CONTEXT - LFTVD.pptx
SOCIAL AND HISTORICAL CONTEXT - LFTVD.pptxSOCIAL AND HISTORICAL CONTEXT - LFTVD.pptx
SOCIAL AND HISTORICAL CONTEXT - LFTVD.pptxiammrhaywood
 
social pharmacy d-pharm 1st year by Pragati K. Mahajan
social pharmacy d-pharm 1st year by Pragati K. Mahajansocial pharmacy d-pharm 1st year by Pragati K. Mahajan
social pharmacy d-pharm 1st year by Pragati K. Mahajanpragatimahajan3
 
A Critique of the Proposed National Education Policy Reform
A Critique of the Proposed National Education Policy ReformA Critique of the Proposed National Education Policy Reform
A Critique of the Proposed National Education Policy ReformChameera Dedduwage
 
The Most Excellent Way | 1 Corinthians 13
The Most Excellent Way | 1 Corinthians 13The Most Excellent Way | 1 Corinthians 13
The Most Excellent Way | 1 Corinthians 13Steve Thomason
 
Disha NEET Physics Guide for classes 11 and 12.pdf
Disha NEET Physics Guide for classes 11 and 12.pdfDisha NEET Physics Guide for classes 11 and 12.pdf
Disha NEET Physics Guide for classes 11 and 12.pdfchloefrazer622
 
fourth grading exam for kindergarten in writing
fourth grading exam for kindergarten in writingfourth grading exam for kindergarten in writing
fourth grading exam for kindergarten in writingTeacherCyreneCayanan
 
Explore beautiful and ugly buildings. Mathematics helps us create beautiful d...
Explore beautiful and ugly buildings. Mathematics helps us create beautiful d...Explore beautiful and ugly buildings. Mathematics helps us create beautiful d...
Explore beautiful and ugly buildings. Mathematics helps us create beautiful d...christianmathematics
 
Ecosystem Interactions Class Discussion Presentation in Blue Green Lined Styl...
Ecosystem Interactions Class Discussion Presentation in Blue Green Lined Styl...Ecosystem Interactions Class Discussion Presentation in Blue Green Lined Styl...
Ecosystem Interactions Class Discussion Presentation in Blue Green Lined Styl...fonyou31
 
Beyond the EU: DORA and NIS 2 Directive's Global Impact
Beyond the EU: DORA and NIS 2 Directive's Global ImpactBeyond the EU: DORA and NIS 2 Directive's Global Impact
Beyond the EU: DORA and NIS 2 Directive's Global ImpactPECB
 
General AI for Medical Educators April 2024
General AI for Medical Educators April 2024General AI for Medical Educators April 2024
General AI for Medical Educators April 2024Janet Corral
 
Russian Escort Service in Delhi 11k Hotel Foreigner Russian Call Girls in Delhi
Russian Escort Service in Delhi 11k Hotel Foreigner Russian Call Girls in DelhiRussian Escort Service in Delhi 11k Hotel Foreigner Russian Call Girls in Delhi
Russian Escort Service in Delhi 11k Hotel Foreigner Russian Call Girls in Delhikauryashika82
 
9548086042 for call girls in Indira Nagar with room service
9548086042  for call girls in Indira Nagar  with room service9548086042  for call girls in Indira Nagar  with room service
9548086042 for call girls in Indira Nagar with room servicediscovermytutordmt
 
Call Girls in Dwarka Mor Delhi Contact Us 9654467111
Call Girls in Dwarka Mor Delhi Contact Us 9654467111Call Girls in Dwarka Mor Delhi Contact Us 9654467111
Call Girls in Dwarka Mor Delhi Contact Us 9654467111Sapana Sha
 
BASLIQ CURRENT LOOKBOOK LOOKBOOK(1) (1).pdf
BASLIQ CURRENT LOOKBOOK  LOOKBOOK(1) (1).pdfBASLIQ CURRENT LOOKBOOK  LOOKBOOK(1) (1).pdf
BASLIQ CURRENT LOOKBOOK LOOKBOOK(1) (1).pdfSoniaTolstoy
 
The basics of sentences session 2pptx copy.pptx
The basics of sentences session 2pptx copy.pptxThe basics of sentences session 2pptx copy.pptx
The basics of sentences session 2pptx copy.pptxheathfieldcps1
 
Presentation by Andreas Schleicher Tackling the School Absenteeism Crisis 30 ...
Presentation by Andreas Schleicher Tackling the School Absenteeism Crisis 30 ...Presentation by Andreas Schleicher Tackling the School Absenteeism Crisis 30 ...
Presentation by Andreas Schleicher Tackling the School Absenteeism Crisis 30 ...EduSkills OECD
 

Recently uploaded (20)

Nutritional Needs Presentation - HLTH 104
Nutritional Needs Presentation - HLTH 104Nutritional Needs Presentation - HLTH 104
Nutritional Needs Presentation - HLTH 104
 
microwave assisted reaction. General introduction
microwave assisted reaction. General introductionmicrowave assisted reaction. General introduction
microwave assisted reaction. General introduction
 
Sports & Fitness Value Added Course FY..
Sports & Fitness Value Added Course FY..Sports & Fitness Value Added Course FY..
Sports & Fitness Value Added Course FY..
 
SOCIAL AND HISTORICAL CONTEXT - LFTVD.pptx
SOCIAL AND HISTORICAL CONTEXT - LFTVD.pptxSOCIAL AND HISTORICAL CONTEXT - LFTVD.pptx
SOCIAL AND HISTORICAL CONTEXT - LFTVD.pptx
 
social pharmacy d-pharm 1st year by Pragati K. Mahajan
social pharmacy d-pharm 1st year by Pragati K. Mahajansocial pharmacy d-pharm 1st year by Pragati K. Mahajan
social pharmacy d-pharm 1st year by Pragati K. Mahajan
 
A Critique of the Proposed National Education Policy Reform
A Critique of the Proposed National Education Policy ReformA Critique of the Proposed National Education Policy Reform
A Critique of the Proposed National Education Policy Reform
 
The Most Excellent Way | 1 Corinthians 13
The Most Excellent Way | 1 Corinthians 13The Most Excellent Way | 1 Corinthians 13
The Most Excellent Way | 1 Corinthians 13
 
Disha NEET Physics Guide for classes 11 and 12.pdf
Disha NEET Physics Guide for classes 11 and 12.pdfDisha NEET Physics Guide for classes 11 and 12.pdf
Disha NEET Physics Guide for classes 11 and 12.pdf
 
fourth grading exam for kindergarten in writing
fourth grading exam for kindergarten in writingfourth grading exam for kindergarten in writing
fourth grading exam for kindergarten in writing
 
Explore beautiful and ugly buildings. Mathematics helps us create beautiful d...
Explore beautiful and ugly buildings. Mathematics helps us create beautiful d...Explore beautiful and ugly buildings. Mathematics helps us create beautiful d...
Explore beautiful and ugly buildings. Mathematics helps us create beautiful d...
 
Ecosystem Interactions Class Discussion Presentation in Blue Green Lined Styl...
Ecosystem Interactions Class Discussion Presentation in Blue Green Lined Styl...Ecosystem Interactions Class Discussion Presentation in Blue Green Lined Styl...
Ecosystem Interactions Class Discussion Presentation in Blue Green Lined Styl...
 
Beyond the EU: DORA and NIS 2 Directive's Global Impact
Beyond the EU: DORA and NIS 2 Directive's Global ImpactBeyond the EU: DORA and NIS 2 Directive's Global Impact
Beyond the EU: DORA and NIS 2 Directive's Global Impact
 
General AI for Medical Educators April 2024
General AI for Medical Educators April 2024General AI for Medical Educators April 2024
General AI for Medical Educators April 2024
 
Russian Escort Service in Delhi 11k Hotel Foreigner Russian Call Girls in Delhi
Russian Escort Service in Delhi 11k Hotel Foreigner Russian Call Girls in DelhiRussian Escort Service in Delhi 11k Hotel Foreigner Russian Call Girls in Delhi
Russian Escort Service in Delhi 11k Hotel Foreigner Russian Call Girls in Delhi
 
9548086042 for call girls in Indira Nagar with room service
9548086042  for call girls in Indira Nagar  with room service9548086042  for call girls in Indira Nagar  with room service
9548086042 for call girls in Indira Nagar with room service
 
Call Girls in Dwarka Mor Delhi Contact Us 9654467111
Call Girls in Dwarka Mor Delhi Contact Us 9654467111Call Girls in Dwarka Mor Delhi Contact Us 9654467111
Call Girls in Dwarka Mor Delhi Contact Us 9654467111
 
BASLIQ CURRENT LOOKBOOK LOOKBOOK(1) (1).pdf
BASLIQ CURRENT LOOKBOOK  LOOKBOOK(1) (1).pdfBASLIQ CURRENT LOOKBOOK  LOOKBOOK(1) (1).pdf
BASLIQ CURRENT LOOKBOOK LOOKBOOK(1) (1).pdf
 
Mattingly "AI & Prompt Design: The Basics of Prompt Design"
Mattingly "AI & Prompt Design: The Basics of Prompt Design"Mattingly "AI & Prompt Design: The Basics of Prompt Design"
Mattingly "AI & Prompt Design: The Basics of Prompt Design"
 
The basics of sentences session 2pptx copy.pptx
The basics of sentences session 2pptx copy.pptxThe basics of sentences session 2pptx copy.pptx
The basics of sentences session 2pptx copy.pptx
 
Presentation by Andreas Schleicher Tackling the School Absenteeism Crisis 30 ...
Presentation by Andreas Schleicher Tackling the School Absenteeism Crisis 30 ...Presentation by Andreas Schleicher Tackling the School Absenteeism Crisis 30 ...
Presentation by Andreas Schleicher Tackling the School Absenteeism Crisis 30 ...
 

Improving Marketing’s Contribution toNew Product Development.docx

  • 1. Improving Marketing’s Contribution to New Product Development Wenzel Drechsler, Martin Natter, and Peter S. H. Leeflang In many firms, the marketing department plays a minor role in new product development (NPD). However, recent research demonstrates that marketing capabilities more strongly influence firm performance than other areas such as research and development. This finding underscores the importance of identifying relevant capabilities that can improve the position of marketing within the NPD process as part of the quest to improve innovation performance. However, thus far, it has remained unclear precisely how the marketing department can increase its influence on NPD to enhance a firm’s innovation performance. The results of this study demonstrate that the relationship between marketing capabilities and innovation performance is generally mediated by the decision influence of marketing on NPD. In particular, both marketing research quality and the ability to translate customer needs into product charac- teristics serve to increase marketing’s influence on NPD. This increased influence, in turn, positively contributes to overall firm innovation performance. Hence, these results show that in addition to having the appropriate marketing capabilities, the marketing department must achieve a status in which these capabilities can translate into performance implications. Introduction T he creation of new products is an important strat-
  • 2. egy for any firm trying to survive in highly com- petitive and fragmented markets. Each new product development (NPD) project usually involves identifying customer needs and conducting a preliminary market assessment (Calantone and di Benedetto, 1988). However, managers often believe that marketing research fails to provide timely, accurate, and relevant information about consumers and markets relevant to decision making (Johnson and Ambrose, 2009). In particular, they are convinced that new product failure rates are still high1 due to a flawed understanding of consumer preferences and market needs (Cooper and Kleinschmidt, 1995; Johnson and Ambrose, 2009). Identifying and assessing opportunities for the devel- opment of new products usually falls under marketing’s domain, because this process represents the customer– product connection (Fine, 2009; Moorman and Rust 1999). Kandybin and Kihn (2004) propose that top inno- vators heavily involve the marketing department in the NPD process. However, the prevailing view in most com- panies is that marketing offers no distinct function; in other words, there is a sense that everyone can do market- ing (McKenna, 1991; Sheth and Sisodia, 2005). This is one of the reasons why marketing is in heavy decline and further implies that little attention is paid to the marketing department’s knowledge and opinion (Webster, Malter, and Ganesan, 2005). In addition, prior research indicates that especially in NPD, the research and development (R&D) department often dominates the marketing depart- ment (e.g., Rein, 2004; Workman, 1993). The question arises regarding which specific capabili-
  • 3. ties marketing departments require to contribute to the success of NPD. From the R&D perspective, marketing could increase its influence by improving the credibility of its knowledge with respect to NPD (Workman, 1993). Considering this concept, Atuahene-Gima and Evange- lista (2000) show that increased “expert power,” defined as “the degree to which an individual is regarded as having expert knowledge about the relevant issues in the NPD process,” leads to increased marketing department influence on the NPD process. Because the role of marketing has been either mini- mized or eliminated in many firms, recent research has considered how marketing departments can reestablish their integrity and their influence on corporate decisions (e.g., Verhoef and Leeflang, 2009; Webster, 2005). According to Verhoef and Leeflang (2009) and Verhoef et al. (2011), the marketing department’s ability to link its Address correspondence to: Wenzel Drechsler, Goethe University Frankfurt, Department of Marketing, Strothoff Chair of Retailing, Grueneb- urgplatz 1, 60054 Frankfurt, Germany. E-mail: [email protected] wiwi.uni-frankfurt.de. Tel: +49 (0)69 798 34637. 1 Estimates of failure rates vary from more than 50% to approximately 80–90% (Johnson and Ambrose, 2009; Sachdev, 2001; Sudhir and Rao, 2006). J PROD INNOV MANAG 2013;30(2):298–315 © 2012 Product Development & Management Association DOI: 10.1111/j.1540-5885.2012.01010.x
  • 4. strategies and actions to financial performance measures (accountability) is a major factor driving its overall influ- ence within the firm. They also show that being innova- tive with regard to NPD is another major driver of respect and influence for marketing departments. However, knowledge about specific capabilities that improve the marketing department’s contribution to NPD is scarce (Atuahene-Gima and Evangelista, 2000; Griffin and Hauser, 1996). This lack of knowledge calls for the devel- opment of a more specific framework that identifies these relevant marketing capabilities in order to improve mar- keting’s position in NPD and, subsequently, a firm’s innovation performance. The present study aims to empirically investigate the relationship between marketing capabilities and innova- tion performance, as mediated by the influence of mar- keting on NPD. Therefore, this study first identifies marketing capabilities that are relevant for NPD. Then the study investigates whether these capabilities help the marketing department strengthen its position and influ- ence within the NPD process. Finally, the study links the marketing department’s influence and capabilities to firm innovation performance. The study’s results provide evidence that firms with strong marketing departments are more successful with their new products. This competitive advantage is attrib- uted to how marketing-related capabilities contribute to the marketing department’s influence on NPD issues. Hence, these findings reveal that firms need not only key marketing capabilities and skills but also a marketing department that itself functions as an expert to execute
  • 5. the relevant functions with respect to NPD. The remainder of the paper is organized as follows. The first section discusses general characteristics of mar- keting capabilities; it is followed by the introduction of the conceptual model. The next section specifies the hypotheses and expected effects. This section is followed by a discussion of the data and variables and the presen- tation of the model. The final sections present the empiri- cal results and discuss the main conclusions. Conceptual Model The literature suggests that distinct capabilities more than resources help some firms outperform others (Grant, 1996; Teece, Pisano, and Shuen, 1997). In particular, these capa- bilities are manifested in specific business activities such as developing new products (Day, 1994) and are therefore important to identify. Adopting a knowledge-based view, the present study views capabilities as embodied in the knowledge and skills of employees and thus located within a firm’s different departments. A closer look at the NPD process helps to identify specific marketing capabilities that are relevant for the success of new products. The new NPD process is defined as the process of generating and transforming new product ideas into commercial outputs as an integrated flow (Calantone and di Benedetto, 1988). Throughout this process, the marketing department’s main tasks are to identify and understand customer needs and to assess the market potential of new product ideas (Calantone and di Benedetto, 1988; Ernst, Hoyer, and Rübsaamen, 2010). Thus, the marketing department’s capabilities are based on knowledge about customer needs, past experience, forecasting, and responding to needs (Day, 1994). Prior
  • 6. research proposes that by increasing such distinct knowl- edge and by demonstrating relevant skills, the marketing department should be able to achieve higher levels of status within specific business activities such as NPD (Leonard-Barton, 1992). In the context of NPD, the marketing department usually conducts marketing research in order to gain rel- evant information about customer needs and new product ideas. Formal research is undertaken because managers expect the resulting information to minimize uncertainty when making important decisions in areas such as NPD (Deshpandé and Zaltman, 1982). Hence, the ability to acquire knowledge based upon high-quality marketing research is a crucial capability that should relate to the influence of marketing on NPD. According to Moorman and Rust (1999), marketing’s emphasis is also on provid- BIOGRAPHICAL SKETCHES Dr. Wenzel Drechsler received his Ph.D. from the Marketing Department, Goethe University Frankfurt, Germany. His research interests include pricing, marketing strategy, and innovation management. His research papers have been published in journals such as Journal of Product Innovation Management, Journal of Interactive Marketing, Technology Analysis and Strategic Management, and Journal of Business Research. Prof. Martin Natter is the Hans Strothoff Chair of Retail Marketing at the Goethe University Frankfurt, Germany. He received his
  • 7. Ph.D. from Vienna University of Economics and Business Administration, Austria. His research interests include retail pricing, new product decisions, and competitive analysis. His research papers have been published in jour- nals such as Management Science, Journal of Marketing, and Marketing Science. Prof. Peter S. H. Leeflang is the Distinguished Frank M. Bass Professor of Marketing, Department of Marketing, Faculty of Economics and Business, University of Groningen, the Netherlands. He also holds the BAT-chair of Marketing at LUISS Guido Carli at Rome, Italy, and a Research Chair at the Aston Business School of Aston University, United Kingdom. He is member of the Royal Academy of Arts and Sciences in the Netherlands. IMPROVING MARKETING’S CONTRIBUTION TO NPD J PROD INNOV MANAG 299 2013;30(2):298–315 ing knowledge and skills that connect the customer to product design, functionalities, and quality issues. Hence, marketing’s ability to translate customer needs into tech- nical specifications, i.e., its technical skills (TS), should on the one hand help reduce the number of products that
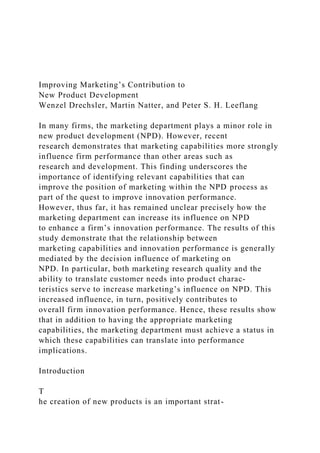
  • 8. fail to satisfy market needs. On the other hand, good TS should also be valued by other areas including the R&D department as they increase the marketing department’s credibility (Moorman and Rust, 1999; Workman, 1993). The latter point also applies to the marketing depart- ment’s general knowledge of marketing and business issues (e.g., Enright, 2005). In particular, this capability should allow the marketing department to support man- agement in detailed business analyses concerning deci- sions such as the selection of the most promising new product ideas (Calantone and di Benedetto, 1988). The discussion above shows that with respect to NPD, the marketing department’s capabilities are mainly knowledge based and rely on the acquisition, manage- ment, and use of information. Usually, this knowledge is tacitly held and difficult for rivals to copy due to its imperfect imitability (Day, 1994; Krasnikov and Jay- achandran, 2008). The conceptual model in Figure 1 is based on the assumption that specific knowledge (capabilities) of the marketing department can only contribute to the success of new products when the marketing department has the power to influence important decisions. This assumption is based on literature indicating that good capabilities and skills within marketing departments are regarded as crucial for fostering innovation success and strengthening the marketing department’s position within the overall innovation process (Atuahene-Gima and Evangelista, 2000). Hence, this discussion suggests that the relation- ship between marketing capabilities and innovation per- formance is mediated by the marketing department’s influence on NPD. Therefore, the marketing department’s knowledge-based capabilities (marketing research
  • 9. quality [MR], TS, knowledge about marketing and general management [MK]) are linked to the marketing department’s influence on NPD. Following Homburg, Workman, and Krohmer (1999), marketing’s influence is defined as the exercised power of the marketing depart- ment. Accordingly, this study uses two variables to measure this influence: (1) the decision influence (DI) on NPD (MI1) and (2) the fraction of new products or ser- vices (NPD projects) initiated by the marketing depart- ment (MI2). To assess their mediating role, these two influence measures are directly linked to firm innovation performance. A firm’s innovation performance is linked to its overall business performance to establish the convergent Business Performance (BP) Controls: •General innovativeness •Number of new products •Firm size •Short-term emphasis Marketing's Influence on NPD • Decision influence (MI1)
  • 10. • Initiated NPD projects (MI2) Controls • Past market development • Generic strategy Controls: Marketing Department Characteristics • Accountability • Integration/Cooperation with R&D Firm Characteristics • CEO – Technical background • CEO – Marketing background • B2C versus B2B • Goods versus services Environmental Characteristics • Market-related turbulence Innovation Performance (IP) Knowledge-Based
  • 11. Marketing Capabilities • Marketing research quality (MR) • Technical skills (TS) • Knowledge about marketing & general management (MK) Main paths of interest Control paths Figure 1. Conceptual Model NPD, new product development 300 J PROD INNOV MANAG W. DRECHSLER ET AL. 2013;30(2):298–315 validity of the proposed conceptual model (Srivastava, Shervani, and Fahey, 1999). In addition to considering elements of financial performance such as profitability, sales, and cost level, the overall business performance measure used in this study also captures nonfinancial elements of performance such as customer satisfaction and customer loyalty (cf. Appendix A). To account for both dimensions of business performance is consistent with previous research indicating that nonfinancial per- formance is closely related to improved financial perfor- mance (Rust, Zahorik, and Kleiningham, 1995). The conceptual model also controls for marketing department characteristics, firm characteristics, and an
  • 12. environmental characteristic (market-related turbulence). Following Verhoef and Leeflang (2009), this study uses accountability and integration/cooperation between departments (in this case, marketing and R&D) as potential antecedents that explain the influence of marketing on NPD. Following Homburg et al. (1999), firm characteristics such as the marketing background of the chief executive officer (CEO) and the type of industry (business-to-consumer [B2C] versus business- to-business [B2B]) are also included as potential anteced- ents in the model. Furthermore, the study controls for the influence of a number of other variables that may affect innovation and business performance, including firm strategy, firm size, firm innovativeness, and past market development (Song and Thieme, 2006). Hypotheses Development and Expected Effects Marketing’s Knowledge-Based Capabilities MR. The task of the marketing function is to develop a thorough understanding of the market to ensure that the firm produces goods and services that the consumer requires and desires. Many firms perceive marketing research to be an important support for their NPD projects (Webster, 1992). In reality, however, marketing researchers work under tight deadlines and even tighter budgets, and they increasingly have trouble finding a sufficient number of qualified respondents (Arnold, 2005). As a result, many marketing departments know little or nothing about their customers (Schultz, 2003), and MR is perceived to be low, which causes a decline in the status of these departments within firms (Schultz, 2003).
  • 13. The academic marketing literature includes numerous studies on the use of market research (e.g., Deshpandé and Zaltman, 1982). These studies suggest that the per- ceived quality, actionability, and surprise factor of a given piece of marketing research are positively linked with its use. The increased use of high-quality marketing research could improve the influence of the marketing department because this department is usually in charge of collecting market data. This assumption leads to the following hypothesis: H1: MR is positively related to the influence of marketing on NPD. TS. Studies of source credibility and the theory of interpersonal trust (Giffin, 1967; Hovland, Janis, and Kelley, 1953; Moorman, Desphandé, and Zaltman, 1993) demonstrate that the perceived knowledge, expertise, and technical competence of marketers induce a more posi- tive attitude toward their ideas. For instance, the market- ing department’s TS are relevant for effectively working with important tools in NPD such as the House of Quality (Hauser and Clausing, 1988; Natter, Mild, Feurstein, Dorffner, and Taudes, 2001), in which customer require- ments are translated into technical product specifications. The greater the marketing department’s ability to link customer requirements to technical product specifica- tions, the more likely it is that a new product will be successfully marketed (Hauser, 1993). TS of the market- ing department may also contribute to the NPD success of firms, because technical innovations can be better trans- lated into customer benefits (e.g., via the positioning strategy). Consequently, this study also assumes that a marketing department’s TS, defined as its ability to trans- late customer needs into product characteristics, will
  • 14. increase its influence on NPD. In this vein, Leonard- Barton (1992) underlines that some of the most necessary elements of a core capability are excellent technical and professional skills and a knowledge base relevant to major products. On this basis, hypothesis H2 reads as follows: H2: The TS of the marketing department are positively related to the influence of marketing on NPD. MK. Marketing jobs have become more complex, forcing chief marketing officers (CMOs) to become general business managers (SpencerStuart, 2008). The most promising CMOs are therefore those who happen to be gifted marketers themselves and who are focused on continually developing their team, both internally and externally. This fact implies that apart from marketing information (which is captured in marketing research), general knowledge of marketing and management is also a crucial asset (Glazer, 1991; Srivastava, Shervani, and IMPROVING MARKETING’S CONTRIBUTION TO NPD J PROD INNOV MANAG 301 2013;30(2):298–315 Fahey, 1998). Within the academic marketing literature, although knowledge is now considered to be an important resource, there is a lack of attention to the influence of marketing knowledge within organizations. In addition to having marketing knowledge, a marketer should also have some knowledge of general management and busi- ness (e.g., Enright, 2005). If marketing departments are able to achieve growth via their marketing knowledge, then the marketing department may be perceived as a
  • 15. growth champion within the firm (Landry, Tipping, and Kumar, 2006). This assumption leads to the following hypothesis: H3: MK is positively related to the influence of marketing on NPD. Control Variables—Marketing Influence Marketing accountability. The importance of market- ing department accountability has been widely acknowl- edged (Lehmann, 2004; Rust, Ambler, Carpenter, Kumar, and Srivastava, 2004). Both Moorman and Rust (1999) and Verhoef and Leeflang (2009) show a positive rela- tionship between accountability and the overall influence of the marketing department within the firm, and O’Sullivan and Abela (2007) report that top management tends to be satisfied with the marketing department when the latter is accountable. Hence, this study expects that accountability also drives the influence of marketing on NPD. Integration with R&D. Generally, cross-functional cooperation is considered to be beneficial for firms (Srivastava et al., 1998). Because managing the interface between different departments such as marketing, R&D, finance, and operations is a critical element of successful NPD, this study accounts for possible interdepartmental conflicts related to the coordination of their activities. Interdepartmental conflicts create barriers to innovation due to departmental differences in time horizons, com- munication depth, and contact frequency (Roussel, Saad, and Erickson, 1991). Thus, this study assumes that any problems that arise between the marketing and R&D departments potentially reduce marketing’s influence on NPD.
  • 16. Firm characteristics. In their seminal work, Saxberg and Slocum (1968) find inherent personality differences between managers with marketing and R&D back- grounds due to differences in their education. Marketing professionals are trained in general problem solving and decision making to ensure profitable company perfor- mance. In contrast, R&D professionals, who often have a technical background, are more interested in testing and solving technical problems (Dougherty, 1992; Griffin and Hauser, 1996; Saxberg and Slocum, 1968). Accordingly, this study includes the CEO’s background as another antecedent in the model. Marketing is expected to play a more important role within firms that have a CEO with a marketing background (Homburg et al., 1999). For this purpose, this study includes two variables that reflect a CEO’s marketing or technical background. Following Verhoef and Leeflang (2009), this study also includes two industry characteristics (B2C versus B2B and services versus goods) as potential determinants of a marketing department’s influence. Market-related turbulence. Many different industries now face increasing market turbulence. In particular, shorter product life cycles, rising development costs, and more intense competition force companies to think about how to become more efficient and successful in their innovation activities (Carrilo and Franza, 2006; Ches- brough, 2007). Correspondingly, a firm needs a strong marketing department that can face these challenges and introduce high-quality market knowledge to help the company successfully innovate. However, in turbulent times, marketing budgets are often reduced or allocated to other departments (Deleersnyder, Dekimpe, Steen- kamp, and Leeflang, 2009; Nielsen 2009), thus reducing
  • 17. the influence of the marketing department on NPD. The Mediating Role of Marketing Influence on Innovation Performance Many firms, except for those that emphasize strongly the role of the marketing department in NPD, suffer from high new product failure rates (Kandybin and Kihn, 2004). This observation suggests that the marketing department is likely to have an impact on the outcomes of the NPD process not just by merely participating but also by its status within the firm, which determines the degree of influence it exercises on NPD (Atuahene-Gima and Evangelista, 2000). The marketing department’s influ- ence is reflected in its exercised power with respect to specific activities important to the success of the firm (Emerson, 1962; Homburg et al., 1999). This definition implies that the NPD-specific knowledge of the market- ing department can only contribute to the success of new products when the marketing department has the power to influence important decisions. Marketing has the oppor- tunity to achieve this status within the NPD process by 302 J PROD INNOV MANAG W. DRECHSLER ET AL. 2013;30(2):298–315 demonstrating that its underlying capabilities and skills are of high quality (Leonard-Barton, 1992). This improved status should in turn allow marketing to influ- ence performance outcomes (Wall, Stark, and Standifer, 2001). As such, the marketing department’s specific NPD capabilities are expected to influence a firm’s innovation performance indirectly through its influence on NPD. Thus, this discussion leads to the following hypothesis:
  • 18. H4: The relationship between marketing capabilities and innovation performance is mediated by marketing’s influence on NPD. Control Variables—Performance Outcomes To assess the impact of marketing departments’ DI on innovation performance, this study controls for several important constructs, including firm size (Laursen and Salter, 2006) and firm innovation orientation: i.e., general innovativeness (Han, Kim, and Srivastava, 1998). The study also includes the firm’s time frame for its strategic decisions because a short-term emphasis potentially impedes product/service innovations (Verhoef and Leeflang, 2009). Because only a small fraction of newly introduced products do not fail, the firm’s number of new products introduced during the past five years is also accounted for. Concerning firm strategy, Gemuenden and Heyde- breck (1995) demonstrate that cost leaders tend to be less innovative and hence less successful. However, other researchers demonstrate that both cost leaders and differ- entiators can achieve a high level of customer satisfaction and business performance (Olson, Slater, and Hult, 2005; Vorhies and Morgan, 2003; Yamin, Gunasekaran, and Mavondo, 1999). These findings suggest that it is impor- tant to account for a firm’s generic strategy (cost leader- ship versus differentiation) in explaining business performance. Finally, business performance is clearly related to developments in the firm’s core market over the last five years. Research Methodology
  • 19. Data Collection A total of 1850 questionnaires were sent out to finance, marketing, and R&D executives of German for-profit firms with more than 200 employees. Several methods were used to encourage responses. Respondents were offered either customized reports or two popular articles related to marketing and R&D. Nonrespondents were called after four weeks, and their cooperation was requested. In total, 279 questionnaires were returned, yielding a response rate of 15.1%. Sixteen respondents were excluded from the sample because they did not complete the entire survey, and 24 respondents were excluded because they stated that they were public rela- tions managers or executives who were not involved in the innovation activities of their firms. Hence, the analyses are based on 239 respondents. The key informants all belonged to top management teams: CEOs (9.6%), CMOs (63.8%), chief technology officers/R&D executives (8.3%), and chief financial officers (18.3%). In only two cases were there two respondents per firm. Following previous research, the present study did not average these replies but instead considered each respondent as a sepa- rate case (Van Bruggen, Lilien, and Kacker, 2002; Verhoef and Leeflang, 2009). Because the key informants worked intensively in the area under study, single informant bias should not affect the results (Kumar, Stern, and Anderson, 1993). This view is also supported by the high degree of perceptual agreement between the multiple informants at the above-mentioned two firms (correlation = .98). Sample Description Table 1 indicates that the average number of employees serving as full-time equivalents per firm is 3520. Further-
  • 20. more, the firms in the sample are active in a variety of industries, although most firms are active in the industrial sector (60%). The descriptive statistics in Appendix B show that the firms in the sample mainly operate in B2B markets with a 2.97 average score on a 10-point scale (1 = “turnover totally from B2B,” and 10 = “turnover totally from B2C”). The firms primarily focus on goods with an average score of 4.02 on a 10-point scale (1 = “turnover totally from goods,” and 10 = “turnover totally from ser- vices”). In 22% of cases, the CEO’s background is mar- keting. Most of the firms (72%) pursue a differentiation strategy. Compared with their competitors and relative to their own stated objectives, firms show above-average innovation (mean = 4.68) and business performance (mean = 4.93). These figures correspond to a moderate market increase over the last three years (mean = 6.24 ª 5%). Key Measures To measure the key variables, the study uses a range of established scales available in the extant literature on marketing strategy and market orientation. For example, IMPROVING MARKETING’S CONTRIBUTION TO NPD J PROD INNOV MANAG 303 2013;30(2):298–315 to operationalize the marketing department’s influence on NPD decisions, a scale is used that was originally devel- oped by Homburg et al. (1999). Each respondent was asked to distribute 100 points to reflect the degree of
  • 21. influence of four departments (marketing, sales, finance, and R&D) on NPD decision making. The points assigned to the marketing department are used to determine its influence on NPD. The second marketing influence measure (initiated NPD projects) is based on answers to the following question: “What is the percentage of new products or services introduced in the last five years that were initiated by the following departments? Please divide 100 points across the four departments: R&D, Marketing, Sales, Other.” The points assigned to the mar- keting department are used to indicate its influence. To assess the relative influence of the marketing and R&D departments, Table 2 reports the average percent- age scores for both influence measures. The DI score of the marketing department is 24%, whereas the influence score of the R&D department is 43%. This result is similar to the number of new products and services initi- ated by each department. Over the last five years, 28% of new products were initiated by the marketing department, whereas the R&D department initiated 37% of all new products. To measure innovation and business performance, Moorman and Rust’s (1999) subjective performance scale is used both for the firm itself and for the firm relative to its competitors. The present study uses this type of performance data because previous studies find a strong correlation between objective performance data and subjective assessments of performance by key infor- mants (Morgan, Kaleka, and Katsikeas, 2004; Olson et al., 2005). More detailed information about the mea- surement of each of the constructs, the items, the descrip- tive statistics, and the literature source (as well as the coefficient alphas and composite reliability) is provided in Appendices A and B.
  • 22. Validity and Reliability of Measures The coefficient alphas of most of the multi-item scales are greater than .80. The reliability and validity of the scales are further assessed by exploratory and confirmatory factor analysis (EFA and CFA). The EFA reveals suffi- ciently high loadings per item per construct, and the items belonging to each construct are classified as separate factors. CFA for the reflective multi-item scales in the model (see Appendix A) includes the marketing depart- ment capabilities (including accountability). This model demonstrates a good fit (goodness-of-fit index = .96; con- firmatory fit index = .99; root mean square error of approximation = .05), and all standardized factor load- ings are greater than .5 (p < .05). The composite reliabili- ties are all above .60 (Bagozzi and Yi, 1988; Steenkamp and van Trijp, 1991). It is also tested whether early respondents and late respondents significantly differ in their response behav- ior. The results show no nonresponse bias when using Armstrong and Overton’s (1977) recommended test for comparing early respondents and late respondents. Finally, the existence of possible common method bias was tested in two ways. First, potential common method bias is assessed by using Harman’s single-factor test (Malhotra, Kim, and Patil, 2006; Podsakoff, MacKenzie, Lee, and Podskoff, 2003). In this single-factor test, all of Table 1. Sample Descriptives Industry In Which Sector Is Your Firm Mostly Active? Fraction in %
  • 23. Industrial sector (including FMCG) 60.00 Public services 2.90 Construction 4.60 Trade and retail 6.30 Catering services 1.30 Financial services 3.80 Transport, storage, and communications 6.30 Other business services 15.00 Firm Size in FTEs Number of Employees Fraction in % �500 35.80 501–1000 25.80 1001–1500 12.90 1501–2000 4.20 2001–2500 5.00 2501–3000 2.50 3001–3500 2.50 >3500 11.30 Mean (SD) 3520 (11,099) n = 239. FMCG, fast-moving consumer goods; FTE, full-time equivalents; SD, stan- dard deviation. Table 2. Influence on New Product Development (NPD): Average Percentage Scores of the Marketing and Research and Development (R&D) Department Marketing R&D Othersa Decision influence on NPD 24 43 34 Initiated NPD projects 28 37 35
  • 24. a Including sales and finance. 304 J PROD INNOV MANAG W. DRECHSLER ET AL. 2013;30(2):298–315 the items in the study are subject to EFA. Common method bias is assumed to exist if (1) a single factor emerges from unrotated factor solutions or (2) a first factor explains the majority of the variance in the vari- ables. The results of the EFA of all included items reveal that the relevant factors explain 73.4% of the variance. If one general factor were derived, then it would explain only 17.2% of the variance. Next, Lindell and Whitney’s (2001) marker variable technique is used. In particular, the survey included a question that was not related to the topic (degree of confidence in the economy) and corre- lated this question with the derived constructs. The results show no significant correlation between the answers to this question and the important constructs and questions in the model. Together, these two tests indicate no evi- dence of common method bias. Model Specification Based on the conceptual model in Figure 1, the following econometric model is used to test the hypotheses: MI MC MD FC MT k k k m m m
  • 25. k d d d k f f f = + + + + + = + = + = ∑ ∑ ∑ α α α α α , , , , 0 1 3
  • 26. 3 1 2 5 1 4 10 εεk MIk k, ,=( )1 2 (1) IP MI MC Zk k k m m m c c c IP= + + + + = + = + = ∑ ∑ ∑β β β β ε0 1 2
  • 27. 2 1 3 5 1 4 (2) BP IP GS MGk k k BP= + + + ++ = ∑γ γ γ γ ε0 1 1 1 2 4 (3) Equation (1) is used to analyze the antecedents of the marketing department’s influence on NPD. In this equa- tion, MIk represents the two variables measuring the mar- keting department’s influence on NPD. MCm is the three knowledge-based marketing capabilities, MDd is the two general marketing department characteristics (account- ability and integration/cooperation), and FCf is the four general firm characteristics. MT captures the degree of market turbulence in a firm’s core market. The distur- bance terms of equation (1) are represented by ek,MIk. In
  • 28. equations (2) and (3), IP and BP represent a firm’s inno- vation and business performance respectively. Zc repre- sents the three control variables (e.g., firm size), GS represents the two variables for a firm’s generic strategy (cost leadership versus differentiation), and MG accounts for past growth in the firm’s core market. eIP and eBP are the disturbance terms of equations (2) and (3). To account for contemporaneous correlations between the error terms, the model is estimated using seemingly unrelated regression (SUR). To justify the use of SUR, the study conducted two tests. First, it employed the Breusch–Pagan test to detect contemporaneous correla- tions between the error terms. The resulting test statistic for the system of equations was highly significant (p = .000), indicating that contemporaneous correlation exists and that it is appropriate to use SUR. Second, it tested the performance of SUR as compared with ordi- nary least squares (OLS). In particular, the model was estimated as separate equations using OLS. The estima- tion results based on OLS feature higher standard errors for the coefficients, which emphasizes the usefulness of estimating the system of equations via SUR. It is also tested whether multicollinearity might possi- bly affect the estimation results. The majority of the cor- relation coefficients are less than .4 (see the correlation matrix in Appendix B), and the variance inflation factor scores are all below two, which indicates that no severe multicollinearity problems exist (Hair, Anderson, Tatham, and Black, 1998). Model Results To test whether the proposed marketing capabilities lead
  • 29. to a higher influence of the marketing department on NPD and whether their effects on innovation perfor- mance are mediated by marketing’s influence, the study applies a modeling procedure as follows. First, the study assesses the relationship between the three marketing capabilities and the two marketing influence measures (MI1 and MI2). This relation is represented by equation (1). The results are presented in the next subsection. Next, the study assesses the mediating effects by computing the indirect effects of the marketing capabilities on innova- tion performance (Baron and Kenny, 1986; Zhao, Lynch, and Chen, 2010). The Impact of Marketing Capabilities on the Marketing Department’s Influence on NPD The estimation results in Table 3 clearly show that the quality of marketing research and the capability to trans- late customer needs into technical product specifications positively contribute to both marketing influence mea- sures (p � .05). These results provide strong support to H1 and H2. The contribution measure of explained vari- ance (EV) suggests that MR and the TS of the marketing IMPROVING MARKETING’S CONTRIBUTION TO NPD J PROD INNOV MANAG 305 2013;30(2):298–315 department have a particularly great impact (sum of EV = 32.5%) on marketing’s DI on NPD (MI1). Further- more, these capabilities enable the marketing department to influence NPD by initiating NPD projects (MI2) within the firm (sum of EV = 36.8%). With an EV score ranging from 17.0% to 19.9%, MR emerges as the main underly-
  • 30. ing capability that helps marketing departments achieve high status within NPD. MK does not seem to drive the influence of marketing, and this may be because every department within a firm must have a certain degree of knowledge about general management and business. Thus, such knowledge does not function as a distinguish- ing capability. Accountability does not have a significant impact on the variables that measure the marketing department’s influence on NPD. The underlying reason might be that the ability to link marketing strategies and actions to financial performance is more relevant for existing prod- ucts (e.g., due to the availability of past data and experi- ence). Finally, it is surprising that the degree of cooperation between the marketing and R&D depart- ments does not have a significant impact on the marketing department’s influence on NPD. This finding might be the result of the strong differences in the influence (status), which could result in a lack of communication between both departments. A low average value of 2.89 in this variable (see Appendix B) confirms this view. The results indicate that having CEOs with marketing backgrounds (p < .10) positively affects the influence of marketing on NPD decision making. The CEO’s back- ground has no effect on the number of new products initiated by marketing. Furthermore, the influence of the marketing department is greater in B2C firms than in B2B firms (p < .05). Together, these results confirm the find- ings of previous studies. For instance, Homburg et al. (1999) show that the marketing background of a CEO and the type of industry (B2C) are indeed positively related to the influence of marketing within the firm. As expected, the results also show a marginal negative effect of market turbulence on marketing’s degree of influence on deci-
  • 31. sion making (p < .10). This negative effect seems to confirm that in turbulent times, marketing budgets are among the first to be cut, thus reducing marketing’s influence. The literature suggests that gathering market informa- tion can be critical, depending on the industry, because of frequent changes in customer expectations and shifts in technology (Harmancioglu, Grinstein, and Goldman, 2010). Therefore, the robustness of the results is evalu- ated by estimating additional moderated regression models to test the interaction between marketing capa- bilities (marketing research and TS), firm focus (B2C), industry (services versus goods), and market-related tur- bulence. The results show no significant interactions; Table 3. Estimation Results: The Impact of Marketing Capabilities on the Marketing Department’s Influence (MIk) on New Product Development (NPD) (Equation [1]) MI1 MI2 Decision Influence on NPD Initiated NPD Projects Coefficient Standard Error EV (%) Coefficient Standard Error EV (%) Constant -13.13 8.718 2.32 7.785 Knowledge-based marketing capabilities Marketing research quality (MR) 3.10*** 1.096 17.0 2.25** .979 19.9 Technical skills (TS) 2.61*** 1.008 15.5 1.75** .900 16.9 Knowledge (MK) (marketing and general management) 1.20 1.224 5.9 .18 1.093 1.4 Controls
  • 32. Marketing department characteristics Accountability 1.60 1.071 9.0 1.17 .957 10.6 Marketing–R&D cooperation 1.03 .866 7.1 .51 .774 5.7 Firm characteristics CEO—technical background -2.90 2.729 6.4 -1.48 2.437 5.3 CEO—marketing background 5.08* 2.925 10.4 3.23 2.612 10.7 B2C .96** .426 13.5 .96** .380 21.9 Services versus goods .33 .406 4.9 -.07 .363 1.6 Market-related turbulence -2.37* 1.378 10.3 -.86 1.231 6.1 R2 (adjusted R2) .25 (.21) .16 (.12) * p � .10; ** p � .05; *** p � .01. B2C, business-to-consumer; CEO, chief executive officer, EV, contribution to explained variance; R&D, research and development. 306 J PROD INNOV MANAG W. DRECHSLER ET AL. 2013;30(2):298–315 however, the main effects remain the same, which dem- onstrates that MR and TS are the most important market- ing capabilities in the context of NPD. In summary, the estimation results demonstrate that it is important for a marketing department to possess and develop specific knowledge that is highly relevant to the development of new products. In particular, the quality of marketing research activities and the department’s ability to connect customer needs to products help it to play an important role in a firm’s NPD projects.
  • 33. Marketing Capabilities and Innovation Performance The results of this analysis are presented in Table 4. To get a more differentiated picture of the effects, the study first directly relates the three marketing capabilities to innovation performance (Model 1). Second, it relates the two marketing influence measures (MI1 and MI2) to inno- vation performance in the absence of the three marketing capabilities measures (Model 2). Third, it establishes the relationships between the three marketing capabilities and innovation performance (Model 3 = equation [2]) while accounting for the marketing influence measures. In Model 1, the most important marketing capability is MR (EV = 19.6%), which has a significant positive effect on innovation performance (p < .05). The results in Model 2 reveal that the DI of marketing (MI1) has a strong positive significant effect (p < .01) on innovation performance. In Model 3, both the level of DI that mar- keting departments enjoy (p < .01) and MR (p < .05) have a significant effect on innovation performance. The results in Table 4, however, indicate that there is no direct effect of marketing’s TS on innovation perfor- mance before (Model 1) or after controlling for its influ- ence (Model 3). Together, marketing capabilities and influence explain a considerable amount of the variance in Model 3 (sum of EVs = 42.6%), where marketing DI (EV = 14.8%) and research quality (EV = 11.8%) are the major driving factors. These figures highlight the impor- tance of marketing DI (MI1) and capabilities in driving innovation performance. However, no significant effects result from the second marketing influence measure (MI2) on innovation performance.
  • 34. The Mediating Role of Marketing’s DI Given the significant impact of marketing’s DI (MI1) on innovation performance, this section tests whether this influence also mediates the impact of marketing’s spe- cific capabilities on innovation performance (H4). Recent research demonstrates that one just has to assess the significance of the indirect effect of an inde- pendent variable on an outcome variable, i.e., the effect that an independent variable exhibits via an intervening (mediating) variable, in order to determine the kind of Table 4. Estimation Results: Innovation Performance—The Mediating Role of Marketing’s Influence (Equation [2]) Model 1 (with Marketing Capabilities) Model 2 (with Marketing Influence) Model 3 = Equation (2) (Full Model) Coefficient Standard Error EV (%) Coefficient Standard Error
  • 35. EV (%) Coefficient Standard Error EV (%) Constant 3.29*** .500 3.14*** .481 2.98*** .539 Knowledge-based marketing capabilities Marketing research quality (MR) .12** .053 19.6 — — — .13** .059 11.8 Technical skills (TS) -.04 .049 8.0 — — — -.07 .054 7.4 Knowledge (MK) (marketing and general management) .01 .056 2.1 — — — .03 .060 2.4 Marketing influence on NPD Decision influence on NPD (MI1) — — — .01*** .004 24.2 .01*** .004 14.8 Initiated NPD projects (MI2) — — — .00 .004 6.6 -.01 .004 6.3 Controls Innovativeness of the firm .06* .034 14.9 .04 .037 6.6 .04 .037 5.5 Number of new product introductions .21*** .052 35.8 .33*** .056 38.3 .33*** .056 31.4 Firm size -.01 .044 1.5 -.03 .047 4.0 -.06 .048 6.4 Short-term emphasis -.06** .027 18.1 -.09*** .030 20.2 -.08*** .030 14.1 R2 (adjusted R2) .18(.15) .20(.18) .22(.19)
  • 36. * p � .10; ** p � .05; *** p � .01. EV, contribution to explained variance; NPD, new product development; R&D, research and development. IMPROVING MARKETING’S CONTRIBUTION TO NPD J PROD INNOV MANAG 307 2013;30(2):298–315 mediation (Zhao et al., 2010).2 To fully understand the magnitude of marketing capabilities’ contribution to innovation performance and the role of the marketing department’s influence, the indirect effects are computed to assess the type of mediation. Following the product- of-coefficients method, the indirect effects (l) of MR and TS on innovation performance are computed by multi- plying their estimated coefficients in Table 3 with the corresponding coefficient of marketing’s DI on NPD in Table 4 (Model 3). Following Preacher and Hayes (2008), the present study assesses the significance of the indirect effects (l) by bootstrapped standard errors and bias-corrected 95% confidence intervals. The results show that MR (lMR = .031 [= 3.10*.01], p < .05) and marketing departments’ TS (lTS = .026 [= 2.61*.01], p < .05) also exhibit positive significant indirect effects on innovation performance through the DI of marketing. These results confirm that the effect of TS and MR on innovation performance is indeed mediated by the DI of marketing (MacKinnon, Warsi, and Dwyer, 1995; Shrout and Bolger, 2002). Following the typology proposed by Zhao et al. (2010), the mediating effect in case of MR is complementary mediation, i.e., the medi- ated effect (indirect effect) and direct effect both exist and point in the same direction. In the case of TS, the result is
  • 37. indirect-only mediation because TS do not show any sig- nificant direct effect on innovation performance. Hence, the performance impact of the marketing department’s TS is fully carried through marketing’s DI on NPD (i.e., the indirect effect equals the total effect) (Shrout and Bolger, 2002). In the case of MR, 19.3% of the total effect (.031/[.031 + .13]) on innovation performance is carried through marketing’s DI on NPD quality.3 In general, the above-described mediation analysis highlights that marketing research and the marketing department’s TS unfold performance contribution through the department’s DI on NPD. As such, it is nec- essary for a firm not only to develop these capabilities but also to ensure that the marketing department has the power to translate this knowledge into performance- driving activities and decisions within the NPD process. Innovation Performance and Business Performance Models 2 and 3 in Table 5 confirm that innovation per- formance significantly improves overall business perfor- mance (p < .01). Past market development strongly affects firm business performance (p < .01), whereas a firm’s generic strategy shows no significant differentiat- ing effect. The latter result supports findings from previ- ous research, showing that the fit between the generic strategy and its implementation is more important than the chosen strategy (Olson et al., 2005). Additional Analyses Prior research indicates that marketing potentially directly contributes to a firm’s business performance
  • 38. 2 Unlike Baron and Kenny’s (1986) proposition, there is no need for a significant zero-order direct effect in the case of mediation. Further, it is not necessary to compare the size of the coefficients across the different equa- tions in order to detect mediating effects (Zhao et al., 2010). 3 Baron and Kenny (1986) would call this result partial mediation. Table 5. Estimation Results: Business Performance (Equation [3]) Model 1 (with Marketing Influence) Model 2 = Equation (3) (with Innovation Performance) Model 3 (Full Model) Coefficient Standard Error Coefficient Standard Error Coefficient Standard Error Constant 4.52*** .146 2.61*** .217 2.59*** .227 Innovation performance — — .45*** .040 .44*** .040 Marketing influence on NPD Decision influence on NPD (MI1) .01*** .003 — — .00 .003 Initiated NPD projects (MI2) .00 .003 — — .00 .003
  • 39. Controls Generic strategy Cost leadership .05 .171 .11 .157 .10 .157 Differentiation .01 .123 .02 .112 .01 .113 Past market development .09*** .026 .07*** .024 .08*** .024 R2 (adjusted R2) .06(.04) 32(.31) .32(.31) * p � .10; ** p � .05; *** p � .01. NPD, new product development. 308 J PROD INNOV MANAG W. DRECHSLER ET AL. 2013;30(2):298–315 through its distinct knowledge-based capabilities (Kras- nikov and Jayachandran, 2008). Therefore, it is also tested whether there are direct effects of the marketing department’s influence on business performance and whether these effects are mediated by innovation perfor- mance. Model 3 shows that the effect of marketing DI on business performance is mediated by innovation perfor- mance with an indirect effect of lDI = .005 (p < .01). Computing the indirect effects of MR (lMR = .014, p < .05) and TS (lTS = .012, p < .05) reveals that these two marketing capabilities also indirectly affect overall business performance through marketing DI and innova- tion performance. Robustness Checks One might argue that perceptions of influence may depend on the background of the respondent (Atuahene-
  • 40. Gima and Evangelista, 2000). This problem would imply that the results potentially suffer from respondent back- ground bias, which in turn would imply that pooling responses from respondents with different functional backgrounds are not allowed. To test whether this problem affects the estimation results, several robustness checks were conducted. First, equations (1) and (2) were reestimated by including interaction terms among the respondent back- ground (marketing versus others), the marketing capabili- ties, and the two influence measures. The results did not show any significant interaction in these models, which gives a first indication that the respondent background bias does not affect the results. Second, a Chow test was applied to test whether respondents’ background affects overall model results. This means that the hypothesis of parameter homogeneity between the two groups of respondents was tested (Chow, 1960; Leeflang, Dick, Wittink, Michel, and Philippe, 2000). The null hypothesis of homogeneity was not rejected, which underlines that pooling the observations from respondents with different functional backgrounds is statistically justified. A third test of respondent bias involves the comparison of two random samples. In particular, Equations (1) to (3) were reestimated based on two equally sized random samples. The results remained stable, which again emphasizes the robustness of the results. Discussion and Managerial Implications The prevailing view in most companies is that marketing is not a distinct function, and therefore, everyone can do marketing. As a result, the status of the marketing depart- ment is in a steep decline, which is especially observable
  • 41. within the NPD process. This development is surprising because it seems that top innovators strongly involve the marketing department in the NPD process. Hence, strengthening the marketing department’s position with respect to NPD should be a priority to improve innovation performance. This problem leads to the following questions: (1) How can the marketing department strengthen its position in the NPD process and drive innovation perfor- mance? (2) What role does the marketing department’s position play in influencing innovation outcomes and firm performance? With this idea in mind, the aim of this study was to identify relevant marketing capabilities that positively contribute to firm innovation performance and help strengthen the marketing department’s influence on NPD. To ensure generalizable results, the analyses are based on a substantial sample of 239 respondents in B2B and B2C firms operating in a variety of industries (goods and services). The empirical results summarized in Figure 2 clearly show that marketing as a distinct function is important for driving innovation success. In particular, this study shows that in contrast to the commonly held view, not everyone in a firm can do marketing, and therefore, the marketing department should have a higher status in NPD. This recommendation is based on the following facts. First, if the marketing department demonstrates that its MR and its ability to translate consumer needs into tech- nical specifications (TS) is high, it can achieve a higher status within NPD. Hence, this result answers the ques- tion regarding how the marketing department can achieve a higher influence in the NPD process and drive innova- tion performance. Second, the results of the mediation
  • 42. analysis depicted in Figure 2 show that these distinct marketing capabilities coupled with an influential status of the marketing department in NPD together drive inno- vation performance. In the case of MR, the results show a positive direct and indirect effect through marketing’s influence on innovation performance. In addition, mar- keting’s TS exhibit an indirect influence on innovation performance. In particular, nearly 20% of the total effect of the MR on innovation performance is mediated by (carried through) marketing’s influence and its relation to innovation performance. In the case of TS, this effect is much stronger. Because TS show only an indirect effect on innovation performance, their performance contribu- tion can be fully attributed to marketing’s influence. This latter finding demonstrates that without having the status to influence NPD decisions, marketing’s ability to trans- late customer needs into technical product specification IMPROVING MARKETING’S CONTRIBUTION TO NPD J PROD INNOV MANAG 309 2013;30(2):298–315 does not have any performance implications. Accord- ingly, this result, together with the fact that the marketing department still plays a minor role in many firms, seems to confirm the widespread belief that reductions in the customer–product connection have led to a rise of new product failure rates. The previously discussed results have the following managerial implications. First, because marketing research skills and the ability to translate customer needs into technical product specifications are concentrated within the marketing department, firms should value mar-
  • 43. keting as a distinct function especially in the development of new products. Second, to show that marketing has its right to exist as a distinct function within the firm, mar- keters involved in NPD projects should not only have a strong knowledge of the market but also have a good understanding of a firm’s product portfolio and those products’ characteristics. Because NPD-specific market- ing capabilities appear to have an indirect influence on firm-level innovation performance, firms should enrich their marketing teams with marketers who have special- ized backgrounds including a deep knowledge of market- ing research methods. Third, the marketing department should use methods and tools that help to achieve a good understanding of the markets and customer needs so that these needs can be translated into technical product speci- fications. In particular, the marketing department should find ways to regularly interact with consumers in order to get a better understanding of their needs. Particularly, the Internet provides new forms of support for NPD. For instance, an attractive tool for sourcing, filtering, and evaluating new product ideas is the use of idea markets, which utilize widely distributed knowledge, market power, and the Internet to support the crucial initial tasks of the NPD process (Soukhoroukova, Spann, and Skiera, 2012). Applying such tools encourages the innovation Decision influence (MI1) Marketing Capability Marketing Influence (MIk) Hypothesis (expected effect) Result H1(+) Initiated NPD projects (MI2)
  • 44. Decision influence (MI1) H2 (+) Initiated NPD projects (MI2) Decision influence (MI1) H3 (+) n.s. n.s.Initiated NPD projects (MI2) Marketing research quality (MR) Technical skills (TS) Knowledge (MK) (marketing and general management) Marketing Capabilities and Innovation Performance (IP): The Mediating Role of Marketing’s Decision Influence (MI1) The Impact of Marketing Capabilities on the Marketing Department’s Influence on NPD MI1 MR IP (+) (+) (+)
  • 45. MI1 TS IP (+) (+) (n.s.) Result: Complementary mediation (19% of the total effect) Result: Indirect-only mediation (full mediation) Marketing research quality (MR) Technical skills (TS) H4 Figure 2. Overview of Main Results NPD, new product development; n.s., not significant 310 J PROD INNOV MANAG W. DRECHSLER ET AL. 2013;30(2):298–315 process to shift from being mainly internally driven to integrating external know-how and ideas (Laursen and Salter, 2006). Notably, the overview of results in Figure 2 also indi- cates that general knowledge about marketing and man-
  • 46. agement does not help marketing departments to increase their status in the context of NPD. This result may be because currently, general knowledge in marketing and management is seen as nothing special; for instance, engineers must attend courses on the principles of mar- keting and general management. From an educational perspective, the results presented above indicate that uni- versities should provide marketing students with more than a broad base of knowledge in marketing from diverse areas. More importantly, marketing students should be given highly specialized tool sets such as con- joint analysis and latent class segmentation for perform- ing high-quality marketing research along with better technical training (e.g., education regarding the use tools such as the House of Quality) so that they will be able to more effectively translate customer requirements into new product specifications. Additional analyses show that MR, TS, and the DI of the marketing department also indirectly contribute to overall business performance. This result demonstrates that top management officials should strengthen the marketing department’s position within the firm and especially within NPD. Limitations and Further Research The first limitation of this study is that it does not distin- guish between different stages in the NPD process. The impact of the marketing department is different during each stage of the NPD process. For example, the influ- ence of marketing may be greater during earlier stages such as idea generation, idea screening, and concept development, and perhaps also during later stages such as testing and commercialization. A second limitation is that this study only accounts for problems concerning the coordination between marketing and R&D on an aggre- gate level. However, the degree of conflict between the
  • 47. marketing and R&D departments may also differ accord- ing to the particular stage in the NPD process and, con- sequently, across firms. The third limitation is that this study uses self-reported performance outcomes to assess the impact of the marketing department within a firm. Even though prior studies have found a strong correlation between objective performance data and subjective assessments of performance by key informants (Morgan et al., 2004; Olson et al., 2005), this limitation can poten- tially lead to biased estimates of the relationship between the marketing department’s influence and a firm’s perfor- mance outcomes (Cano, Carrillat, and Jaramillo, 2004). These limitations provide avenues for future research. For instance, it would be interesting to investigate and identify more specific capabilities that are relevant during the different stages of the NPD process. Based on these results, it would also be worthwhile to investigate what type of information supplied by marketing research teams is particularly important to managers involved in NPD. Future research could identify “ideal” combinations of marketing and R&D departments for different firms and industries (cf. Homburg, Jensen, and Krohmer, 2008). In exploring relevant R&D capabilities, one might begin to identify combinations of marketing and R&D that maxi- mize innovation performance. These combinations would allow for a more detailed assessment of marketing’s influence on NPD and its performance outcomes. From the managerial point of view, such ideal combinations of marketing and R&D would help managers to increase their understanding of the specificities of marketing and R&D configurations at the firm level and thus develop alternative solutions. References
  • 48. Armstrong, J. S., and T. S. Overton. 1977. Estimating non- response bias in mail surveys. Journal of Marketing Research 14 (3): 396–402. Arnold, C. 2005. Self-examination. Marketing News 39 (2): 55– 56. Atuahene-Gima, K., and F. Evangelista. 2000. Cross-functional influence in new product development: An exploratory study of marketing and R&D perspectives. Management Science 46 (10): 1269–84. Bagozzi, R. P., and Y. Yi. 1988. On the evaluation of structural equation models. Journal of the Academy of Marketing Science 16 (1): 74–94. Baker, M. J., C. D. Black, and S. Hart. 1988. The competitiveness of British industry: What really makes the difference? European Journal of Mar- keting 22 (2): 70–85. Baron, R. M., and D. A. Kenny. 1986. The moderator–mediator variable distinction in social psychological research: Conceptual, strategic, and statistical considerations. Journal of Personality and Social Psychol- ogy 51 (6): 1173–82. Calantone, R. J., and C. A. di Benedetto. 1988. An integrative model of the new product development process—An empirical validation.
  • 49. Journal of Product Innovation Management 5 (3): 201–15. Cano, C. R., F. A. Carrillat, and F. Jaramillo. 2004. A meta- analysis of the relationship between market orientation and business performance: Evidence from five continents. International Journal of Research in Marketing 21 (2): 179–200. Carrilo, J. E., and R. M. Franza. 2006. Investing in product development and production capabilities: The crucial linkage between time- to- market and ramp-up time. European Journal of Operational Research 171 (2): 536–56. Chesbrough, H. W. 2007. Why companies should have open business models. MIT Sloan Management Review 48 (2): 21–28. Chow, G. C. 1960. Tests for equality between sets of coefficients in two linear regressions. Econometrica 28: 591–605. Cooper, R. G., and E. J. Kleinschmidt. 1995. Benchmarking the firm’s critical success factors in new product development. Journal of Product Innovation Management 12: 374–91. IMPROVING MARKETING’S CONTRIBUTION TO NPD J PROD INNOV MANAG 311 2013;30(2):298–315
  • 50. Covin, J. J., and D. P. Slevin. 1989. Strategic management of small firms in hostile and benign environments. Strategic Management Journal 10 (1): 75–87. Day, G. S. 1994. The capabilities of market-driven organizations. Journal of Marketing 58 (4): 37–52. Deleersnyder, B., M. G. Dekimpe, J.-B. E. M. Steenkamp, and P. S. H. Leeflang. 2009. The role of national culture in advertising’s sensitivity to business cycles: An investigation across continents. Journal of Mar- keting Research 46 (5): 623–36. Deshpandé, R., and G. Zaltman. 1982. Factors affecting the use of market research information: A path analysis. Journal of Marketing Research 19 (1): 14–31. Dougherty, D. 1992. Interpretive barriers to successful product innovation in large firms. Organization Science 3 (2): 179–202. Emerson, R. M. 1962. Power–dependence relations. American Sociological Review 27 (1): 31–41. Enright, A. 2005. Future finder. Marketing News 39 (16): 14–
  • 51. 16. Ernst, H., W. D. Hoyer, and C. Rübsaamen. 2010. Sales, marketing, and research-and-development cooperation across new product develop- ment stages: Implications for success. Journal of Marketing 74 (3): 80–92. Fine, L. M. 2009. The bottom line: Marketing and firm performance. Business Horizons 52: 209–14. Gemuenden, H. G., and P. Heydebreck. 1995. The influence of business strategies on technological network activities. Research Policy 24 (6): 831–49. Giffin, K. 1967. The contribution of studies of source credibility to a theory of interpersonal trust in the communication process. Psychological Bulletin 68 (2): 104–20. Glazer, R. 1991. Marketing in an information-intensive environment: Stra- tegic implications of knowledge as an asset. Journal of Marketing 55 (4): 1–19. Grant, R. M. 1996. Toward a knowledge-based theory of the firm. Strategic Management Journal 17: 109–22.
  • 52. Griffin, A., and J. R. Hauser. 1996. Integrating R&D and marketing: A review and analysis of literature. Journal of Product Innovation Man- agement 13 (3): 191–215. Hair, J. F., R. E. Anderson, R. L. Tatham, and W. C. Black. 1998. Multi- variate data analysis. Upper Saddle River, NJ: Prentice Hall. Han, J. K., N. Kim, and R. K. Srivastava. 1998. Market orientation and organizational performance: Is innovation a missing link? Journal of Marketing 62 (4): 30–45. Harmancioglu, N., A. Grinstein, and A. Goldman. 2010. Innovation and performance outcomes of market information collection efforts: The role of top management team involvement. International Journal of Research in Marketing 27 (1): 33–43. Hauser, J. R. 1993. How Puritan-Bennett used the house of quality. Sloan Management Review 34 (3): 61–70. Hauser, J. R., and D. Clausing. 1988. The house of quality. Harvard Business Review (May–June): 63–73. Homburg, C., J. P. Workman, and H. Krohmer. 1999. Marketing’s influence within the firm. Journal of Marketing 63 (2): 1–17.
  • 53. Homburg, C., O. Jensen, and H. Krohmer. 2008. Configurations of market- ing and sales: A taxonomy. Journal of Marketing 72 (2): 133– 54. Hovland, C. I., I. L. Janis, and H. H. Kelley. 1953. Communication and persuasion. New Haven, CT: Yale University Press. Johnson, G. J., and P. J. Ambrose. 2009. Welcome to the bazaar. Marketing Research 20 (4): 18–24. Kandybin, A., and M. Kihn. 2004. Raising your return on innovation investment. Strategy & Business 35: 38–49. Krasnikov, A., and S. Jayachandran. 2008. The relative impact of market- ing, research-and-development, and operations capabilities on firm per- formance. Journal of Marketing 72 (4): 1–11. Kumar, N., L. W. Stern, and J. C. Anderson. 1993. Conducting interorga- nizational research using key informants. Academy of Management Journal 36 (6): 1633–51. Landry, E., A. Tipping, and J. Kumar. 2006. Growth champions: What distinguishes a truly great marketeer? In an era of unlimited opportu- nities but constrained resources, the only metric that matters is growth. Strategy & Business 43: 60–69.
  • 54. Laursen, K., and A. Salter. 2006. Open for innovation: The role of openness in explaining innovation performance among U.K. manufacturing firms. Strategic Management Journal 27 (2): 131–50. Leeflang, P., S. H. Dick, R. Wittink, W. Michel, and A. N. Philippe. 2000. Building models for marketing decisions. Boston, MA: Kluwer. Lehmann, D. R. 2004. Metrics for making marketing matter. Journal of Marketing 68 (4): 73–75. Leonard-Barton, D. 1992. Core capabilities and core rigidities: A paradox in managing new product development. Strategic Management Journal 13 (S1): 111–25. Lindell, M. K., and D. J. Whitney. 2001. Accounting for common method variance in cross-sectional research designs. Journal of Applied Psy- chology 86 (1): 114–21. MacKinnon, D. P., G. Warsi, and J. H. Dwyer. 1995. A simulation study of mediated effect measures. Multivariate Behavioral Research 30 (1): 41–62. Malhotra, N. K., S. S. Kim, and A. Patil. 2006. Common method variance in IS research: A comparison of alternative approaches and a
  • 55. reanalysis of past research. Management Science 52 (12): 1865–83. Maltz, E., and A. K. Kohli. 1996. Market intelligence dissemination across functional boundaries. Journal of Marketing Research 33 (1): 47–61. McKenna, R. 1991. Marketing is everything. Harvard Business Review Jan–Feb: 65–70. Menon, A., S. G. Bharadwaj, P. T. Adidam, and S. W. Edison. 1999. Antecedents and consequences of marketing strategy making: A model and a test. Journal of Marketing 63 (2): 18–40. Moorman, C., R. Desphandé, and G. Zaltman. 1993. Factors affecting trust in market research relationships. Journal of Marketing 57 (1): 81–101. Moorman, C. and R. T. Rust 1999. The role of marketing. Journal of Marketing 63: 180–97. Morgan, N., A. Kaleka, and C. S. Katsikeas. 2004. Antecedents of export venture performance: A theoretical model and empirical assessment. Journal of Marketing 68 (1): 90–108. Natter, M., A. Mild, M. Feurstein, G. Dorffner, and A. Taudes. 2001. The effect of incentive schemes and organizational arrangements on
  • 56. the new product development process. Management Science 47 (8): 1029–45. Nielsen. 2009. U.S. ad spending fell 15.4% in the first half. Available at: http://www.nielsen.com/us/en/insights/press-room/2009/us_ad_ spending_fell.html. Accessed October 20, 2012. O’Sullivan, D., and A. V. Abela. 2007. Marketing performance measure- ment ability and firm performance. Journal of Marketing 71 (2): 79–83. Olson, E. M., S. F. Slater, and G. T. M. Hult. 2005. The performance implications of fit among business strategy, marketing organization structure, and strategic behavior. Journal of Marketing 59 (3): 49–65. Podsakoff, P. M., S. B. MacKenzie, J. Y. Lee, and N. P. Podskoff. 2003. Common method biases in behavior research: A critical review of the literature and recommended remedies. Journal Applied Psychology 88 (5): 879–903. Porter, M. E. 1980. Competitive strategy. New York: The Free Press. Preacher, K. J., and A. F. Hayes. 2008. Asymptotic and resampling strate- gies for assessing and comparing indirect effects in multiple mediator
  • 57. models. Behavioral Research Methods 40: 879–91. Rein, G. L. 2004. From experience: Creating synergy between marketing and research and development. Journal of Product Innovation Manage- ment 21 (1): 33–43. Roussel, P. A., K. N. Saad, and T. J. Erickson. 1991. Third generation R&D. Boston, MA: Harvard Business School Press. 312 J PROD INNOV MANAG W. DRECHSLER ET AL. 2013;30(2):298–315 Rust, R. T., A. J. Zahorik, and T. L. Kleiningham. 1995. Return on quality: Making service quality financially accountable. Journal of Marketing 59 (2): 58–70. Rust, R. T., T. Ambler, G. S. Carpenter, V. Kumar, and R. K. Srivastava. 2004. Measuring marketing productivity: Current knowledge and future direction. Journal of Marketing 69 (4): 76–89. Sachdev, A. 2001. Chicago market research firm’s study says most new products fail. Chicago Tribune. May 1. Saxberg, B. O., and J. W. Slocum Jr. 1968. The management of scientific manpower. Management Science 14 (8): B473–B89.
  • 58. Schultz, D. E. 2003. Marketing gets no respect in the boardroom. Market- ing News 37 (24): 9. Sheth, J. N., and R. S. Sisodia. 2005. Does marketing need reform? In marketing renaissance: Opportunities and imperatives for improving marketing thought, practice, and infrastructure. Journal of Marketing 69: 1–25. Shrout, P. E., and N. Bolger. 2002. Mediation in experimental and nonex- perimental studies: New procedures and recommendations. Psycho- logical Methods 7 (4): 422–45. Song, M., and R. J. Thieme. 2006. A cross-national investigation of the R&D–Marketing interface in the product innovation process. Industrial Marketing Management 35 (3): 308–22. Soukhoroukova, A., M. Spann, and B. Skiera. 2012. Generating and evalu- ating new product ideas with idea markets. Journal of Product Inno- vation Management 29 (1): 100–12. Spencer Stuart. 2008. Beyond sales support: The increasingly strategic role of the industrial CMO. Available at http://content.spencerstuart. com/sswebsite/pdf/lib/CMOind08.pdf. Accessed March 3, 2010.
  • 59. Srivastava, R. K., T. A. Shervani, and L. Fahey. 1998. Market- based assets and shareholder value: A framework for analysis. Journal of Marketing 62 (1): 2–18. Srivastava, R. K., T. A. Shervani, and L. Fahey. 1999. Marketing, business process and shareholder value: An organizational embedded view of marketing activities and discipline of marketing. Journal of Marketing 60 (4): 168–79. Steenkamp, J.-B. E. M., and H. C. M. van Trijp. 1991. The use of LISREL in validating marketing constructs. International Journal of Research in Marketing 8 (4): 283–99. Sudhir, K., and V. R. Rao. 2006. Do slotting allowances enhance efficiency or hinder competition? Journal of Marketing Research 43 (2): 137–55. Teece, D. J., G. P. Pisano, and A. Shuen. 1997. Dynamic capabilities and strategic management. Strategic Management Journal 18 (7): 509–33. Van Bruggen, G. H., G. L. Lilien, and M. Kacker. 2002. Informants in organizational marketing research: Why use multiple informants and how to aggregate responses. Journal of Marketing Research 39 (4):
  • 60. 469–78. Verhoef, P. C., and P. S. H. Leeflang. 2009. Understanding the marketing department’s influence within the firm. Journal of Marketing 73 (2): 14–37. Verhoef, P. C., P. S. H. Leeflang, J. Reiner, M. Natter, W. Baker, A. Grinstein, A. Gustafsson, P. Morrison, and J. Saunders. 2011. A cross- national investigation into the marketing department’s influence within the firm: Towards initial empirical generalizations. Journal of Interna- tional Marketing 19 (3): 59–86. Vorhies, D. W., and N. A. Morgan. 2003. A configuration theory assessment of marketing organization fit with business strategy and its relationship with marketing performance. Journal of Marketing 67 (1): 100– 15. Wall, J. A. Jr., J. B. Stark, and R. Standifer. 2001. Mediation— A current review and theory development. Journal of Conflict Resolution 45 (3): 370–91. Webster, F. E. 1992. The changing role of marketing in the corporation. Journal of Marketing 56 (4): 1–17. Webster, F. E. 2005. Back to the future: Integrating marketing
  • 61. as tactics, strategy, and organizational culture. In marketing renaissance: Oppor- tunities and imperatives for improving marketing thought, practice, and infrastructure. Journal of Marketing 69 (4): 1–25. Webster, F. E., A. J. Malter, and S. Ganesan. 2005. The decline and disper- sion of marketing competence. MIT Sloan Management Review 46 (4): 35–43. Workman, J. P. 1993. Marketing’s limited role in new product development in one computer systems firm. Journal of Marketing Research 30 (4): 405–21. Yamin, S., A. Gunasekaran, and F. T. Mavondo. 1999. Relationship between generic strategies, competitive advantage and organizational performance. Technovation 19 (8): 507–18. Zhao, X., J. G. Lynch Jr., and Q. Chen. 2010. Reconsidering Baron and Kenny: Myths and truths about mediation analysis. Journal of Con- sumer Research 37 (2): 197–206. Appendix A. Used Scales Construct/Variable (Inspired or Based on) Items
  • 62. Coefficient Alpha/Composite Reliability CEO functional background (Homburg et al., 1999) What is the primary background of the CEO within your firm? – Marketing, engineering, science, finance law, other (1/0) NA Decision influence of the marketing department on NPD (Homburg et al., 1999) Distribute 100 points over the following departments: Sales, Marketing, R&D, Finance: Departments with a high influence on NPD receive more points than departments with a low influence. NA Initiated NPD projects by the marketing department What is the percentage of introduced new products or services in the last five years that were initiated by the following department? Please divide 100 points across four departments: 1. R&D, 2. Marketing, 3. Sales, 4. Other.
  • 63. NA Lack of cooperation (Maltz and Kohli, 1996) (formative) To what extent have the marketing department and the R&D department experienced problems concerning coordination of activities in the past three years? (1 = no problems at all, 7 = very many problems) To what extent have the marketing department and the R&D department hindered each other’s performance in the past three years? (1 = not hindered at all, 7 = hindered a lot) .84/NA B2B versus B2C (Verhoef and Leeflang, 2009) Please indicate the percentage of your turnover that arise from B2B or B2C markets: B2B (1) . . . B2C (10) NA IMPROVING MARKETING’S CONTRIBUTION TO NPD J PROD INNOV MANAG 313 2013;30(2):298–315 Appendix A. Continued
  • 64. Construct/Variable (Inspired or Based on) Items Coefficient Alpha/Composite Reliability Goods versus services (Verhoef and Leeflang, 2009) Please indicate the percentage of your turnover that arise from goods or service markets: Services (1) . . . Goods (10) NA Firm size (ln) What are approximately the total number employees in your firm (in FTEs)? NA Innovativeness of the firm (Covin and Slevin, 1989) In our firm, top managers have a strong emphasis on selling goods/services known and proven in the market (1) . . . a strong emphasis on R&D, technological leadership and innovations (10) NA Number of new product introductions
  • 65. How many products and services has your firm marketed in the past five years? (1 = none, 7 = very many) NA Market-related turbulence (Menon, Bharadwaj, Adidam, and Edison, 1999) (formative) Can you indicate the level of change in the last three years in the most important market where your firm was active on the following elements – production/process technology – introduction of new products/services – R&D activities – competitive intensity – customer preferences (1 = no change, 7 = very frequent changes) .78/NA Marketing research quality (Deshpandé and Zaltman, 1982) (reflective) – The marketing department possesses high-quality market information. – The results of conducted market research can be used to solve problems within our organization. – The used market information is of high quality.
  • 66. (1 = fully disagree, 7 = fully agree) .82/.80 Technical skills (Moorman and Rust, 1999) (reflective) The marketing department in our firm – is effective at translating customer needs into new products or services. – has no sufficient knowledge and skills to translate customer needs into technical specifications. (reverse coded) (1 = fully disagree, 7 = fully agree) .61/.62 Knowledge (marketing and general management) (reflective) – The marketing knowledge of the employees of the marketing department is good. – The knowledge on business economics of employees of the marketing department is good. (1 = fully disagree, 7 = fully agree) .83/.83 Accountability of the marketing department (Moorman and Rust, 1999) (reflective)
  • 67. The marketing department in our firm – is effective at linking their activities to financial outcomes. – shows the financial outcomes of their plans. – has little attention for financial outcomes of their activities (reverse coded). (1 = fully disagree, 7 = fully agree) .83/.79 Innovation performance (Moorman and Rust, 1999) (formative) Relative to your firm’s stated objectives, how is your firm performing on innovation success? (1 = much worse, 7 = much better) Relative to your competitors, how is your organization performing on innovation success? (1 = much worse, 7 = much better) .80/NA Business performance (Moorman and Rust, 1999) (formative) Relative to your firm’s stated objectives, how is your firm performing on: (1 = much worse, 7 = much better) Relative to your competitors, how is your organization performing on: (1 = much worse, 7 = much better)
  • 68. – Customer satisfaction, customer loyalty, turnover, profitability, market share, cost level .87/NA Past market development Over the last three years, what was the average annual market growth or decline for the largest market where your firm was active? (1 = decrease by more than 20%, 9 = increase of more than 20%) NA Generic strategy (Porter, 1980; Verhoef and Leeflang, 2009) Please indicate which of the following generic business strategies is most applicable for your firm: – Cost leadership: strategy to obtain the lowest costs in the market – Differentiation: focusing on being better in different features of the product/service that are important to customers – Cost focus: targeting a relative small segment in the market that is cost-consciousness – Differentiation focus: targeting a relatively small segment in the market that desires a unique and good product and that is willing to pay a higher price for this NA
  • 69. Short-term orientation (Baker, Black, and Hart, 1988) If you would describe the orientation of your firm is this: a short-term orientation (1) . . . a long-term orientation (10) NA B2B, business-to-business; B2C, business-to-consumer; CEO, chief executive officer; FTE, full-time equivalents; NA, not applicable; NPD, new product development; R&D, research and development. 314 J PROD INNOV MANAG W. DRECHSLER ET AL. 2013;30(2):298–315 Appendix B. Correlation Matrix of Constructs in Model (n = 239) M SD (1) (2) (3) (4) (5) (6) (7) (8) (9) (1) Decision influence on NPD 23.76 21.25 1 (2) Initiated NPD projects 27.59 17.96 .543** 1 (3) Innovation performance 4.68 1.11 .165** .041 1 (4) Business performance 4.83 .83 .116* .027 .543** 1 (5) Marketing research quality 4.48 1.30 .358** .293** .219** .213** 1 (6) Technical product skills 4.97 1.36 .324** .253** .068 .105 .352** 1 (7) General marketing knowledge 4.99 1.24 .302** .207** .119* .163 .422** .420** 1 (8) Accountability 4.28 1.36 .312** .245** .091 .061 .362**
  • 70. .370** .507** 1 (9) Marketing-R&D cooperation 2.89 1.41 .040 .029 -.043 -.049 -.041 -.049 -.019 .016 1 (10) CEO—technical background .28 .45 -.144* -.102 .053 .039 -.073 -.070 -.102 -.169** .043 (11) CEO—marketing background .22 .41 .131* .102 .112 .073 .087 .065 -.030 .043 -.009 (12) Short-term emphasis 4.02 2.20 .129* -.017 -.199** -.162* - .163* -.017 -.065 -.002 .082 (13) Cost leadership .12 .32 .018 .088 -.010 .021 -.008 .062 .018 -.041 .029 (14) Differentiation .71 .45 .078 -.025 -.039 -.046 .120 .144 .075 .092 -.031 (15) B2C 2.93 3.05 .265** .250** .161* .072 .290** .136* .149* .218** .016 (16) Services versus goods 4.02 3.12 .099 .045 .056 -.008 .119 - .003 .056 .056 -.152* (17) Firm size 3234.34 11,119.66 -.014 .073 .050 -.041 .217 .087 .126 .017 .048 (18) Innovativeness of the firm 4.53 1.78 -.174** -.154* .128* .010 -.069 -.049 -.127* -.159* .015 (19) Number of new product introductions 5.32 1.17 .042 .046 .375** .353** .112 .159* .095 .026 .023 (20) Past market development 6.24 1.87 -.083 -.107 .074 .208** -.008 -.068 -.024 -.109 .035 (21) Market turbulence 4.33 .89 -.052 -.006 .143* -.004 .123 .025 -.058 .042 .053 (10) (11) (12) (13) (14) (15) (16) (17) (18) (19) (20) (21) (1) Decision influence on NPD (2) Initiated NPD projects (3) Innovation performance (4) Business performance (5) Marketing research quality
  • 71. (6) Technical product skills (7) General marketing knowledge (8) Accountability (9) Marketing-R&D cooperation (10) CEO—technical background 1 (11) CEO—marketing background -.081 1 (12) Short-term emphasis .066 -.097 1 (13) Cost leadership -.083 -.066 .085 1 (14) Differentiation -.014 .023 -.082 -.486 1 (15) B2C -.139* .012 .041 -.005 .077 1 (16) Services versus goods -.121 .031 -.018 -.027 -.011 .239** 1 (17) Firm size .000 -.090 -.061 -.041 .117 .095 .029 1 (18) Innovativeness of the firm .223** .094 -.133* -.006 .040 - .147* -.183** .054 1 (19) Number of new product introductions .027 .158* -.134* - .078 .033 -.003 -.165* .135* .185** 1 (20) Past market development .043 -.067 -.074 -.034 -.124 - .134* -.029 .060 .121 .127* 1 (21) Market turbulence .010 .045 -.099 -.136* .158* .035 .140* .065 .115 .182** .042 1 ** Correlation is significant at the .01 level (two-tailed). * Correlation is significant at the .05 level (two-tailed). B2C, business-to-consumer; M, mean; NPD, new product development; SD, standard deviation; R&D, research and development. IMPROVING MARKETING’S CONTRIBUTION TO NPD J PROD INNOV MANAG 315 2013;30(2):298–315 This document is a scanned copy of a printed document. No
  • 72. warranty is given about the accuracy of the copy. Users should refer to the original published version of the material. International Economic Journal Vol. 22, No. 1, March 2008, 113–126 Does trade regionalism increase stock market segmentation within a trading bloc? Chee Wooi Hooy* Finance Section, School of Management, University Sains Malaysia, Penang, Malaysia (Received 29 June 2006; final version received 7 February 2007 ) Whether trade regionalism remains a stumbling block to economic globalization remains a debatable issue. This paper investigates the impact of trade regionalism on stock market segmentation for the case of AFTA, EU and NAFTA. We exploit the pricing error of the trading-bloc capital asset pricing model (TB-CAPM) as an indicator for stock market seg- mentation based on Akdogan (1992) and Adler and Qi (2003). We use intra-trade ratio as the indicator for trade regionalism. Controlling for other determinants for market integration, evidence is found that trade regionalism helps to explain stock
  • 73. market segmentation in EU and NAFTA, which are both dominated by developed countries. For NAFTA, the higher the intra-trade ratio the lower the degree of market segmentation within the trading bloc. For EU however, the intra-trade ratio contributes to higher stock market segmentation. Keywords: stock market segmentation; trade regionalism; TB- CAPM; intra-trade ratio Introduction The global trend in trade regionalism has entered a new era. The number of trading blocs formally registered with WTO has been accelerating over the last few years. Before the 1990s, only 27 agreements were established. The number jumped to a surprising 162 by 2005, and continues to surge to a total of 205 as of July 2007.1 A hot debate on this phenomenon of increasing regionalism is whether it will hinder or promote a mul- tilateral trading system. Many scholars, including Bhagwati (1993) and Frankel et al. (1995) found that the recent trade regionalism is more likely to be welfare reducing and works against world economic globalization. WTO, however, believes that such development is a complementary progress as long as it can help trade flow more freely *Email: [email protected] ISSN 1016-8737 print/ISSN 1743-517X online © 2008 Korea International Economic Association DOI: 10.1080/10168730801887083
  • 74. http://www.informaworld.com 114 C. W. Hooy within the bloc, without barriers being raised on trade outside the bloc (see GATT Article 24). Regionalism is seen as an instrument that allows groups of countries to negotiate rules and commitments that go beyond what are possible multilaterally, in the hope that they will develop into topics of discussion in WTO later. This view is attributed mainly to MacMillan (1993). In principle, when real sectors get more integrated, capital markets will become less segmented. The intuitive sense is that international finance serves to facilitate international trade. When a country becomes more integrated with their trading bloc counterparts in terms of trade, it will take an initiative to lock- in economic and political reforms to accelerate the transition to a market economy (Hoekman and Kostecki, 2001). This will further lead to policy coordination in both monetary and fiscal aspects among the member countries. With increasing real sector integration, intra-bloc capital flows are likely to be enhanced across borders. The liberalization effort will also reduce cross-market frictions, and the law of one price will play its role to prevent investors from taking advantage of any pricing discrepancies among the bloc members. If the
  • 75. WTO is correct that trade regionalism will promote globalization, then the integration process goes beyond the bloc basis. This means that the reduction in capital market segmentation will happen not only within the bloc, but at the same time, with the rest of the world. Unfortunately, empirical works relating trade regionalism to stock market integration/segmentation remain scarce in the literature. This is probably due to the fact that trade flow information is often not incorporated in the investor’s pric- ing decision. The impact of trade flow can always prevail through various economic fundamentals because they are more easily accessed by the investors. Therefore, macroeconomics-oriented variables are often taken as quite reasonable factors in explaining stock market integration. Among the macroeconomic variables that have been considered in asset pricing models include trade openness, business cycle, exchange rates and interest rates. In addition, others also explore the role of microstruc- ture oriented variables such as dividend yield, liquidity, book- to-market, or even market volatility to explain stock market integration.2 The works of Heaney, Hooper and Jaugietis (2000) and Heaney and Hooper (2001) are the only studies we found to relate integration of the stock market with trading bloc grouping. Both papers utilized cluster analysis to examine whether stock markets
  • 76. form a grouping in a hierarchical dendogram and they recorded clear evidence of world stock market segmentation that is very much consistent with the existence of regional trading bloc and economic ties between the sample countries. Many other market integration studies have pointed out the role of trade regionalism on market integration. Nevertheless, it was not in their objective to test for the direct relationship between the two. These include Heaney and Hooper (1999) and Ng (2002) on AFTA; Akdogan (1992), Corhay, Rad and Urbain (1993), Johnson and Soenen (1993), Johnson, Lindvall and Soenen (1994), Monadjemi and Perry (1996), Choudhry (1996), Kanas (1998) and Fratzscher (2002) on EMU; Soydemir (2000), Seabra (2001), Edwards and Susmel (2001), Chen, Firth and Rui (2002), Heaney, Hooper and Jaugietis (2002) and Johnson and Soenen (2003) on MERCOSUR; and Adler (1995), Ewing, Payne and Sowell (1999), Adler and Qi (2003) on NAFTA. These works have provided strong grounds for further empirical investigation on this issue, but call for a more direct approach. The focus of this paper is to explore how trade regionalism affects the segmentation of stock markets within the trading bloc. We aim to find out if trade regionalism has helped to integrate stock markets among the trading members, or whether it has induced more segmentation among the stock markets within the trading bloc.
  • 77. International Economic Journal 115 The empirical findings of this paper allow the macroeconomic policymakers who are engaged in the trading bloc agreements to understand better the likely impact of real sector convergence on the financial sector integration. In addition, the findings allow the related central banks and security exchanges to take note of the sources of their asset pricing divergences with those of the trading-bloc binding member countries. This paper contributes in two ways. First, we use a mix of a determinant model for market integration, and a cross-section asset pricing approach to investigate the impact of trade regionalism on trading bloc stock market segmentation. Our approach is different from the cluster analysis of Heaney, Hooper and Jaugietis (2000) and Heaney and Hooper (2001). Our model has controlled other important determinants in the market integration process. This leads to the second contribution of this paper. The modeling of trade regionalism as a determinant for market segmentation/integration has extended the determinant model used in Carrieri, Errunza and Hogan (2007) in explaining stock market integration. In fact, we find that trade regionalism plays a relatively important and significant role in explaining stock market segmentation within a trading bloc, as compared to the other integration
  • 78. determinants suggested in Carrieri, Errunza and Hogan (2007). This paper is organized as follows. The next section outlines the framework of analysis and the data employed. The third section presents the statistical results and discussions on the major findings. Concluding comments are in the final section of the paper. Methodology and data Empirical indicators are used to measure the degree of trade regionalism and stock market segmentation in a trading bloc. The level of trade regionalism is represented by the intra-trade ratio, which is referred to as the Trade Regionalism Index (TRI). The TRI for trading bloc T is defined as: TRIT,t = 1 nT nT∑ i=1 BTTit WTTit (1) where nT is the number of member countries in trading bloc T,
  • 79. BTTit is the total bilateral import and export of country-i with the other member countries of the same bloc, and WTTit is the total trade (import plus export) of country-i with the world market. This base measure for goods movement serves to compare real integration within a trading bloc in comparison to total movement to the world market.3 7 According to Korajczyk (1996), pricing errors estimated within the framework of some form of asset pricing model can be used to measure how segmented a subject market is to the world market. Korajczyk (1996) developed an index to capture the dynamic integration states of market integration from the pricing errors estimated under the framework of International Arbitrage Pricing Theory (IAPT). The idea was applied and extended in Levine and Zervos (1998) using both IAPT and World Capital Asset Pricing Model (WCAPM) to study stock market development and economic growth. In this paper, we are interested in measuring stock market segmentation among members that bind under a trade agreement. A variant of asset pricing model applied by Akdogan (1992) and Adler and Qi (2003) is appropriate for this purpose. The model, 116 C. W. Hooy
  • 80. which we shall term as Trading-Bloc Asset Pricing Model (TB- CAPM henceforth) asserts that the pricing of cost of capital can be determined in a linear return-generating process given as follows: rit = αi + βirTB,t + εit ; ∀ i (2) where rit represent the excess market returns of individual country-i and rTB,t represent the excess returns of a portfolio of equal weighted stock indices from a trading bloc. Given that investors are mean-variance optimizers, the beta βi measures the systematic risk of stock market-i with respect to the trading-bloc portfolio movements. The error term εit captures the idiosyncratic risk that is orthogonal to the trading bloc portfolio. The aggregate relative risk aversion of individual investors is assumed to be constant (Chan, Gup and Pan 1992). Akdogan (1995) and Adler and Qi (2003) have explored the use the above TB-CAPM setting in pricing the ‘regionalism effect’ in EU and NAFTA, respectively. With the assumption of perfect trading bloc integration, the intercept αi in model (2) should be equal to zero. This is essentially another version of Black’s (1972) zero-beta CAPM. If αi is significantly different from zero, the hypothesis of perfect integration with the trading bloc is rejected. The pricing error captures the deviation from an integration state. It is therefore appropriate to interpret it as a measure of the degree of segmentation among the stock markets in the trading-bloc
  • 81. portfolio. The pricing error is used to construct an indicator for trading- bloc stock market segmentation. Following Levine and Zervos (1998), the pricing error is adjusted using the following transformation: SMSIT = − |αT| (3) where αT = ∑nT i=1(αi/nT). We refer to this as the stock market segmentation index (SMSI). By making the adjustment, the SMSI is negatively correlated with the degree of segmentation. The value of the index decreases with higher official barriers and taxes to international asset trading, bigger transaction costs, and larger impediments to the flow of firm information (see Korajczyk, 1996). Therefore, the measure indicates that a higher value of SMSI corresponds to a lower degree of market segmentation. Perfect integration with the world market occurs when SMSI is equal to zero. There are various econometric techniques that can be used to generate a stochastic time series for SMSI. While Korajczyk (1996) used a simple rolling approach, Levine and Zervos (1998) only estimated a static model for cross-sectional pricing errors. In this paper, we follow a popular cross-sectional regression method suggested by Fama and
  • 82. MacBeth (1973). This is a two-step procedure based on rolling time-series regression. In the first step, we estimate model (2) for t = 1, 2, . . . , N, where N is the number of observations for the first 5 years, and i = 1, 2, . . . , nT. The estimated beta, β̂TBi , is obtained, and treated as the ex-ante beta for period N + 1, denoted as β̂Wi,N+1. In the second step, the ex-post excess return for period N + 1 is regressed on the ex-ante beta. The following cross-sectional regression is estimated for i = 1, 2, . . . , nT: ri,N+1 = αN+1 + γN+1β̂TBi,N+1 + εi,N+1 (4) From here, the pricing error is obtained and SMSIT,N+1 is computed. The two steps are repeated by moving one observation down the 5-year window, i.e. for t = 2, 3, . . . , N + 1 to compute SMSIT,N+2. The time series SMSIT,t is generated by repeating the whole International Economic Journal 117 process until the last observation. After computing SMSIT,t and TRIT,t for each trading bloc, we estimate the following model: SMSI = a + b1TRI + b′Z + ε (5) In model 5, the SMSI is regressed to the TRI, controlling for a set of information related to the stock market integration process, as captured by the vector of Z.4 Following Carrieri, Errunza and Hogan (2007), we included three variables