
Recommended
Recommended
More Related Content
Similar to Wassim Zhani Starbucks Forecast.pdf
Similar to Wassim Zhani Starbucks Forecast.pdf (20)
More from Wassim Zhani
More from Wassim Zhani (20)
Recently uploaded
Recently uploaded (20)
Wassim Zhani Starbucks Forecast.pdf
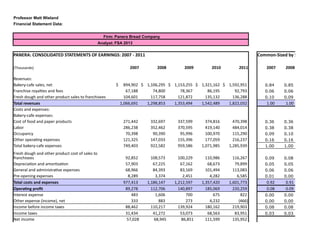
- 1. Professor Matt Wieland Financial Statement Data: Firm: Panera Bread Company Analyst: FSA 2013 PANERA: CONSOLIDATED STATEMENTS OF EARNINGS: 2007 - 2011 Common-Sized by Sales (Thousands) 2007 2008 2009 2010 2011 2007 2008 Revenues: Bakery-cafe sales, net $ 894,902 $ 1,106,295 $ 1,153,255 $ 1,321,162 $ 1,592,951 0.84 0.85 Franchise royalties and fees 67,188 74,800 78,367 86,195 92,793 0.06 0.06 Fresh dough and other product sales to franchisees 104,601 117,758 121,872 135,132 136,288 0.10 0.09 Total revenues 1,066,691 1,298,853 1,353,494 1,542,489 1,822,032 1.00 1.00 Costs and expenses: Bakery-cafe expenses: Cost of food and paper products 271,442 332,697 337,599 374,816 470,398 0.36 0.36 Labor 286,238 352,462 370,595 419,140 484,014 0.38 0.38 Occupancy 70,398 90,390 95,996 100,970 115,290 0.09 0.10 Other operating expenses 121,325 147,033 155,396 177,059 216,237 0.16 0.16 Total bakery-cafe expenses 749,403 922,582 959,586 1,071,985 1,285,939 1.00 1.00 92,852 108,573 100,229 110,986 116,267 0.09 0.08 Depreciation and amortization 57,903 67,225 67,162 68,673 79,899 0.05 0.05 General and administrative expenses 68,966 84,393 83,169 101,494 113,083 0.06 0.06 Pre-opening expenses 8,289 3,374 2,451 4,282 6,585 0.01 0.00 Total costs and expenses 977,413 1,186,147 1,212,597 1,357,420 1,601,773 0.92 0.91 Operating profit 89,278 112,706 140,897 185,069 220,259 0.08 0.09 Interest expense 483 1,606 700 675 822 0.00 0.00 Other expense (income), net 333 883 273 4,232 (466) 0.00 0.00 Income before income taxes 88,462 110,217 139,924 180,162 219,903 0.08 0.08 Income taxes 31,434 41,272 53,073 68,563 83,951 0.03 0.03 Net income 57,028 68,945 86,851 111,599 135,952 Fresh dough and other product cost of sales to franchisees
- 2. (428) 1,509 801 (267) - (0.00) 0.00 Net income attributable to Panera Bread Company 57,456 67,436 86,050 111,866 135,952 0.05 0.05 Less: net (loss) income attributable to noncontrolling interest
- 3. Panera: CONSOLIDATED BALANCE SHEETS: 2007 - 2011 (Thousands) 25-Dec 30-Dec 29-Dec ASSETS 2007 2008 2009 2010 2011 2007 2008 Current assets: Cash and cash equivalents $68,242 $74,710 $246,400 $229,299 $222,640 0.10 0.11 Trade accounts receivable, net 25,152 15,198 17,317 20,378 30,700 0.04 0.02 Other accounts receivable 11,640 9,944 11,176 17,962 24,009 0.02 0.01 Inventories 11,394 11,959 12,295 14,345 17,016 0.02 0.02 Prepaid expenses 5,299 14,265 16,211 23,905 31,228 0.01 0.02 Deferred income taxes 7,199 9,937 18,685 24,796 27,526 0.01 0.01 Short-term investments in government securities 23,198 2,400 - - - 0.03 0.00 Total current assets 152,124 138,413 322,084 330,685 353,119 0.22 0.21 Property and equipment, net 429,992 417,006 403,784 444,094 492,022 0.62 0.62 Other assets: 0.00 0.00 Goodwill 87,092 87,334 87,481 94,442 108,071 0.12 0.13 Other intangible assets, net 21,827 20,475 19,195 48,402 67,269 0.03 0.03 Deposits and other 7,717 8,963 4,621 6,958 6,841 0.01 0.01 - 1,726 - - - 0.00 0.00 Total other assets 116,636 118,498 111,297 149,802 182,181 0.17 0.18 TOTAL ASSETS 698,752 673,917 837,165 924,581 1,027,322 1.00 1.00 LIABILITIES AND SHAREHOLDERS EQUITY Current liabilities: Accounts payable $6,326 $4,036 $6,417 $7,346 $15,884 0.01 0.01 Accrued expenses 121,440 109,978 135,842 204,170 224,450 0.17 0.16 Deferred revenue - - - - - 0.00 0.00 Total current liabilities 127,766 114,014 142,259 211,516 240,334 0.18 0.17 Deferred rent 33,569 39,780 43,371 47,974 54,055 0.05 0.06 Deferred income taxes 75,000 - 28,813 30,264 34,345 0.11 0.00 Other long-term liabilities 14,238 21,437 25,686 39,219 45,512 0.02 0.03 Total liabilities 250,573 175,231 240,129 328,973 374,246 0.36 0.26 0.00 0.00 Investments in government securities and long-term investments
- 4. Minority interest 2,015 3,524 - - - 0.00 0.01 Stockholders’ equity: Common stock, $.0001 par value, Class A 3 3 3 3 3 0.00 0.00 Common stock, $.0001 par value, Class B - - - - - 0 0 Treasury stock, carried at cost (1,188) (2,204) (3,928) (78,990) (175,595) (0.00) (0.00) Additional paid-in capital 168,386 151,358 168,288 130,005 150,093 0.24 0.22 Accumulated other comprehensive income (loss) - (394) 224 275 308 0.00 (0.00) Retained earnings 278,963 346,399 432,449 544,315 680,267 0.40 0.51 Total shareholders equity 446,164 495,162 597,036 595,608 655,076 0.64 0.73 TOTAL LIABILITIES AND SHAREHOLDERS EQUITY $698,752 $673,917 $837,165 $924,581 $1,029,322 1.00 1.00
- 5. PANERA: CONSOLIDATED STATEMENTS OF CASH FLOWS 2007 - 2011 (Thousands) 2007 2008 2009 2010 2011 CASH FLOWS FROM OPERATING ACTIVITIES: Net income $ 57,028 $ 68,945 $ 86,851 $ 111,599 $ 135,952 Adjustments to reconcile net income to net cash provided by operating activities: Depreciation and amortization 57,903 67,225 67,162 68,673 79,899 (Gain) Loss from short-term investments 967 1,910 (1,339) - - Stock-based compensation expense 7,255 7,954 8,661 9,558 9,861 Tax benefit from exercise of stock options (3,731) (3,376) (5,095) (3,603) (4,994) Deferred income taxes (7,276) (4,107) 22,950 (4,660) 1,351 Other 725 228 2,799 1,114 2,423 Changes in operating assets and liabilities, excluding the effect of acquisitions: Trade and other accounts receivable, net (5,549) 11,650 (3,554) (13,180) (16,369) Inventories (1,798) (565) (336) (1,540) (2,183) Prepaid expenses 6,884 (8,966) (2,224) (7,694) (7,323) Deposits and Other 231 1,042 100 (2,337) 117 Accounts payable (815) (2,290) 2,381 929 8,538 Accrued expenses 32,398 5,450 28,901 61,891 19,630 Deferred revenue - - - - - Deferred rent 5,885 6,211 3,591 4,603 6,081 Other long-term liabilities 4,138 6,013 4,056 12,281 3,906 Net cash provided by operating activities 154,245 157,324 214,904 237,634 236,889 CASH FLOWS FROM INVESTING ACTIVITIES: Additions to property and equipment (124,133) (63,163) (54,684) (82,226) (107,932) Acquisitions, net of cash acquired (71,039) (2,704) - (52,177) (44,377) Proceeds from sale of assets (in 2010, bakery cafes) 1,844 - - 2,204 115 Investment maturities proceeds 22,361 17,162 5,465 - - Short-term investments transferred from cash and cash (26,526) - - - - Purchase of investments - - - - - Net cash used in investing activities (170,967) (48,705) (49,219) (132,199) (152,194) CASH FLOWS FROM FINANCING ACTIVITIES: Net payments under credit facility 75,000 (75,000) - - - Repurchase of common stock (27,487) (48,893) (3,453) (153,492) (96,605) Exercise of employee stock options 6,576 17,621 22,818 25,551 3,193
- 6. Tax benefit from exercise of stock options 3,731 3,376 5,095 3,603 4,994 1,782 1,898 1,626 1,802 2,040 Purchase of noncontrolling interest - - (20,081) - - Payment of deferred acquisition holdback (4,976) Capitalized debt issuance costs (209) (1,153) - - - Net cash (used in) provided by financing activities 59,393 (102,151) 6,005 (122,536) (91,354) Net (decrease) increase in cash and cash equivalents 42,671 6,468 171,690 (17,101) (6,659) CASH AND CASH EQUIVALENTS: Beginning of period 52,097 68,242 74,710 246,400 $229,299 End of the period $ 68,242 $ 74,710 $ 246,400 $ 229,299 $222,640 Proceeds from issuance of common stock under employee benefit plans
- 7. zed by Sales Rate of Change I/S 2009 2010 2011 2007 2008 2009 2010 2011 0.85 0.86 0.87 0.34 0.24 0.04 0.15 0.21 0.06 0.06 0.05 0.09 0.11 0.05 0.10 0.08 0.09 0.09 0.07 0.03 0.13 0.03 0.11 0.01 1.00 1.00 1.00 0.29 0.22 0.04 0.14 0.18 0.35 0.39 0.37 0.38 0.23 0.01 0.11 0.26 0.39 0.44 0.38 0.40 0.23 0.05 0.13 0.15 0.10 0.11 0.09 0.45 0.28 0.06 0.05 0.14 0.16 0.18 0.17 0.32 0.21 0.06 0.14 0.22 1.00 1.12 1.00 0.38 0.23 0.04 0.12 0.20 0.07 0.07 0.06 0.08 0.17 (0.08) 0.11 0.05 0.05 0.04 0.04 0.31 0.16 (0.00) 0.02 0.16 0.06 0.07 0.06 0.16 0.22 (0.01) 0.22 0.11 0.00 0.00 0.00 0.34 (0.59) (0.27) 0.75 0.54 0.90 0.88 0.88 0.32 0.21 0.02 0.12 0.18 0.10 0.12 0.12 (0.02) 0.26 0.25 0.31 0.19 0.00 0.00 0.00 4.25 2.33 (0.56) (0.04) 0.22 0.00 0.00 (0.00) (1.17) 1.65 (0.69) 14.50 (1.11) 0.10 0.12 0.12 (0.05) 0.25 0.27 0.29 0.22 0.04 0.04 0.05 (0.07) 0.31 0.29 0.29 0.22
- 8. 0.00 (0.00) - (4.53) (0.47) (1.33) (1.00) 0.06 0.07 0.07 (0.02) 0.17 0.28 0.30 0.22
- 9. 2009 2010 2011 2007 2008 2009 2010 2011 0.29 0.27 0.22 0.31 0.09 2.30 (0.07) (0.03) 0.02 0.02 0.03 0.32 (0.40) 0.14 0.18 0.51 0.01 0.02 0.02 (0.02) (0.15) 0.12 0.61 0.34 0.01 0.02 0.02 0.31 0.05 0.03 0.17 0.19 0.02 0.03 0.03 (0.56) 1.69 0.14 0.47 0.31 0.02 0.03 0.03 0.88 0.38 0.88 0.33 0.11 0.00 0.00 0.00 0.16 (0.90) (1.00) #DIV/0! 0.38 0.40 0.34 0.19 (0.09) 1.33 0.03 0.07 0.48 0.53 0.48 0.24 (0.03) (0.03) 0.10 0.11 0.00 0.00 0.00 0.10 0.11 0.11 0.52 0.00 0.00 0.08 0.14 0.02 0.06 0.07 2.31 (0.06) (0.06) 1.52 0.39 0.01 0.01 0.01 0.48 0.16 (0.48) 0.51 (0.02) 0.00 0.00 0.00 (1.00) #DIV/0! 0.13 0.18 0.18 0.69 0.02 (0.06) 0.35 0.22 1.00 1.10 1.00 0.29 (0.04) 0.24 0.10 0.11 0.01 0.01 0.02 0.09 (0.36) 0.59 0.14 1.16 0.16 0.24 0.22 0.18 (0.09) 0.24 0.50 0.10 0.00 0.00 0.00 (1.00) 0.17 0.25 0.23 0.17 (0.11) 0.25 0.49 0.14 0.05 0.06 0.05 0.21 0.19 0.09 0.11 0.13 0.03 0.04 0.03 (1.00) 0.13 0.03 0.05 0.04 0.86 0.51 0.20 0.53 0.16 0.29 0.39 0.36 0.73 (0.30) 0.37 0.37 0.14 0.00 0.00 0.00
- 10. 0.00 0.00 0.00 0.75 (1.00) #DIV/0! 0.00 0.00 0.00 0.00 0.00 0.00 0.00 0.00 0 0 0.00 (0.00) (0.09) (0.17) 0.32 0.86 0.78 19.11 1.22 0.20 0.16 0.15 (0.04) (0.10) 0.11 (0.23) 0.15 0.00 0.00 0.00 (1.57) 0.23 0.12 0.52 0.65 0.66 0.25 0.24 0.25 0.26 0.25 0.71 0.71 0.64 0.12 0.11 0.21 (0.00) 0.10 1.00 1.10 1.00 0.29 (0.04) 0.24 0.10 0.11
- 11. Professor Matt Wieland Financial Statement Ratios Analyses Firm: Starbucks vs. Panera Analyst: MMW The tables below provide ratios for Starbucks (SBUX) and Panera (PNRA) for the fiscal years 2007 to 2012 Profitability Ratios: 2007 2008 2009 2010 2011 2012 Gross Margin SBUX 55.3% 55.8% 58.4% 57.7% 56.3% PNRA 21.0% 20.6% 21.7% 23.3% 23.0% Operating Margin SBUX 4.9% 5.7% 13.3% 14.8% 15.0% PNRA 8.4% 8.7% 10.4% 12.0% 12.1% Profit Margin SBUX 3.0% 4.0% 8.8% 10.6% 10.4% PNRA 5.4% 5.2% 6.4% 7.3% 7.5% Return on Assets SBUX 6.4% 7.4% 16.2% 18.4% 18.0% PNRA 9.6% 10.0% 11.4% 12.7% 14.0% Components of ROA: Profit Margin for ROA: SBUX 3.4% 4.3% 9.0% 10.8% 10.6% PNRA 5.4% 5.3% 6.4% 7.3% 7.5% Assets Turnover: SBUX 1.88 1.74 1.79 1.70 1.71 PNRA 1.78 1.89 1.79 1.75 1.87 Return on Common Equity: SBUX 13.2% 14.1% 28.1% 30.9% 29.1% PNRA 13.6% 14.3% 15.8% 18.8% 21.7% Components of ROCE: Profit Margin for ROCE: SBUX 3.0% 4.0% 8.8% 10.6% 10.4% PNRA 5.4% 5.2% 6.4% 7.3% 7.5% Assets Turnover: SBUX 1.88 1.74 1.79 1.70 1.71 PNRA 1.78 1.89 1.79 1.75 1.87 Capital Structure Leverage: SBUX 2.31 2.03 1.78 1.70 1.64 PNRA 1.42 1.46 1.38 1.48 1.56 Efficiency Ratios: Total Asset Turnover SBUX 1.88 1.74 1.79 1.70 1.71 PNRA 1.78 1.89 1.79 1.75 1.87 Fixed Asset Turnover SBUX 3.55 3.56 4.32 4.90 5.31 PNRA 2.75 3.07 3.30 3.64 3.89 Current Asset Turnover SBUX 6.03 5.17 4.47 3.57 3.33 PNRA 8.21 8.94 5.88 4.73 5.33 Receivables Turnover SBUX 33.63 32.55 37.33 33.95 30.49 Days in Receivables 10.9 11.2 9.8 10.7 12.0 PNRA 31.5 41.9 50.5 46.2 39.2 11.6 8.7 7.2 7.9 9.3 Inventory Turnover SBUX 6.71 6.37 7.38 6.56 5.27 Days in Inventory 54.4 57.3 49.5 55.6 69.3 PNRA 83.8 88.3 87.4 88.8 89.4 4.4 4.1 4.2 4.1 4.1 Accounts Payable Turnover SBUX 12.98 14.52 15.78 13.06 12.98 Days in Accounts Payable 28.1 25.1 23.1 27.9 28.1 PNRA 60.5 199.1 202.8 172.2 121.0 6.0 4.3 4.3 4.3 4.3 Days in Cash Operating Cycle SBUX 37.1 43.4 36.1 38.4 53.1 PNRA 9.9 8.6 7.1 7.7 9.1
- 12. Liquidity and Leverage Ratios: Current SBUX 1.18 1.29 1.55 1.83 1.90 PNRA 1.19 1.21 2.26 1.56 1.47 Quick (Acid Test) SBUX 0.44 0.59 0.98 1.17 1.14 PNRA 0.62 0.76 1.82 1.15 1.00 Cash Flows to Current Liabs. SBUX 0.86 0.91 1.01 0.84 0.82 PNRA 1.30 1.68 1.34 1.05 Long-term Debt SBUX 0.18 0.15 0.13 0.11 0.10 PNRA 0.00 0.00 0.00 0.00 0.00 Debt to Equity SBUX 0.22 0.18 0.15 0.13 0.11 PNRA 0.00 0.00 0.00 0.00 0.00 Total Liabilities to Assets SBUX 0.44 0.45 0.42 0.40 0.38 PNRA 0.36 0.26 0.29 0.36 0.36 Total Liabilities to Equity SBUX 0.99 0.82 0.73 0.68 0.61 PNRA 0.56 0.35 0.40 0.55 0.57 Total Assets to Equity SBUX 2.28 1.82 1.73 1.68 1.61 PNRA 1.57 1.36 1.40 1.55 1.57 Total Int.-Bearing Debt to Ass SBUX 0.10 0.10 0.09 0.07 0.07 PNRA 0.00 0.00 0.00 0.00 0.00 Total Int.-Bearing Debt to Equ SBUX 0.22 0.18 0.15 0.13 0.11 PNRA 0.00 0.00 0.00 0.00 0.00 Interest Coverage SBUX 9.44 14.37 43.41 51.91 61.08 PNRA 0.00 0.00 0.00 0.00 0.00 Interest Coverage: Cash Basi SBUX 30.34 46.52 na 86.83 96.84 PNRA 0.00 0.00 0.00 0.00 0.00 Cash Flows to Total Liabs. SBUX 0.52 0.56 0.65 0.57 0.58 PNRA 0.62 0.90 0.89 0.72 0.63 Altman Z-score SBUX PNRA Beneish Score Probability SBUX PNRA Revenues to Cash Ratio SBUX 37.68 22.48 12.14 10.12 11.38 Days Revenues in Cash 10 16 30 36 32 PNRA 18.17 8.43 6.49 8.06 20 43 56 45 Growth Measures: Sales Growth: SBUX 10.3% -5.9% 9.5% 9.3% 13.7% PNRA 21.8% 4.2% 14.0% 18.1% Earnings Growth: SBUX -53.1% 23.9% 142.0% 31.7% 11.1% PNRA 17.4% 27.6% 30.0% 21.5% Asset Growth: SBUX 6.2% -1.7% 14.5% 15.3% 11.7% PNRA -3.6% 24.2% 10.4% 11.1% Sustainable Growth: SBUX 0.13 0.13 0.27 0.30 0.29 PNRA 0.13 0.16 0.20 0.22
- 13. Professor Matt Wieland Financial Statement Data: Firm: Starbucks Corporation Analyst: FSA 2013 Starbucks: CONSOLIDATED STATEMENTS OF EARNINGS: 2003 - 2012 (Millions) 2008 2009 2010 2011 2012 Net revenues: Company-operated stores $8,771.90 $8,180.10 $8,963.50 $9,632.40 $10,534.50 Licensed stores 1,171.60 795.00 875.20 1,007.50 1,210.30 CPG, foodservice and other 439.50 799.50 868.70 1,060.50 1,554.70 Total net revenues $10,383.00 $9,774.60 $10,707.40 11,700.40 13,299.50 Cost of sales including occupancy costs 4,645.30 4,324.90 4,458.60 4,949.30 5,813.30 Store operating expenses 3,745.10 3,425.10 3,551.40 3,665.10 3,918.10 Other operating expenses 330.10 264.40 293.20 402.00 429.90 Depreciation and amortization expenses 549.30 534.70 510.40 523.30 550.30 General and administrative expenses 456.00 453.00 569.50 636.10 801.20 Restructuring Charges 266.90 332.40 53.00 0.00 0.00 Total operating expenses 9,992.70 9,334.50 9,436.10 10,175.80 11,512.80 Gain on sale of properties 30.20 Income from equity investees 113.60 121.90 148.10 173.70 210.70 Operating income 503.90 562.00 1,419.40 1,728.50 1,997.40 Interest income and other, net 5.20 37.00 50.30 115.90 94.40 Interest expense (53.40) (39.10) (32.70) (33.30) (32.70) Earnings before income taxes 455.70 559.90 1,437.00 1,811.10 2,059.10 Income taxes 144.00 168.40 488.70 563.10 674.40 Earnings before cumulative effect of change in accounting principle 311.70 391.50 948.30 1,248.00 1,384.70 Cumulative effect of accounting change for FIN 47, net of taxes Net earnings including noncontrolling interests $311.70 $391.50 $948.30 $1,248.00 $1,384.70 Net earnings (loss) attributable to noncontrolling interests -3.8 0.7 2.7 2.3 0.9 Net earnings attributable to Starbucks $315.50 $390.80 $945.60 $1,245.70 $1,383.80
- 14. Starbucks: CONSOLIDATED BALANCE SHEETS: 2003 - 2012 (Millions) ASSETS 2008 2009 2010 2011 2012 Current assets: Cash and cash equivalents $269.80 $599.80 $1,164.00 $1,148.10 $1,188.60 Short-term investments - available-for-sale securities 3.00 21.50 236.50 855.00 848.40 Short-term investments - trading securities 49.50 44.80 49.20 47.60 Accounts receivable, net 329.50 271.00 302.70 386.50 485.90 Inventories 692.80 664.90 543.30 965.80 1,241.50 Prepaid expenses and other current assets 169.20 147.20 156.50 161.50 196.50 Deferred income taxes, net 234.20 286.60 304.20 230.40 238.70 Total current assets $1,748.00 $2,035.80 $2,756.40 $3,794.90 $4,199.60 Long-term investments - available-for-sale securities 71.40 71.20 191.80 107.00 116.00 Equity and cost investments 302.60 352.30 341.50 372.30 459.90 Property, plant and equipment, net 2,956.40 2,536.40 2,416.50 2,355.00 2,658.90 Other assets 261.10 253.80 346.50 297.70 385.70 Other intangible assets 66.60 68.20 70.80 111.90 Goodwill 266.50 259.10 262.40 321.60 399.10 TOTAL ASSETS $5,672.60 $5,576.80 $6,385.90 $7,360.40 $8,219.20 LIABILITIES AND SHAREHOLDERS EQUITY 303.90 Current liabilities: Accounts payable 324.90 267.10 282.60 540.00 398.10 Accrued compensation and related costs 253.60 307.50 400.00 364.40 381.60 Accrued occupancy costs 136.10 188.10 173.20 148.30 126.90 Accrued taxes 76.10 127.80 100.20 109.20 138.30 Insurance reserves 152.50 154.30 146.20 145.60 167.70 Other accrued liabilities 164.40 147.50 262.80 319.00 487.00 Deferred revenue 368.40 388.70 414.10 449.30 510.20 Current portion of long-term debt 0.70 - - - - Commercial paper and short-term borrowings 713.00 - - - - Total current liabilities $1,476.70 $1,581.00 $1,779.10 $2,075.80 $2,209.80 Long-term debt 549.60 549.30 549.40 549.50 549.60
- 15. Other long-term liabilities 442.40 389.60 375.10 347.80 345.30 Deferred income taxes, net Total liabilities $2,468.70 $2,519.90 $2,703.60 $2,973.10 $3,104.70 Shareholders equity: Common stock 0.70 0.70 0.70 0.70 0.70 Additional paid-in capital - 147.00 106.20 1.10 Other additional paid-in-capital 39.40 39.40 39.40 39.40 39.40 Retained earnings 2,402.40 2,793.20 3,471.20 4,297.40 5,046.20 Accumulated other comprehensive income 48.40 65.40 57.20 46.30 22.70 Total shareholders' equity 2,490.90 3,045.70 3,674.70 4,384.90 5,109.00 Noncontrolling interests - 11.20 7.60 2.40 5.50 Total equity $2,490.90 $3,056.90 $3,682.30 $4,387.30 $5,114.50 TOTAL LIABILITIES AND SHAREHOLDERS EQUITY $4,959.60 $5,576.80 $6,385.90 $7,360.40 $8,219.20
- 16. STARBUCKS: CONSOLIDATED STATEMENTS OF CASH FLOWS 2005 - 2012 (Millions) 2008 2009 2010 2011 2012 OPERATING ACTIVITIES: Net earnings $311.70 $391.50 $948.30 1248 1384.7 Adjustments to reconcile net earnings to net cash provided by operating activities: Cumulative effect of accounting change for FIN 47, net of taxes - - - - - Depreciation and amortization 604.50 563.30 540.80 550.00 580.60 Gain on sale of properties - - - (30.22) Provision for impairments and asset disposals 325.00 224.40 67.70 36.20 Deferred income taxes, net (117.10) (69.60) (42.00) 106.20 61.10 Equity in income of investees (61.30) (78.40) (108.60) (118.50) (49.30) Distributions of income from equity investees 52.60 53.00 91.40 85.60 Gain resulting from acquisition of joint ventures - - (23.10) (55.20) Stock-based compensation 75.00 83.20 113.60 145.20 153.60 Excess tax benefit from exercise of stock (14.70) (15.90) (36.90) (103.90) options - - - - Other (0.10) 5.40 7.80 (2.90) 23.60 Cash provided/(used) by changes in operating assets and liabilities: Accounts receivable - 59.10 (33.40) (88.70) (90.30) Inventories (0.60) 28.50 123.20 (422.30) (273.30) Accounts payable (63.90) (53.00) (3.60) 227.50 (105.20) Accrued taxes 7.30 59.20 0.60 104.00 Deferred revenue 72.40 16.30 24.20 35.80 60.80 Other operating assets (11.20) 61.40 17.30 (22.50) (19.70) Other operating liabilities 71.50 60.60 17.60 (81.90) 23.70 Net cash provided by operating activities $1,251.10 $1,389.00 $1,704.90 $1,612.38 $1,750.30 INVESTING ACTIVITIES: Purchase of available-for-sale securities (71.80) (129.20) (549.00) (966.00) (1748.60) Maturities and calls of available-for-sale securities 20.00 111.00 209.90 430.00 1796.40 Sales of available-for-sale securities 75.90 5.00 1.10 0.00 Acquisitions, net of cash acquired (74.20) 0.00 (12.00) (55.80) (129.10) Net (purchases)/sales of equity, other investments and other assets (52.00) (4.80) 1.20 (13.20) (41.80) Additions to property, plant and equipment (984.50) (445.60) (440.70) (531.90) (856.20) Proceeds from sale of prroperty, plant and equipment 42.50 0.00 117.40 5.30
- 17. Net cash used by investing activities ($1,086.60) ($421.10) ($789.50) ($1,019.50) ($974.00) FINANCING ACTIVITIES: Proceeds from issuance of commercial paper 65770.80 20965.40 - - Repayments of commercial paper (66068.00) (21378.50) - - Proceeds from short-term borrowings 528.20 1338.00 - 30.80 (30.80) Repayments of short-term borrowings (228.80) (1638.00) - - Purchase of noncontrolling interest - - (45.80) (27.50) Proceeds from issuance of common stock 112.30 57.30 127.90 235.40 236.60 Excess tax benefit from exercise of stock options 14.70 15.90 36.90 103.90 169.80 Principal payments on long-term debt (0.60) (0.70) (6.60) (4.30) Cash dividends paid - - (171.00) (389.50) (513.00) Repurchase of common stock (311.40) - (285.60) (555.90) (549.10) Proceeds from issuance of long-term debt - - - - Other (1.70) (1.60) (1.80) (0.90) (59.00) Net cash used by financing activities (185) (642) (346) ($608.00) ($745.50) Effect of exchange rate changes on cash and cash equivalents 0.90 4.30 (5.20) (0.80) 9.70 Net increase/(decrease) in cash and cash equivalents ($19.10) $330.00 $564.20 ($15.92) $40.50 CASH AND CASH EQUIVALENTS: Beginning of period #REF! 269.80 599.80 1164.00 1148.10 End of the period 269.80 599.80 1164.00 1148.10 1188.60 #REF! 330 564.2 -15.9 40.50 SUPPLEMENTAL DISCLOSURE OF CASH FLOW INFORMATION: Cash paid during the period for: Interest, net of capitalized interest $52.70 $39.80 $32.00 $34.40 $34.40 Income taxes $259.50 $162.00 $527.00 $350.10 $350.10
- 18. Common-Sized Statements of Earnings Rate of Change Statements of Earnings 2008 2009 2010 2011 2012 2008 2009 2010 2011 2012 0.84 0.84 0.84 0.82 0.79 0.10 (0.07) 0.10 0.07 0.09 0.11 0.08 0.08 0.09 0.09 0.14 (0.32) 0.10 0.15 0.20 0.04 0.08 0.08 0.09 0.12 0.14 0.82 0.09 0.22 0.47 1.00 1.00 1.00 1.00 1.00 0.10 (0.059) 0.095 0.093 0.137 0.349 0.325 0.335 0.423 0.437 0.16 (0.07) 0.03 0.11 0.17 0.361 0.350 0.332 0.313 0.295 0.16 (0.09) 0.04 0.03 0.07 0.032 0.027 0.027 0.034 0.032 0.12 (0.20) 0.11 0.37 0.07 0.053 0.055 0.048 0.045 0.041 0.18 (0.03) (0.05) 0.03 0.05 0.044 0.046 0.053 0.054 0.060 (0.07) (0.01) 0.26 0.12 0.26 0.026 0.034 0.005 - - 0.25 (0.84) (1.00) na 1.00 1.00 1.00 1.00 1.00 0.18 (0.07) 0.01 0.08 0.13 0.00 0.01 0.01 0.01 0.01 0.02 0.05 0.07 0.21 0.17 0.21 0.05 0.06 0.13 0.15 0.15 (0.52) 0.12 1.53 0.22 0.16 0.00 0.00 0.00 0.01 0.01 (0.87) 6.12 0.36 1.30 (0.19) (0.01) (0.00) (0.00) (0.00) (0.00) 0.41 (0.27) (0.16) 0.02 (0.02) 0.04 0.06 0.13 0.15 0.15 (0.57) 0.23 1.57 0.26 0.14 0.01 0.02 0.05 0.05 0.05 (0.62) 0.17 1.90 0.15 0.20 0.03 0.04 0.09 0.11 0.10 (0.54) 0.26 1.42 0.32 0.11 - - - - - 0.03 0.04 0.09 0.11 0.10 (0.54) 0.26 1.42 0.32 0.11 (0.00) 0.00 0.00 0.00 0.00 (1.18) 2.86 (0.15) (0.61) 0.03 0.04 0.09 0.11 0.10 (0.53) 0.24 1.42 0.32 0.11
- 19. Common-Sized Balance Sheets Rate of Change Balance Sheets 2008 2009 2010 2011 2012 2008 2009 2010 2011 2012 0.048 0.108 0.182 0.156 0.145 -0.04 1.22 0.94 -0.01 0.04 0.001 0.004 0.037 0.116 0.103 -0.96 6.17 10.00 2.62 -0.01 0.009 0.008 0.008 0.006 0.000 -0.33 -0.09 0.10 -0.03 -1.00 0.058 0.049 0.047 0.053 0.059 0.14 -0.18 0.12 0.28 0.26 0.122 0.119 0.085 0.131 0.151 0.00 -0.04 -0.18 0.78 0.29 0.030 0.026 0.025 0.022 0.024 0.137 -0.130 0.063 0.032 0.217 0.041 0.051 0.048 0.031 0.029 0.81 0.22 0.06 -0.24 0.04 0.31 0.37 0.43 0.52 0.51 0.03 0.16 0.35 0.38 0.11 0.013 0.013 0.030 0.015 0.014 2.40 0.00 1.69 -0.44 0.08 0.053 0.063 0.053 0.051 0.056 0.17 0.16 -0.03 0.09 0.24 0.521 0.455 0.378 0.320 0.323 0.02 -0.14 -0.05 -0.03 0.13 0.046 0.046 0.054 0.040 0.047 0.19 -0.03 0.37 -0.14 0.30 0.012 0.012 0.011 0.015 0.000 0.58 0.02 0.04 0.58 -1.00 0.047 0.046 0.041 0.044 0.049 0.24 -0.03 0.01 0.23 0.24 1.00 1.00 1.00 1.00 1.00 0.06 -0.02 0.15 0.15 0.12 0.057 0.048 0.044 0.073 0.048 -0.17 -0.18 0.06 0.91 -0.26 0.045 0.055 0.063 0.050 0.046 -0.13 0.21 0.30 -0.09 0.05 0.024 0.034 0.027 0.020 0.015 0.82 0.38 -0.08 -0.14 -0.14 0.013 0.023 0.016 0.015 0.017 -0.18 0.68 -0.22 0.09 0.27 0.027 0.028 0.023 0.020 0.020 0.11 0.01 -0.05 0.00 0.15 0.029 0.026 0.041 0.043 0.059 0.03 -0.10 0.78 0.21 0.53 0.065 0.070 0.065 0.061 0.062 0.24 0.06 0.07 0.09 0.14 0.000 0.000 0.000 0.000 0.000 -0.13 -1.00 na na na 0.13 0.00 0.00 0.00 0.00 0.00 -1.00 na na na 0.26 0.28 0.28 0.28 0.27 0.02 0.07 0.13 0.17 0.06 0.097 0.098 0.086 0.075 0.067 0.00 0.00 0.00 0.00 0.00
- 20. 0.078 0.070 0.059 0.047 0.042 0.25 -0.12 -0.04 -0.07 -0.01 0.000 0.000 0.000 0.000 0.000 0.44 0.45 0.42 0.40 0.38 0.05 0.02 0.07 0.10 0.04 0.000 0.000 0.000 0.000 0.000 0.00 0.00 0.00 0.00 0.00 0.000 0.026 0.017 0.000 0.000 0.007 0.007 0.006 0.005 0.005 0.00 0.00 0.00 0.00 0.00 0.424 0.501 0.544 0.584 0.614 0.10 0.16 0.24 0.24 0.17 0.009 0.012 0.009 0.006 0.003 -0.11 0.35 -0.13 -0.19 -0.51 0.09 0.22 0.21 0.19 0.17 0.00 0.00 0.00 0.00 0.44 0.55 0.58 0.60 0.62 0.09 0.23 0.20 0.19 0.17 0.87 1.00 1.00 1.00 1.00 0.07 0.12 0.15 0.15 0.12
- 21. Rate of Return on equity Investments 2009 2010 2011 2012 0.3722706 0.426924 0.486691 0.506369 Deferred Revenue Income 2009 2010 2011 2012 breakage 31.2 46.9 65.8 0.077728 0.10864 0.137155 36.8 0.076707 Interest expense/long-term debt 0.071 0.060 0.061 0.059 Interest income/short-term investments 1.609 0.203 0.119 0.111 CAPEX divided by sales 2009 2010 2011 2012 4.6% 4.1% 4.5% 6.4%
- 22. Professor Matt Wieland Financial Statement Forecast Development: Firm: Starbucks Analyst: FSA 2013 Starbucks: Sales Analysis by Segment and Type: Starbucks: Sales Forecasts by Segment a (input your forecast assumptions in the bl Sales (in thousands): 2008 2009 2010 2011 2012 2013 2014 Retail Company-operated retail 8,771.9 8,180.1 8,963.5 9,632.4 10,534.5 11,516.6 11,732.9 -6.7% 9.6% 7.5% 9.4% Licensed Stores 1,171.6 795.0 875.2 1,007.5 1,210.3 1,509.5 1,565.3 -32.1% 10.1% 15.1% 20.1% CPG, Foodservice, and other 439.5 799.5 868.7 1,060.5 1,554.7 2,145.5 2,145.5 81.9% 8.7% 22.1% 46.6% 38% 0% Net Revenues 10,383.0 9,774.6 10,707.4 11,700.4 13,299.5 15,171.6 15,443.7 2007 Sales 9,411.5 Implied sales growth forecasts: Sales growth rates: 10.3% -5.9% 9.5% 9.3% 13.7% 14.1% 1.8% % Company-operated: 0.845 0.837 0.837 0.823 0.792 Sales per Average Store-Year Company-operated retail: Expectations for comparable store sales g 2008 2009 2010 2011 2012 2013 2014 Company-operated retail 0.978 0.897 1.007 1.078 1.144 1.202 1.202 8,624 -8.3% 12.3% 7.0% 6.2% 5% 0% Licensed Stores 0.170 0.105 0.112 0.126 0.145 0.168 0.168 6,387 -38.1% 5.8% 13.0% 15.3% 16% 0% Percentage change in comparable store sales (company provided): Americas -4% -6% 7% 8% 8% EMEA 1% -3% 5% 3% 0% CAP 8% 2% 11% 22% 15%
- 23. Starbucks: Store Operating Data: Forecasts: Numbers of Stores 2008 2009 2010 2011 2012 2013 2014 New stores opened during the year, net: Americas Expectations for net new stores to be ope Company-operated: 561 (417) (33) 43 234 150 0 Licensed: 558 101 111 (268) 270 165 0 EMEA Company-operated: 127 20 (64) 25 10 10 0 Licensed: 153 98 100 79 101 100 0 CAP Company-operated: 9 24 30 73 154 200 0 Licensed: 261 129 79 193 294 400 0 Totals Company-operated: 697 (373) (67) 141 398 360 0 Licensed: 972 328 290 4 665 665 0 Total stores opened 1,669 (45) 223 145 1,063 1,025 0 Stores open at year end: Implied Expectations for Total Stores to be Americas Company-operated: 8,030 7,613 7,580 7,623 7,857 8,007 8,007 Licensed: 4,832 4,933 5,044 4,776 5,046 5,211 5,211 EMEA Company-operated: 891 911 847 872 882 892 892 Licensed: 609 707 807 886 987 1,087 1,087 CAP Company-operated: 385 409 439 512 666 866 866 Licensed: 1,933 2,062 2,141 2,334 2,628 3,028 3,028 Totals Company-operated: 9,306 8,933 8,866 9,007 9,405 9,765 9,765 Licensed: 7,374 7,702 7,992 7,996 8,661 9,326 9,326 Total stores open: 16,680 16,635 16,858 17,003 18,066 19,091 19,091 Implied store growth rate forecasts:
- 24. Store growth rates: #VALUE! -0.3% 1.3% 0.9% 6.3% 5.7% 0.0% Company Operated Store Growth -4.0% -0.8% 1.6% 4.4% 3.8% 0.0%
- 25. Capital Expenditures on New Stores: CAPEX Forecasts: 2008 2009 2010 2011 2012 2013 2014 CAPEX: $ 1,080.3 $ 984.5 $ 445.8 $ 531.9 $ 856.2 $1,200.0 $1,028.3 New Company- operated Stores (373) (67) 141 398 360 0 Average CAPEX per New Store $ (2.639) $ (6.654) $ 3.772 $ 2.151 $ 2.216 $ 2.282 CAPEX Inflation Forecast: 940.5000 3% 3% Additional CAPEX Requirements: equirements: 521.0 1,028.3 (store refurbishments, and other)ts, and other) *assume they refurbish each store every _ Property, Plant and Equipment and Depreciation Property, Plant and Equipment and Deprec Actual Forecast: 2007 2008 2009 2010 2011 2012 2013 2014 PP&E: 5306.5 $5,717.3 $5,700.9 $5,888.7 $6,163.1 $6,903.1 8103.1 9131.4 Accum. Deprec. -2416.1 -$2,760.9 -$3,164.5 -$3,472.2 -$3,808.1 -$4,244.2 -4991.9 -5834.6 PP&E - net 2890.4 $ 2,956.4 $ 2,536.4 $ 2,416.5 $ 2,355.0 $ 2,658.9 3111.2 3296.8 CAPEX Forecasts from above: 1200.0 1028.3 Depreciation Expense: 604.5 563.3 540.8 550.0 580.6 PP&E in place at end of 2012: $ 2,658.9 637.0 637.0 Remaining balance to be depreciated. 2021.9 1384.9 PP&E Purchases: Capex 2012 1200.0 110.7 110.7 Capex 2013 1028.3 94.9 Capex 2014 1059.1 Capex 2015 1090.9 Capex 2016 1123.6
- 26. Capex 2017 1157.3 Capex 2018 1192.0 Capex 2019 1227.8 Capex 2020 1264.6 Capex 2021 1302.6 Capex 2022 556.5 Total Depreciation Expense 747.7 842.6 2008 2009 2010 2011 2012 Depreciation methods: Gross PPE $ 5,717 $ 5,701 $ 5,889 $ 6,163 $ 6,903 Depreciable PPE $ 5,365 $ 5,524 $ 5,657 $ 5,991 $ 6,593 (remove land and work in progress) Average Depreciable PPE $ 5,444 $ 5,590 $ 5,824 $ 6,292 Depreciation Expense $563.3 $540.8 $550.0 $580.6 Implied Average Useful Life in Years 9.7 10.3 10.6 10.8
- 27. ales Forecasts by Segment and Type orecast assumptions in the blue font cells) 2015 2016 2017 2018 2019 2020 2021 2022 11,732.9 11,732.9 11,732.9 11,732.9 11,732.9 11,732.9 11,732.9 11,732.9 1,565.3 1,565.3 1,565.3 1,565.3 1,565.3 1,565.3 1,565.3 1,565.3 2,145.5 2,145.5 2,145.5 2,145.5 2,145.5 2,145.5 2,145.5 2,145.5 0% 0% 0% 0% 0% 0% 0% 0% 15,443.7 15,443.7 15,443.7 15,443.7 15,443.7 15,443.7 15,443.7 15,443.7 s growth forecasts: 0.0% 0.0% 0.0% 0.0% 0.0% 0.0% 0.0% 0.0% s for comparable store sales growth rates by segment: 2015 2016 2017 2018 2019 2020 2021 2022 1.202 1.202 1.202 1.202 1.202 1.202 1.202 1.202 0% 0% 0% 0% 0% 0% 0% 0% 0.168 0.168 0.168 0.168 0.168 0.168 0.168 0.168 0% 0% 0% 0% 0% 0% 0% 0%
- 28. umbers of Stores 2015 2016 2017 2018 2019 2020 2021 2022 s for net new stores to be opened each year: 0 0 0 0 0 0 0 0 0 0 0 0 0 0 0 0 0 0 0 0 0 0 0 0 0 0 0 0 0 0 0 0 0 0 0 0 0 0 0 0 0 0 0 0 0 0 0 0 0 0 0 0 0 0 0 0 0 0 0 0 0 0 0 0 0 0 0 0 0 0 0 0 ctations for Total Stores to be Open: 8,007 8,007 8,007 8,007 8,007 8,007 8,007 8,007 5,211 5,211 5,211 5,211 5,211 5,211 5,211 5,211 892 892 892 892 892 892 892 892 1,087 1,087 1,087 1,087 1,087 1,087 1,087 1,087 866 866 866 866 866 866 866 866 3,028 3,028 3,028 3,028 3,028 3,028 3,028 3,028 9,765 9,765 9,765 9,765 9,765 9,765 9,765 9,765 9,326 9,326 9,326 9,326 9,326 9,326 9,326 9,326 19,091 19,091 19,091 19,091 19,091 19,091 19,091 19,091 e growth rate forecasts:
- 29. 0.0% 0.0% 0.0% 0.0% 0.0% 0.0% 0.0% 0.0% 0.0% 0.0% 0.0% 0.0% 0.0% 0.0% 0.0% 0.0%
- 30. 2015 2016 2017 2018 2019 2020 2021 2022 $1,059.1 $1,090.9 $1,123.6 $1,157.3 $1,192.0 $1,227.8 $1,264.6 $1,302.6 556.5 0 0 0 0 0 0 0 0 $ 2.351 $ 2.421 $ 2.494 $ 2.569 $ 2.646 $ 2.725 $ 2.807 $ 2.891 tion Forecast: 3% 3% 3% 3% 3% 3% 3% 3% 1,059.1 1,090.9 1,123.6 1,157.3 1,192.0 1,227.8 1,264.6 1,302.6 y refurbish each store every __ years and it costs 25% of original build-out nt and Equipment and Depreciation Forecasts: 2015 2016 2017 2018 2019 2020 2021 2022 2023 10190.5 11281.4 12405.0 13562.3 14754.4 15982.2 17246.8 18549.4 19105.9 -6774.9 -7815.9 -8434.5 -9049.0 -9773.5 -10611.3 -11565.8 -12640.5 -13019.8 3415.6 3465.4 3970.5 4513.3 4980.8 5370.9 5681.0 5908.9 0.0 1059.1 1090.9 1123.6 1157.3 1192.0 1227.8 1264.6 1302.6 556.5 637.0 637.0 110.9 0.0 0.0 0.0 0.0 0.0 0.0 747.9 110.9 0.0 0.0 0.0 0.0 0.0 0.0 0.0 110.7 110.7 110.7 110.7 110.7 110.7 110.7 110.7 110.7 94.9 94.9 94.9 94.9 94.9 94.9 94.9 94.9 94.9 97.7 97.7 97.7 97.7 97.7 97.7 97.7 97.7 97.7 100.7 100.7 100.7 100.7 100.7 100.7 100.7 100.7 103.7 103.7 103.7 103.7 103.7 103.7 103.7
- 31. 106.8 106.8 106.8 106.8 106.8 106.8 110.0 110.0 110.0 110.0 110.0 113.3 113.3 113.3 113.3 116.7 116.7 116.7 120.2 120.2 51.4 940.4 1041.0 618.6 614.5 724.5 837.8 954.5 1074.7 379.2 379.2 3% d and work in progress)
- 32. 2658.9 1218.1 55.9 1004.8 97.7 57.6 1034.9 100.7 100.7 59.3 1066.0 103.7 103.7 103.7 61.1 1098.0
- 33. 106.8 106.8 106.8 106.8 63.0 1130.9 110.0 110.0 110.0 110.0 110.0 64.8 1164.8 113.3 113.3 113.3 113.3 113.3 113.3 66.8 1199.8 116.7 116.7 116.7 116.7 116.7 116.7 116.7 68.8 1235.8 120.2 120.2 120.2 120.2 120.2 120.2 120.2 120.2 70.9 1272.9 51.4 51.4 51.4 51.4 51.4 51.4 51.4 51.4 51.4 513.5 assumption for long run growth rate
- 34. Professor Matt Wieland Financial Statement Forecasts Firm: Starbucks Analyst: FSA 2013 Starbucks: Income Statement Forecasts Actual Forecasts (Thousands) 2012 2013 2014 2015 2016 2017 2018 Company-operated stores $10,534.5 11,516.6 11,732.9 11,732.9 11,732.9 11,732.9 11,732.9 Licensed stores $1,210.3 1,509.5 1,565.3 1,565.3 1,565.3 1,565.3 1,565.3 CPG, foodservice and other $1,554.7 2,145.5 2,145.5 2,145.5 2,145.5 2,145.5 2,145.5 Total net revenues $13,299.5 $15,171.6 $15,443.7 $15,443.7 $15,443.7 $15,443.7 $15,443.7 2011 Total net revenues $11,700.4 see sales forecast development implied growth 13.7% 14.1% 1.8% 0.0% 0.0% 0.0% 0.0% Cost of sales including occupancy costs $5,813.3 6630.0 6430.8 6430.8 6430.8 6430.8 6430.8 43.7% 43.7% 41.6% 41.6% 41.6% 41.6% 41.6% Gross Profit $7,486.2 $8,541.6 $9,012.9 $9,012.9 $9,012.9 $9,012.9 $9,012.9 implied margins 56.3% 56.3% 58.4% 58.4% 58.4% 58.4% 58.4% Store operating expenses $3,918.1 4248.0 5127.3 5127.3 5127.3 5127.3 5127.3 29.5% 28.0% 33.2% 33.2% 33.2% 33.2% 33.2% Other operating expenses $429.9 490.4 422.9 422.9 422.9 422.9 422.9 3.2% 3.2% 2.7% 2.7% 2.7% 2.7% 2.7% Depreciation and amortization expenses $550.3 747.7 842.6 940.4 1041.0 618.6 614.5 4.1% see depreciation expense forecast development General and administrative expenses $801.2 914.0 821.4 821.4 821.4 821.4 821.4 6.0% 6.0% 5.3% 5.3% 5.3% 5.3% 5.3% Restructuring Charges $0.0 0.0 0.0 0.0 0.0 0.0 0.0 assumption about future restructuring 0.0% Gain on sale of properties $0.0 0.0 0.0 0.0 0.0 0.0 0.0 assumption about futue property sales 0.0% 0.0% 1.4% 1.4% 1.4% 1.4% 1.4% Income from equity investees $210.7 247.9 3.6 0.0 0.0 0.0 0.0
- 35. return on equity investments 50.6% 50.6% 1.4% 1.4% 1.4% 1.4% 1.4% Operating income $1,997.4 $2,389.4 $1,802.2 $1,700.9 $1,600.2 $2,022.7 $2,026.8 implied margins 15.0% 15.7% 11.7% 11.0% 10.4% 13.1% 13.1% Interest income and other, net $94.4 100.1 interest rate on financial assets plus gift card breakage 11.1% 11.1% 11.1% 11.1% 11.1% 11.1% Interest expense ($32.7) (33.0) (27.3) (0.0) (0.0) 0.0 0.0 interest rate on financial liabilities 6.0% 6.0% 6.0% 6.0% 6.0% 6.0% 6.0% Earnings before income taxes $2,059.1 $2,456.5 $1,775.0 $1,700.9 $1,600.2 $2,022.7 $2,026.8 Income taxes $674.4 810.6 effective tax rate assumption (10-K, p.26 mgt. provided) 32.8% 33.0% 33.0% 33.0% 33.0% 33.0% 33.0% Net earnings including noncontrolling interests $1,384.7 $1,645.8 $1,775.0 $1,700.9 $1,600.2 $2,022.7 $2,026.8 Net earnings attributable to noncontrolling interests $0.9 1.0 grow with sales 14.1% 1.8% 0.0% 0.0% 0.0% 0.0% Net earnings attributable to Starbucks $1,383.8 $1,644.8 $1,775.0 $1,700.9 $1,600.2 $2,022.7 $2,026.8 implied margins $0.1 10.8% 11.5% 11.0% 10.4% 13.1% 13.1% implied growth 18.9% 7.9% -4.2% -5.9% 26.4% 0.2%
- 36. Starbucks: Balance Sheet Forecasts (Thousands) Actual Forecasts ASSETS 2012 2013 2014 2015 2016 2017 2018 Current assets: Cash and cash equivalents $1,188.6 1305.4 410.4 414.7 402.0 402.0 402.0 days sales in cash 30.0 9.7 9.8 9.5 9.5 9.5 Short-term investments available-for-sale securities $848.4 955.2 percentage of total assets 10.3% 10.3% 10.3% 10.3% 10.3% 10.3% 10.3% Short-term investments trading securities $0.0 0.0 percentage of total assets 0.0% 0.8% 0.9% 0.9% 0.9% 0.9% 0.9% Accounts receivable, net $485.9 594.8 327.6 594.8 327.6 594.8 327.6 turnover assumption (in days) 12.0 13.0 10.9 10.9 10.9 10.9 10.9 Inventories $1,241.5 1276.1 turnover assumption (in days) 69.3 69.3 50.0 50.0 50.0 50.0 50.0 Prepaid expenses and other current assets $196.5 222.6 percentage of total assets 2.4% 2.4% 2.4% 2.4% 2.4% 2.4% 2.4% Deferred income taxes, net $238.7 268.9 percentage of total assets 2.9% 2.9% 2.9% 2.9% 2.9% 2.9% 2.9% Total current assets $4,199.6 $4,622.9 $738.0 $1,009.5 $729.5 $996.8 $729.5 Long-term investments available-for-sale securities $116.0 129.8 percentage of total assets 1.4% 1.4% 1.4% 1.4% 1.4% 1.4% 1.4% Equity and cost investments $459.9 519.3 percentage of total assets 5.6% 5.6% 5.6% 5.6% 5.6% 5.6% 5.6% Property, plant and equipment, gross $6,903.1 8103.1 Accumulated Depreciation ($4,244.2) -4991.9 Property and Equipment, Net $2,658.9 3111.2 0.0 0.0 0.0 0.0 0.0 see property, plant and equipment forecast development Other assets $385.7 435.9 percentage of total assets 4.7% 4.7% 4.7% 4.7% 4.7% 4.7% 4.7%
- 37. Other intangible assets $0.0 0.0 percentage of total assets 0.0% 1.1% 1.1% 1.1% 1.1% 1.1% 1.1% Goodwill $399.1 454.4 percentage of total assets 4.9% 4.9% 4.9% 4.9% 4.9% 4.9% 4.9% TOTAL ASSETS $8,219.2 $9,273.5 $738.0 $1,009.5 $729.5 $996.8 $729.5 LIABILITIES AND SHAREHOLDERS EQUITY Current liabilities: Accounts payable $398.1 628.1 turnover assumption (in days) 28.1 28.1 28.1 28.1 28.1 28.1 Accrued compensation and related costs $381.6 408.0 % of total assets 4.4% 1.8% 0.0% 0.0% 0.0% 0.0% Accrued occupancy costs $126.9 131.8 grow with company stores 3.8% 0.0% 0.0% 0.0% 0.0% 0.0% Accrued taxes $138.3 306.0 percentage of total assets 3.3% 3.3% -100.0% #DIV/0! #DIV/0! #DIV/0! #DIV/0! Insurance reserves $167.7 191.3 grow with g&a expense 14.1% -10.1% 0.0% 0.0% 0.0% 0.0% Other accrued liabilities $487.0 505.6 grow with company stores 3.8% -10.1% 0.0% 0.0% 0.0% 0.0% Deferred revenue $510.2 582.0 grow with sales 14.1% 1.8% 0.0% 0.0% 0.0% 0.0% Current portion of long-term debt $0.0 0.0 0.3 0.1 long term debt footnote Footnote 10 Total current liabilities $2,209.8 $2,752.8 $0.3 $0.1 $0.0 $0.0 $0.0 Long-term debt $549.6 549.6 long term debt footnote Footnote 10 Other long-term liabilities $345.3 358.5 grow with company stores 3.8% -10.1% 0.0% 0.0% 0.0% 0.0% Total liabilities $3,104.7 $3,661.0 $0.3 $0.1 $0.0 $0.0 $0.0 Shareholders equity: Common stock $0.7 0.7 0.7 0.7 0.7 0.7 0.7 assumption about new issues and buybacks
- 38. Additional paid-in-capital $39.4 39.4 39.4 39.4 39.4 39.4 39.4 assumption about new issues and buybacks Retained earnings $5,046.2 5544.22 add net income and subtract dividends Accumulated other comprehensive income $22.7 22.7 22.7 22.7 22.7 22.7 22.7 constant changes in accumulated other comprehensive income from income statement Noncontrolling Interests $5.5 5.5 5.5 5.5 5.5 5.5 5.5 constant Total shareholders equity $5,114.5 $5,612.5 $68.3 $68.3 $68.3 $68.3 $68.3 TOTAL LIABILITIES AND SHAREHOLDERS EQUITY $8,219.2 $9,273.5 $68.6 $68.4 $68.3 $68.3 $68.3 implied debt/equity ratios 0.652 0.004 0.001 0.000 0.000 0.000 check: balance sheet balance? 0.0 669.4 941.1 661.2 928.5 661.2 Balance Sheet Plug Calculations: Assets- Total Liabilities - Common Stock - Other additional paid-in-capital-Oth comp inc.-BEG R.E. - Net Income Account Plugged: treasury stock =+B124+C51+C140 Normal dividend payout rate: 0% 0% 0% 0% 0% 0% Normal dividend payout forecast: 513.0 0.0 0.0 0.0 0.0 0.0 Plug: -633.8 0.0 0.0 0.0 0.0 0.0 Total implied dividends: 1146.8 0.0 0.0 0.0 0.0 0.0
- 39. STARBUCKS: Implied Statement of Cash Flows Forecasts Forecasts Implied Cash Flows: 2012 2013 2014 2015 2016 2017 2018 Operations: Net income $1,383.8 1,644.8 Depreciation and amortization 580.6 747.7 Accounts receivable (99.40) (108.9) Inventories (275.70) (34.6) Prepaid expenses (35.00) (26.1) Deferred income taxes, net (8.30) (30.2) Accounts payable (141.90) 230.0 Accrued compensation 17.20 26.4 Accrued occupancy costs (21.40) 4.9 Accrued taxes 29.10 167.7 Insurance Reserves 22.10 23.6 Other accrued expenses 168.00 18.6 Deferred revenue 60.90 71.8 Net Cash provided (used) by operating activities $1,680.00 $2,735.80 Investing: Short-term investments 54.20 (106.8) Long-term investments (9.00) (13.8) Equity and other investments (87.60) (59.4) Capital Expenditures (884.50) (1,200.0) Changes in other assets (88.00) (50.2) Changes in intangibles and goodwill 34.40 (55.3) Net Cash provided (used) by investing activities ($980.50) ($1,485.47) Financing: Changes in long-term debt 0.10 - Other long-term liabilities (2.50) 13.2 Changes in common stock (1.10) -
- 40. Change in Accumulated Other Comprehensive Income (23.60) Changes in noncontrolling interests 3.10 - Implied dividends paid (635.00) (1,146.8) Net Cash provided (used) by financing activities ($659.00) ($1,133.57) Net cash flow $40.50 $116.76 ($653.53) Beginning balance 1148.10 $1,188.6 $281.0 Ending balance 1188.60 1305.4 281.0 check: 0.0 0.0 -653.5 0.0 0.0 0.0 0.0
- 41. Terminal Growth Factor 1.03 Terminal 2019 2020 2021 2022 2023 11,732.9 11,732.9 11,732.9 11,732.9 12,084.9 1,565.3 1,565.3 1,565.3 1,565.3 1,612.3 2,145.5 2,145.5 2,145.5 2,145.5 2,209.9 $15,443.7 $15,443.7 $15,443.7 $15,443.7 $15,907.0 0.0% 0.0% 0.0% 0.0% 3.0% 6430.8 6430.8 6430.8 6430.8 6623.7 41.6% 41.6% 41.6% 41.6% $9,012.9 $9,012.9 $9,012.9 $9,012.9 $9,283.3 58.4% 58.4% 58.4% 58.4% 58.4% 5127.3 5127.3 5127.3 5127.3 5281.1 33.2% 33.2% 33.2% 33.2% 422.9 422.9 422.9 422.9 435.6 2.7% 2.7% 2.7% 2.7% 724.5 837.8 954.5 1074.7 1106.9 821.4 821.4 821.4 821.4 846.1 5.3% 5.3% 5.3% 5.3% 0.0 0.0 0.0 0.0 0.0 0.0 0.0 0.0 0.0 0.0 1.4% 1.4% 1.4% 1.4% 0.0 0.0 0.0 0.0 0.0
- 42. 1.4% 1.4% 1.4% 1.4% $1,916.8 $1,803.5 $1,686.8 $1,566.6 $1,613.6 12.4% 11.7% 10.9% 10.1% 10.1% 0.0 11.1% 11.1% 11.1% 11.1% 0.0 0.0 0.0 0.0 0.0 6.0% 6.0% 6.0% 6.0% $1,916.8 $1,803.5 $1,686.8 $1,566.6 $1,613.6 33.0% 33.0% 33.0% 33.0% $1,916.8 $1,803.5 $1,686.8 $1,566.6 $1,613.6 0.0% 0.0% 0.0% 0.0% $1,916.8 $1,803.5 $1,686.8 $1,566.6 $1,613.6 12.4% 11.7% 10.9% 10.1% -5.4% -5.9% -6.5% -7.1% 3.0%
- 43. Terminal Growth Factor 1.03 Terminal 2019 2020 2021 2022 2023 402.0 402.0 402.0 402.0 414.0 9.5 9.5 9.5 9.5 0.0 10.3% 10.3% 10.3% 10.3% 0.0 0.9% 0.9% 0.9% 0.9% 594.8 327.6 594.8 327.6 337.4 10.9 10.9 10.9 10.9 0.0 50.0 50.0 50.0 50.0 0.0 2.4% 2.4% 2.4% 2.4% 0.0 2.9% 2.9% 2.9% 2.9% $996.8 $729.5 $996.8 $729.5 $751.4 1.4% 1.4% 1.4% 1.4% 5.6% 5.6% 5.6% 5.6% 0.0 0.0 0.0 0.0 0.0 4.7% 4.7% 4.7% 4.7%
- 44. 1.1% 1.1% 1.1% 1.1% 4.9% 4.9% 4.9% 4.9% $996.8 $729.5 $996.8 $729.5 $751.4 28.1 28.1 28.1 28.1 0.0% 0.0% 0.0% 0.0% 0.0% 0.0% 0.0% 0.0% #DIV/0! #DIV/0! #DIV/0! #DIV/0! 0.0% 0.0% 0.0% 0.0% 0.0% 0.0% 0.0% 0.0% 0.0% 0.0% 0.0% 0.0% $0.0 $0.0 $0.0 $0.0 $0.0 0.0% 0.0% 0.0% 0.0% $0.0 $0.0 $0.0 $0.0 $0.0 0.7 0.7 0.7 0.7
- 45. 39.4 39.4 39.4 39.4 22.7 22.7 22.7 22.7 5.5 5.5 5.5 5.5 $68.3 $68.3 $68.3 $68.3 $0.0 $68.3 $68.3 $68.3 $68.3 $0.0 0.000 0.000 0.000 0.000 #DIV/0! 928.5 661.2 928.5 661.2 751.4 h comp inc.-BEG R.E. - Net Income 0% 0% 0% 0% 0% 0.0 0.0 0.0 0.0 0.0 0.0 0.0 0.0 0.0 0.0 0.0 0.0 0.0 0.0 0.0
- 46. Terminal 2019 2020 2021 2022 2023
- 47. 0.0 0.0 0.0 0.0 0.0
- 48. Abarbanell and Bushee signals Inventory Signal 2009 2010 2011 2012 Results from Sales 8180.10 8963.50 9632.40 10534.50 prior 2 yr avg 10078.8 8571.8 9297.95 10083.45 % Change -0.188 0.046 0.036 0.045 Inventory 664.90 543.30 965.80 1,241.50 prior 2 yr avg 678.85 604.1 754.55 1103.65 % Change -0.021 -0.101 0.280 0.125 Factors (0.17) 0.15 (0.24) (0.08) ΔEPS INV Accounts Receivable Signal AR 2009 2010 2011 2012 CAPX Sales 8180.10 8963.50 9632.40 10534.50 GM prior 2 yr avg 10078.8 8571.8 9297.95 10083.45 S&A % Change -0.188 0.046 0.036 0.045 ETR Acct.Rec. 271.00 302.70 386.50 485.90 EQ prior 2 yr avg 300.25 286.85 344.6 436.2 AQ % Change -0.097 0.055 0.122 0.114 LF (0.09) (0.01) (0.09) (0.07) Capital Expenditures 2009 2010 2011 2012 Capex 445.60 440.70 531.90 856.20 prior 2 yr avg 715.05 443.15 486.3 694.05 % Change -0.377 -0.006 0.094 0.234 Ind capex prior 2 yr avg % Change #DIV/0! #DIV/0! #DIV/0! #DIV/0!
- 49. #DIV/0! #DIV/0! #DIV/0! #DIV/0! Gross Margin Signal 2009 2010 2011 2012 GM 5449.70 6248.80 6751.10 7486.20 prior 2 yr avg 5593.7 5849.25 6499.95 7118.65 % Change -0.026 0.068 0.039 0.052 Sales 8180.10 8963.50 9632.40 10534.50 prior 2 yr avg 10078.8 8571.8 9297.95 10083.45 % Change -0.188 0.046 0.036 0.045 0.16 0.02 0.00 0.01 Selling and Administrative Signal 2009 2010 2011 2012 Sales 8180.10 8963.50 9632.40 10534.50 prior 2 yr avg 10078.8 8571.8 9297.95 10083.45 % Change -0.188 0.046 0.036 0.045 S&A 453.00 569.50 636.10 801.20 prior 2 yr avg 454.5 511.25 602.8 718.65 % Change -0.003 0.114 0.055 0.115 (0.19) (0.07) (0.02) (0.07)
- 50. Results from Abarbanell and Bushee papers (1997 and 1998) Observed Relation with: Next Year Long Term Analysts' Analysts' Earnings Earnings Forecast Forecast Factors Change Growth Revisions Revisions ΔEPS + 0 + 0 + 0 + + - 0 0 0 CAPX - - - 0 + 0 0 + 0 0 + + + + + - 0 + 0 + 0 0 0 0 + + + +
- 51. Current Future Stock Stock Returns Returns + na + + 0 0 0 - + + + + + 0 0 0 0 0 0 0
- 52. Starbucks Year: 2008 2009 2010 2011 2012 Accounts Receivable 330 271 303 387 486 Current Assets 1,748 2,036 2,756 3,795 4,200 PPE, net 2,956 2,536 2,417 2,355 2,659 Total Assets 5,673 5,577 6,386 7,360 8,219 Current Liabilities 1,477 1,581 1,779 2,076 2,210 Long-term Debt 550 549 549 550 550 Sales 10,383 9,775 10,707 11,700 13,300 COGS 4,645 4,325 4,459 4,949 5,813 SGA 456 453 570 636 801 Income from Continuing Operations 504 562 1,419 1,729 1,997 Cash Flow from Operations 1,251 1,389 1,705 1,612 1,750 Depreciation Expense 605 563 541 550 581 DSRI 0.874 1.020 1.168 1.106 GMI 0.991 0.955 1.011 1.025 AQI 1.055 1.054 0.866 1.007 SGI 0.941 1.095 1.093 1.137 DEPI 0.934 0.994 0.966 1.056 SGAI 1.055 1.148 1.022 1.108 LEVI 1.069 0.955 0.978 0.941 TATA -0.148 -0.045 0.016 0.030 -3.363 -2.598 -2.217 -2.097 0.0% 0.5% 1.3% 1.8% Y = -4.840 + .920(DSRI) + .528(GMI) + .404(AQI) +.892(SGI) + .115(DEPI) - .172(SAI) - .3 -4.840 -4.840 -4.840 -4.840 -4.840 0.920 0.804 0.938 1.075 1.018 0.528 0.523 0.504 0.534 0.541 0.404 0.426 0.426 0.350 0.407 0.892 0.840 0.977 0.975 1.014 0.115 0.107 0.114 0.111 0.121 -0.172 -0.182 -0.197 -0.176 -0.191 -0.327 -0.350 -0.312 -0.320 -0.308 4.670 -0.693 -0.209 0.074 0.140 -3.363 -2.598 -2.217 -2.097
- 53. Days Sales in Receivables Index (AR/Sales)t / (AR/Sales)t-1 Gross Margin Index (GM/Sales)t-1 / (GM/Sales)t Asset Quality Index 1- [(CA+PPE)/TA] t / 1- [(CA+PPE)/TA] t-1 Sales Growth Index Salest / Sales t-1 Depreciation Index [Dep / (Dep + PPE) t-1] / [Dep / (Dep + PPE)t ] Selling and Admin. Expense Index (SGA/Sales)t / (SGA/Sales)t-1 Leverage Index [(LTD + CL) / TA)] t / [(LTD + CL) / TA)] t-1 Total Accruals to Total Assets (NI – CFO) / TA 115(DEPI) - .172(SAI) - .327(LVGI) + 4.670(TATA)
- 54. Sales Forecast % # estimate 1 60 1 0.04762 estimate 2 40 17 0.80952 estimate 3 20 3 0.14286 total 21 38.10
- 55. weighted average