Transcript: #StandardsGoals for 2024: What’s new for BISAC - Tech Forum 2024
A NON LINEAR MODEL OF THE NEW ECONOMIC GEOGRAPHY
1. A NON LINEAR MODEL OF THE NEW ECONOMIC GEOGRAPHY
FOR PORTUGAL
Vitor João Pereira Domingues Martinho
Unidade de I&D do Instituto Politécnico de Viseu
Av. Cor. José Maria Vale de Andrade
Campus Politécnico
3504 - 510 Viseu
(PORTUGAL)
e-mail: vdmartinho@esav.ipv.pt
ABSTRACT
With this work we try to present a non linear model for Portugal based on the new economic geography.
We built the model taking into account an analyse about the agglomeration process in Portugal, using the New
Economic Geography models, in a non linear way . In a non linear way, of referring, as summary conclusion, that
with this work the existence of increasing returns to scale and low transport cost, in the Portuguese regions, was
proven and, because this, the existence of agglomeration in Portugal
Keywords: new economic geography; non linear models; Portuguese regions.
1. INTRODUCTION
To built the model, we mainly aimed to analyze the process of agglomeration across regions (NUTS II) of
Portugal, using non linear models of New Economic Geography, in particular, developments considered by
(1)Krugman (1991), (2)Thomas (1997), (3)Hanson (1998) and (4)Fujita et al. (2000). We will also try to compare
the results obtained by the empirical models developed by each of these authors ((5)Martinho, 2011a).
In a theoretical context, it is intended to explain the complementarily of clustering models, associated
with the New Economic Geography, and polarization associated with the Keynesian tradition ((6)Martinho,
2011b).
2. THE BASE NON LINEAR MODEL
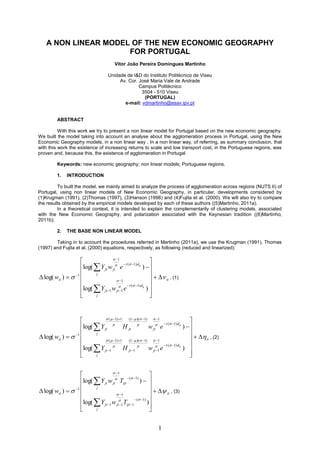
Taking in to account the procedures referred in Martinho (2011a), we use the Krugman (1991), Thomas
(1997) and Fujita et al. (2000) equations, respectively, as following (reduced and linearized):
1
log( Y jt w jt e
( 1) d ij
)
log( wit ) 1 it , (1)
j
1
log( Y w e ( 1) dij )
jt 1 jt 1
j
( 1) 1 (1 )( 1) 1
log( Y jt
( 1) d ij
H jt w jt e )
log( wit ) 1 it , (2)
j
( 1) 1 (1 )( 1) 1
log( Y H w e ( 1) dij )
jt 1 jt 1 jt 1
j
1
log( Y jt w jt Tijt
( 1)
)
log( wit ) 1 it , (3)
j
1
log( Y w T ( 1) )
jt 1 jt 1 ijt 1
j
1
2. In these equations, Yi is the income in region i, wi the wage in region i and dij is the distance between
each pair of locations. Hi the supply of housing in the region i and Tij transport costs between regions i and j. The
parameters to be estimated, these models are the elasticity of substitution between manufactured goods,
the share of expenditure on manufactured goods and the transport costs to send a unit of manufactured goods
in a unit distance. i , and are error terms.
i i
3. THE NON LINEAR MODEL
Analysis of the results, obtained in the estimations, it appears that these are slightly different for the
reduced equations of the three models considered, with the estimates made with the equation of the Thomas
model present statistically better results. Possibly because it is an equation to work harder and thus beyond the
centripetal forces of agglomeration, consider also the centrifugal forces of anti-agglomeration by immobile factors.
Anyway, the results obtained with the estimates of the three equations confirm some importance, but small, of the
transport costs, given the low values of the parameter . Looking at the increasing returns to scale, calculating,
as noted, the value /( 1) , it appears that this is always greater than one, reflecting the fact that there were
increasing returns in the Portuguese regions in this period. It should be noted also that the parameter values
are unreasonably high in all three estimations, however, as stated there is a tendency for these values that fall
around the unit in most empirical work.
4. THE DATA USED
Considering the variables of the model presented previously, and the availability of statistical information,
we used the following data at regional level: temporal data from 1987 to 1994 for the five regions (NUTS II) in
mainland Portugal and for the various manufacturing industries existing in these regions, from the regional
database of Eurostat statistics (Eurostat Regio of Statistics 2000).
5. CONCLUSIONS
In light of what has been said above, we can conclude, with the non linear models, the existence of
agglomeration processes in Portugal (around Lisboa e Vale do Tejo) in the period 1987 to 1994, given the low
transport costs, what was shown by the /( 1) and the (1 ) values obtained in the estimations made
with the reduced forms of the models presented above. On other hand, there are increasing returns to scale in
manufacturing in the Portuguese regions.
Finally, is important to refer the importance of the transportation costs in explaining the spatial issues,
reinforced by the fact that the estimates made with the seven NUTS II Portugal (including Madeira and Açores)
present values much worse than when considering only the five NUTS II. What makes sense, since the real wage
developments do not follow the increase in transport costs from the continent for these two Portuguese islands.
6. REFERENCES
1. P. Krugman. Increasing Returns and Economic Geography. Journal of Political Economy, 99, 483-499 (1991).
2. A. Thomas. Increasing Returns, Congestion Costs and the Geographic Concentration of Firms. Mimeo,
International Monetary Fund, 1997.
3. G. Hanson. Market Potential, Increasing Returns, and Geographic concentration. Working Paper, NBER,
Cambridge, 1998.
4. M. Fujita; P. Krugman and J.A. Venables. The Spatial Economy: Cities, Regions, and International Trade. MIT
Press, Cambridge, 2000.
5. V.J.P.D. Martinho. The importance of increasing returns to scale in the process of agglomeration in Portugal: A
non linear empirical analysis. MPRA Paper 32204, University Library of Munich, Germany (2011a).
6. V.J.P.D. Martinho. Regional agglomeration in Portugal: a linear analysis. MPRA Paper 32337, University
Library of Munich, Germany (2011b).
7. A. Marshall. Principles of Economics. Macmillan, London 1920.
2