The document summarizes a study examining experiences of stigma among low-income public insurance beneficiaries in Michigan. Key findings include:
1) Participants reported experiencing stigma in healthcare settings through poor quality care and negative interactions with providers, which they attributed to their public insurance status.
2) The stigma of public insurance was compounded by other sources of stigma such as socioeconomic status, race, gender, and illness, highlighting how multiple forms of stigma can intersect.
3) Experiences of stigma had consequences for how participants evaluated care quality, continuity of care, and ability to access healthcare.
ORIGINAL PAPER‘‘They Treat you a Different Way’’ Public I.docx
1. ORIGINAL PAPER
‘‘They Treat you a Different Way:’’ Public Insurance,
Stigma, and the Challenge to Quality Health Care
Anna C. Martinez-Hume1 • Allison M. Baker2 •
Hannah S. Bell
1
• Isabel Montemayor
3
•
Kristan Elwell4 • Linda M. Hunt1
Published online: 26 December 2016
� Springer Science+Business Media New York 2016
Abstract Under the Affordable Care Act, Medicaid Expansion
programs are
extending Medicaid eligibility and increasing access to care.
However, stigma
associated with public insurance coverage may importantly
affect the nature and
content of the health care beneficiaries receive. In this paper,
we examine the health
2. care stigma experiences described by a group of low-income
public insurance
beneficiaries. They perceive stigma as manifest in poor quality
care and negative
interpersonal interactions in the health care setting. Using an
intersectional
approach, we found that the stigma of public insurance was
compounded with other
sources of stigma including socioeconomic status, race, gender,
and illness status.
Experiences of stigma had important implications for how
subjects evaluated the
quality of care, their decisions impacting continuity of care, and
their reported
ability to access health care. We argue that stigma challenges
the quality of care
provided under public insurance and is thus a public health
issue that should be
addressed in Medicaid policy.
Keywords Stigma � Insurance � Poverty � Healthcare �
Medicaid �
Intersectionality
& Linda M. Hunt
[email protected]
1
3. Department of Anthropology, Michigan State University, 355
Baker Hall, 655 Auditorium
Drive, East Lansing, MI 48824, USA
2
Harvard T.H. Chan School of Public Health, Harvard
University, 677 Huntington Avenue,
Boston, MA 02115, USA
3
Department of Sociology and Anthropology, University of
Texas at Arlington, 430 University
Hall, 601 S. Nedderman Drive, Arlington, TX 76019, USA
4
Center for Health Equity Research, Northern Arizona
University, 1100 S. Beaver St., Flagstaff,
AZ 86011, USA
123
Cult Med Psychiatry (2017) 41:161–180
DOI 10.1007/s11013-016-9513-8
http://orcid.org/0000-0002-1214-8569
http://crossmark.crossref.org/dialog/?doi=10.1007/s11013-016-
9513-8&domain=pdf
http://crossmark.crossref.org/dialog/?doi=10.1007/s11013-016-
9513-8&domain=pdf
4. Introduction
A key feature of the Affordable Care Act is Medicaid
Expansion, which extends
Medicaid eligibility to many low-income adults with the goal of
improving health
equity through increased access to care. While addressing an
urgent public health
need, issues within the social context of public insurance may
diminish the success
of such programs in effectively addressing health disparities.
One such concern is
stigma associated with public insurance coverage, including
Medicaid and other
state-sponsored programs for the low-income, which may
meaningfully affect the
nature and content of health care.
Stigma—the negative experience of stereotyping, labeling,
exclusion and
discrimination due to some personal attribute—is commonly
reported by individuals
using Medicaid and other state-sponsored health plans (Allen et
al. 2014; Horton
et al. 2014; Stuber and Kronebusch 2004; Wagenfeld-Heintz,
Ross, and Lee 2007).
5. Being stigmatized in the health care setting, specifically, due to
public insurance
status may have important impacts extending beyond just bad
feelings; it may result
in increased disparities in health care. In this paper, we examine
the experiences of
stigma in health care described by a group of low-income
individuals eligible for
Medicaid in Michigan. We discuss the types of stigma
experienced by these
individuals when using public insurance,
1
and the influence of such stigma on their
health-seeking behaviors. Based on these case examples, we
consider how stigma
associated with public insurance may combine with other types
of stigma to impact
the quality and continuity of care for those using Medicaid and
other public
insurance programs. Finally, we argue that to promote the
health equity goals of the
Affordable Care Act, health policy should be developed to
address the multiple
interactive factors that induce stigma and its impacts on health
6. care.
Public Health Insurance in Michigan
Medicaid has been the main form of health insurance for low-
income Americans
since its inception in 1965; providing coverage to pregnant
women, children, the
blind and disabled, and the elderly, depending on income.
Federal laws have long
excluded most adults without dependent children from Medicaid
coverage, leaving
large numbers of adults uninsured. (Kaeser Family Foundation
2013).
Beginning in the late 1990s, Michigan, like many other states,
instituted
community health plans managed by county governments, to
help provide access to
health care for those not eligible for Medicaid. The Ingham
Health Plan (IHP)
provides an example of one such plan. Michigan regulations
require health
insurance plans to provide a minimum set of benefits. In order
to maximize the
number of people to be covered, the IHP was expressly designed
not as a health
7. insurance plan, but rather as a program with a limited set of
‘‘medical benefits,’’
1
We define ‘‘Public insurance’’ as Medicaid and other
government funded healthcare plans, such as
county funded health plans available to low-income individuals.
Medicare, which is not means-tested, is
not included in this definition.
162 Cult Med Psychiatry (2017) 41:161–180
123
providing access to primary care services and some
medications. (Rovin et al. 2012;
Silow-Carroll et al. 2001).
Despite the large numbers of Michigan residents being left
uninsured and
underinsured by these programs, the state legislature, dominated
by conservative
politicians, was reluctant to pursue Medicaid expansion as
called for by the ACA.
After much contentious debate, the Michigan legislature passed
a bill expanding
8. Medicaid under a Section 1115 Waiver, amending the usual
Medicaid regulations to
add personal responsibility requirements in the form of cost-
sharing and financial
incentives for healthy behaviors. These added features of the
Healthy Michigan Plan
(HMP) are designed to assure that recipients have ‘‘skin-in-the-
game,’’ and take
responsibility for their lifestyle choices (Baker and Hunt 2016).
While at its inception, it had been anticipated that about
400,000 people would be
covered under HMP (Ayanian et al. 1993), more than 600,000
people had enrolled
in the plan in the first year (MDHHS 2016). The study we report
here draws on data
collected just as HMP was beginning to enroll beneficiaries.
The experiences of
stigma they report in using public insurance, therefore, refer to
standard Medicaid,
IHP, and similar plans that pre-dated Michigan’s Medicaid
expansion under the
ACA.
Stigma and Its Implications for Health Disparities
9. How experiences of stigma may impact those subject to its
influence has long been
of concern to social scientists and health researchers. Stigma is
manifest through
processes of exclusion, rejection, or blame. Goffman (1963)
notes that stigma is a
product of power differentials in an interpersonal relationship
that is ‘‘deeply
discrediting’’ to an individual’s social identity. In the health
care setting,
interpersonal stigma originates from the in-group (i.e., health
care providers),
who have the power to stigmatize and exclude others (i.e.,
patients) (Mason-
Whitehead and Mason 2007) and can stem from the provider’s
assumptions about
the patient’s personal attributes (Weiss and Ramakrishna 2006).
It has been widely demonstrated that sources of stigma affecting
health care
experiences may include race, class, gender, and illness-status
(Bird and Bogart
2000; Drury, Aramburu, and Louis 2002; Earnshaw and Quinn
2011; Franks,
Fiscella, and Meldrum 2005; Henderson, Stacey, and Dohan
10. 2008; Kinsler et al.
2007; Reutter et al. 2009; Stuber and Schlesinger 2006). Stigma
associated with
such personal attributes has been shown to have real and serious
consequences for
health status. For example, studies show that health care stigma
is associated with
underutilized care, infrequent routine check-ups, delaying care,
forgoing needed
tests, illness progression, and lower quality of life (Becker and
Newsom 2003;
Drury, Aramburu, and Louis 2002; Earnshaw and Quinn 2011;
Nadeem et al. 2007;
Sayles et al. 2009; Young and Bendavid 2010).
Additionally, studies have documented that stigmatization may
be based on
having public insurance or being uninsured. Patients with public
insurance report
feeling ignored, disrespected, or rushed, have difficulty
scheduling appointments,
and often face long wait times; which may lead them to have
low satisfaction with
Cult Med Psychiatry (2017) 41:161–180 163
11. 123
healthcare providers and staff, and to perceive public insurance
as providing
substandard care. As a result of these experiences some patients
with public
insurance miss follow up appointments, change health care
providers, and become
reluctant to access essential services (Allen et al. 2014; Becker
2004; Becker and
Newsom 2003; Piña 1998; Wagenfeld-Heintz, Ross, and Lee
2007).
Because racial and ethnic minorities are often over-represented
among the poor,
these groups are also over-represented among public insurance
beneficiaries (Kaeser
Family Foundation 2013). Ablon (1981) notes, groups who
experience stigma in
health care are likely to be individuals who enter into the health
care system as
already stigmatized patients. Becker and Newsom (2003)
reported that a majority of
the low-income African American participants in their study felt
racism impacted
12. the care they received, and Sayles et al. (2009) found that
stigma associated with an
HIV diagnosis negatively impacted patients’ treatment
experiences. In a large
survey, Weech-Maldonado et al. (2012) found that Medicaid
beneficiaries reported
experiencing racial and ethnic discrimination when receiving
care.
Stigma in healthcare for Medicaid and other public insurance
beneficiaries may
occur for a variety of reasons. DelVecchio Good et al. (2003)
write that the
‘‘medical gaze,’’ or the culture of medicine, may lead providers
to unknowingly
treat some patients differently than others. Medical providers
generally follow
regimented consultation protocols, often including structured
patient interviews
under strict time constraints. Low-income patients with complex
social problems
may disrupt the context of the provider’s expected clinical
encounters, and may be
interpreted as troublesome or non-compliant patients, (see also
Horton 2006).
13. Furthermore, providers are encouraged to treat minority patients
differently by
contemporary epidemiological and medical research which often
presumes racial
and ethnic groups share genetic, socio-economic and cultural
characteristics
(Acquaviva and Mintz 2010; Gaines 2005; Gravlee 2009; Nawaz
and Brett 2009;
Witzig 1996). Through their medical training, published
articles, and clinical
guidelines, clinicians are regularly instructed that race and
ethnicity are clinically
relevant, and they routinely embrace and act upon these notions
(Hunt and Kreiner
2013; Hunt and de Voogd 2005; Hunt, Truesdell, and Kreiner
2013). Thus,
differential treatment in healthcare is clearly the result of
multidimensional
processes, many of which are structural in nature.
Stigma in health care is associated with a variety of factors, and
it is well-known
to importantly affect the quality and content of care patients
receive. However, it is
14. essential to further recognize that, in the course of health
seeking, patients may be
impacted by not just one type of stigma, but by the combined
effect of the various
sources of stigma they face. This understanding of stigma is
grounded in
intersectionality theory, which recognizes that each individual’s
unique experience
of stigma and discrimination is the result of their social
positioning within a range of
attributes which may be sources of power and oppression
(Crenshaw 1989;
Crenshaw 1991; Davis 2008). In public health discourse, it is
increasingly
recognized that in order to understand health disparities, we
must consider how
various social conditions may interact to affect health care
access (Bowleg 2012;
Jackson and Williams 2006; Phelan, Link, and Tehranifar 2010).
164 Cult Med Psychiatry (2017) 41:161–180
123
Clearly, stigma may have important implications for the health
15. of public
insurance beneficiaries, affecting their ability and likelihood to
access high-quality
health care. Hatzenbuehler, Phelan, and Link (2013) argue that
stigma is a critical
influence on population health because of its persistent
association with health
inequities. Thus the issue of stigma merits closer scrutiny in
light of Medicaid
expansion. States that expanded Medicaid prior to the
Affordable Care Act saw an
increase in utilization of health care services and a general
improvement in
beneficiaries’ self-reported health status and access to health
care (Baicker et al.
2013; Van Der Wees, Zaslavsky, and Ayanian 2013).
Understanding how stigma
may contribute to historical patterns of late diagnoses, higher
mortality, and poorer
health outcomes for public insurance recipients, (Ayanian et al.
1993; Burstin et al.
1992; Kwok et al. 2010; Sorlie et al. 1994) may point to
strategies to address those
issues, and thereby maximize the positive effects of Medicaid
16. expansion. In this
paper we examine specific ways insurance status may impact
health care
experiences, how other stigmatized patient characteristics may
amplify those
experiences, and how the combined effects of these sources of
stigma may impact
the quality of health care. We present a series of case examples
illustrating how
stigma has impacted health-seeking experiences and perceived
quality of care
among a group of Medicaid-eligible adults.
The Study
As part of a study examining the experiences and concerns of
people targeted by
Michigan’s Medicaid expansion program, the HMP, we
conducted interviews with a
group of low-income individuals in Mid-Michigan. We recruited
participants
through community organizations and gathering places, such as
farmers markets,
health fairs and food banks, and through snowball sampling.
Individuals were
17. eligible to participate if they met the main criteria for HMP:
being between 19 and
64 years of age with income less than or equal to 138% of the
federal poverty level,
and not covered by private health insurance or Medicare. If
individuals expressed
interest we assessed their eligibility, obtained informed consent
and scheduled
interviews at participants’ homes or in public spaces. In-depth,
semi-structured
interviews lasted approximately 1 hour, were conducted in
English, and were audio
recorded and transcribed. Participants each received a $25 gift
card to a local
grocery store in appreciation for their time.
The study protocol was approved by the Institutional Review
Board of Michigan
State University. Interview questions explored participants’
general health concerns,
previous health care experiences, experiences with health
insurance and being
uninsured, and understandings and expectations about Medicaid
expansion. It
should be noted that our recruitment strategy allowed us to
18. sample a cross-section of
Medicaid-qualified individuals who had received care from a
wide variety of health
care providers and institutions, about which we did not collect
any specific
information.
Interview transcripts were checked for accuracy and then coded
using NVivo 10,
a qualitative data analysis program. Using a general inductive
approach, codes were
Cult Med Psychiatry (2017) 41:161–180 165
123
designed to capture overarching thematic responses including
health-seeking
experiences, behavioral strategies, and emotional responses,
such as frustration or
dissatisfaction. The research team met regularly to compare and
review coding
themes before finalizing a code book. Although not a central
focus of the project,
stigma emerged as a common theme in participant responses.
Comments coded for
19. ‘‘stigma’’ included all references to perceptions of and
experiences with stigma or
discrimination when accessing or receiving any health service,
treatment, or health
coverage. At later stages of analysis, we refined the stigma code
to include
descriptive subcodes, such as ‘‘experiential stigma’’ and
‘‘outcomes of experiential
stigma.’’ We conducted NVivo queries examining various
factors associated with
the stigma code.
Of 31 total participants, 21 were women and 10 were men.
About half were self-
identified white, a third African American, and the remainder
Hispanic. Their ages
ranged from 20 to 63 years, with most (65%) being under 40
years old. Most had
incomes that fell well below the federal poverty level, and
almost half (48%)
reported no income at all. Nearly all (81%) had health insurance
through some form
of Medicaid, and only a handful (13%) were uninsured at the
time of the interview.
20. Detailed demographic information for our sample is presented
in Table 1.
Those enrolled in Medicaid had the standard state plan which
pre-dated the ACA,
which used private insurers contracted by the state to provide
Medicaid coverage.
Our participants were enrolled in a variety of different plans
managed by these
private companies. At the time of the interviews, Michigan had
just begun enrolling
individuals into HMP: while 11 of our participants reported
having enrolled in HMP
none had yet begun using the plan.
Experiences of Stigma with Public Insurance
Participants reported encountering a range of experiences with
stigma as they
navigated the health care system, much of it related to insurance
status. When asked
if they felt public insurance status affects how health care
providers treat people,
three quarters (77%) said they thought it did, and more than half
(65%) said they
had either personally experienced such treatment or observed
others being treated
21. differently. As Lauren,
2
a 24-year-old white part-time nurse covered by Medicaid,
expressed:
I see it every day. I see different physicians treating Medicaid
people different
than if you came in with…something that’s actually paid for out
of your
pocket…Yeah, I feel strongly that Medicaid holders are treated
way
differently than if you came in with a paid insurance.
Participants’ stories about being treated differently focused on
two central stigma
themes: receiving poor quality care and experiencing negative
interpersonal
interactions.
2
To protect anonymity, all proper names in this paper are
pseudonyms.
166 Cult Med Psychiatry (2017) 41:161–180
123
Perceptions of Poor Quality Care
22. Participants described a variety of ways in which they felt they
had received lower
quality of care when using public insurance, as compared to
private insurance
holders. They told of being offered different prescriptions and
treatment options,
and of providers being rushed or reluctant to provide them
treatment at all. Jennifer,
a 50-year-old white woman who had been unemployed since
losing her job at a dry-
cleaners, shared this story about seeing a specialist at a
university based private
hospital for a back condition while she was unemployed and
covered by Medicaid:
I was sent to see if I was a candidate for back surgery…It was a
long drive,
and I get there and I’m expecting to see this specialist come in,
and he takes—
I don’t even know what kind of instrument it was—but he ran it
down the side
of my thigh and down my leg and turned around and walked out
of the room.
He didn’t say anything to me. And I’m sitting there like, ‘‘What
the hell?’’ I
really felt that if I had walked in there with Blue Cross Blue
23. Shield, I would
have had surgery.
Table 1 Interview participant demographics
N %
Participants 31
Sex
Female 21 68
Male 10 32
Age
18–29 12 39
30–39 8 26
40–49 3 10
50–59 6 19
60–64 2 6
Race/ethnicity
White 16 52
African American 10 32
Hispanic 5 16
24. Household income as % FPL
0 15 48
1–49 4 13
5–99 7 23
100–138 5 16
Current health coverage
Uninsured 4 13
County plan 2 6
Medicaid 25 81
Cult Med Psychiatry (2017) 41:161–180 167
123
While Jennifer’s encounter occurred in a private hospital, a
setting that may see
relatively fewer patients with public insurance, others reported
similar experiences
in health care settings like emergency rooms or health centers,
where public
insurance is common. Carrie, a 38-year-old white, unemployed
paralegal, described
25. the receptionists at a public hospital clinic she normally visits
for gynecological
appointments as quick and ‘‘rude.’’ She said, ‘‘I hate going to
the obstetrician there
or gynecologist…It’s like an assembly line…. there’s like 100
pregnant ladies. I
think oh, because we have Medicaid…’’’ Similarly, Destiny, a
25-year-old white
woman, recounted her experience taking her young son to a
clinic she called ‘‘the
welfare clinic.’’ Destiny attributed the rushed and poor quality
care her children
received to their having public insurance. She explained:
The wait was an hour long…and then they were very quick with
us, they
didn’t take their time to ask questions…It’s like they weren’t
patients, they
were just another number, you know, to get them out the door,
and the next
one in… [The doctor] just sent us on our way without even fully
understanding what the problem was… [My son] had a really
bad cold or
bronchitis and I told the doctor before he’s allergic to
amoxicillin, penicillin,
and he actually wrote him an amoxicillin script. It was in his
file. He didn’t
even read through his file.
26. Like Destiny, other participants felt that public insurance
beneficiaries are often
given little attention by health care personnel and not allotted
long enough
appointment times. Many participants also said they had
experienced very long wait
times in both public and private health care settings, which they
attributed to having
public insurance. Oftentimes the situation was made doubly
frustrating because the
long wait was followed by a rushed appointment. Ella, an
unemployed 48-year-old
African American woman who had just recently enrolled in
Medicaid after being
uninsured for three years, discussed her experience:
It was like, you may have an appointment, you could be the first
one to sign
up…but if somebody’s insurance might be better than yours,
they get better
service…Since they know that’s the type of insurance you get,
your
background like, you’re working [or] not, it has an effect on
how people act
towards you…It’s like, gosh, I’ll be the first one here, be the
last one coming
on out of here.
27. For Ella, public insurance represented more than just insurance
coverage. It
denoted other presumed social attributes, including her
‘‘background’’ and
employment status, which influenced the way health care
personnel treated her.
Teresa, a 57-year-old African American mother of five, was an
unemployed
computer repair specialist and uninsured at the time of the
interview. She recounted
having similar experiences when she was covered by public
insurance in the past:
[Health care providers] just think people that are on assistance
have all the
time in the world…I can remember having to wait for hours at
the doctor’s
office, where someone that came in and pulled out their Blue
Cross Blue
Shield card they got right in. I would have an appointment
also…and then they
168 Cult Med Psychiatry (2017) 41:161–180
123
28. would tell me, ‘Well she had to get back to work,’ and it was
like, ‘What
difference does it make? I was on time.’
Like Ella, Teresa felt her public insurance status is taken to be a
reflection of her
employment status—that she has time to wait and no job to get
back to. In their
experience, their public insurance status was conflated with
other socially
disempowering characteristics, intensifying the stigma they
encountered.
Thus far we have seen a variety of ways in which public
insurance beneficiaries
felt their insurance status caused them to receive poor quality
care. Participants
described long wait times, rude behavior, or rushed and
inattentive care in the health
care setting, which they attributed to their insurance status.
Some also felt that this
intensified the impact of other perceived and stigmatized social
attributes such as
being unemployed. In what follows, participants describe a
related concern: their
experiences with negative interpersonal interactions in the
29. health care setting.
Negative Interpersonal Interactions
Participants described a variety of negative interpersonal
interactions with health
care personnel or staff many of which they attributed to their
public insurance
status. These included shaming, mistreatment, being
disrespected or ignored, not
being believed, and being treated like they were unintelligent.
Kimberly, a 39-year-
old white woman who works in retail, remembered having such
encounters when
being treated for pain at an out-of-state hospital while covered
by Medicaid:
I couldn’t even move, and first of all they didn’t even want to
treat me. I was
in pain, crying, bent over, couldn’t move. He [the health care
provider] was
like, ‘just get up’ and just treated me like dirt…They didn’t run
no tests or
nothing, they just gave me some meds.
Kimberly’s treatment at the hospital exemplifies how patients
may interpret
negative interpersonal interactions with providers as inadequate
30. care. Similarly,
Shannon, a 31-year-old unemployed white woman covered by
Medicaid, described
negative interpersonal interactions she had experienced,
comparing her experiences
when using private insurance versus Medicaid:
When we had Blue Cross and Blue Shield, we were treated
much differently
even by the receptionist. People treat you differently. They look
at you
differently…It’s a stigma almost. I sometimes don’t want to
pull out my green
[Medicaid] card when I’m in the line at the pharmacy…the lady
in front of me
has a Blue Cross Blue Shield card and the way they talked to
her or interact
with her…is much different than when I roll up with my green
card and my
cardboard [Medicaid health plan] card. It’s ‘here, sign this,
birth date, co-pay,
have a great day.’
Shannon also told us that health care staff engaged in less
conversation with her
and treated her more curtly when she used Medicaid compared
to Blue Cross Blue
31. Shield, further reinforcing her sense of stigmatization when
using public insurance.
Cult Med Psychiatry (2017) 41:161–180 169
123
Other negative interpersonal interactions commonly described
by our participants
include being ignored, not being believed by health care
personnel, and being
treated like they were ‘‘dumb’’ or ‘‘stupid.’’ Melina, a 28-year-
old Hispanic
unemployed waitress, told us that she was ignored after going to
the hospital for an
emergency while covered by Medicaid. She said, ‘‘They don’t
pay attention to you
because they know you got this card, you know,
sometimes…they discriminate—
They treat you different than other persons that pay at the
hospital.’’ Jacquie, a
28-year-old African American who works as a home health aide,
expressed a similar
sentiment. Jacquie felt that due to her Medicaid coverage,
health care providers
treated her as if she were unintelligent:
32. Sometimes, maybe nurses or whatever will go out of their way
to explain
something that, to me, might be common sense. They’ll go
through your charts
and say, ‘Okay, this. Oh okay, Medicaid,’ and they’ll start
talking to you about
something stupid…I assume that they assume…if you have
regular insurance
or whatever, that you must have a job or something like that and
then they
don’t talk to you like you’re all dumb.
In these examples, we have seen that patients may feel medical
staff make
negative assumptions about them based on their public
insurance, and treat them
differently than they would be if they had private insurance.
Some study participants expressly noted feeling victim to
multiple sources of
stigma. They described providers’ negative assumptions
associated with insurance
status being amplified by other personal characteristics like
physical appearance,
race, class, and illness status. Crystal, for example, a 35-year-
old unemployed social
33. worker covered by IHP (the county health benefits plan),
described feeling
mistreated at a private, suburban clinic due to being a low-
income ‘‘young black
woman.’’ She said, ‘‘Most of the clientele there, they appeared
to be well-to-do.
They were white. And I noticed that the way the receptionist
would talk to me, you
know, she was kind of standoffish, didn’t even give me eye
contact.’’ This
participant, who has a master’s degree in sociology, described
the negative
assumptions the specialist seemed to make about her:
The way the doctor would ask questions to me—kind of like I
was dumb. You
know, the way he would talk to me? But when he heard the way
I talk and my
lingo, I shut that down. But the point was, his initial impression
of me
was…that maybe I wasn’t as intelligent or probably wasn’t
responsible. And
so, his conversation with me reflected that. But I noticed that
interactions with
other clients that came in were quite different.
34. Crystal compared this with her experiences at low-income
health care facilities,
saying she did not notice the same treatment in those settings.
She attributed this
particular discriminatory experience largely to her race and
low-income status,
highlighting that stigma can be compounded and exacerbated by
other sources of
disempowerment, discrimination and prejudice.
170 Cult Med Psychiatry (2017) 41:161–180
123
Health Implications of Stigma
As participants described their experiences with stigma, several
also discussed how
those experiences impacted their health-seeking behaviors,
causing them to
interrupt care, forgo treatment and doctor visits, or change
primary care providers.
Kelly’s story illustrates how experiencing stigma can interfere
with continuity of
care. Kelly is a 32-year-old white bartender who suffers from
35. Graves’ disease, a
chronic autoimmune condition of the thyroid. She was
uninsured for two years
before enrolling in Medicaid and was unemployed at the time of
the interview.
When asked if she thought people with public insurance were
treated differently
than others, Kelly told us ‘‘[it] depends on where you go’’,
noting that she never felt
mistreated at university based facilities. However, Kelly
strongly felt she was
treated poorly by health care providers at a public hospital
clinic because of her
Medicaid insurance, saying, ‘‘They didn’t listen! They just
didn’t listen, didn’t
care.’’ She felt that because providers wouldn’t listen to her,
she was given an
incorrect prescription, one that she already knew would
negatively affect her thyroid
condition. After receiving that prescription, she requested to be
seen by a different
doctor at the clinic. Instead, she was only permitted to see a
nurse practitioner. Kelly
said she got angry at being treated this way, and told us ‘‘I
36. don’t want to come back,
I don’t. I don’t ever want to come back again.’’
Similarly, Kimberly, the 39-year-old white retail worker we met
earlier,
experienced poor treatment which she felt was due to her being
covered by
Medicaid, resulting in her leaving her provider. She told us that
when she had a
miscarriage, her doctor declined to perform a dilation and
curettage procedure when
she requested it. She had to wait a long time before he finally
performed the
procedure, a period she described as ‘‘awful.’’ Kimberly
strongly felt the delay was
due to her Medicaid coverage status. After this experience, she
decided to no longer
use that doctor’s health system. Experiences like Kelly and
Kimberly’s were
commonly described by those we interviewed, and often
resulted in patients opting
to discontinue seeing their providers, disrupting their continuity
of care.
Perhaps the most disquieting account of disruption to care due
to stigma came
37. from Carrie, the 38-year-old unemployed paralegal. Carrie’s
HIV-positive status
and Medicaid coverage combine as sources for stigmatization in
her health care
encounters, negatively affecting her care. When asked if she
thought Medicaid
affects how she gets treated, she said that she has been treated
very rudely by
receptionists and clinical staff alike. She told us that she used to
have private, ‘‘good
insurance’’ and visited a specialist hospital clinic, noting that
‘‘it’s just a different
experience’’ compared to using Medicaid. When using her
current Medicaid
insurance, Carrie stated, ‘‘They just treat you differently, and
especially when you
have HIV, you get treated a whole bit differently.’’
Carrie described how one of her doctors put on two pairs of
gloves before
examining her, and she told us her medical records folder was
‘‘flagged’’ at the
dentist. Although such actions may be appropriate medical
precautions given her
38. health status, Carrie experienced this behavior as demeaning.
She further reiterated,
‘‘You get a lot of stigma in health care, especially if you have
[HIV],’’ adding that
Cult Med Psychiatry (2017) 41:161–180 171
123
this stigma makes her reluctant to go to the gynecologist. In
addition to feeling
mistreated by her doctors, Carrie also talked about enduring
long wait times due to
her insurance status. When asked if these experiences affected
her desire to go to the
doctor, she said, ‘‘Absolutely. I’m out of care—I’ve missed
three appointments for
my HIV doctor because I cannot stand sitting two hours in the
lobby…I have to go
to work.’’ Carrie’s care was further interrupted when a
particularly disturbing
incident prompted her to change her doctor:
My doctor asked me to swab myself one time when I was being
tested for
STDs… How the hell can you work in infectious disease and
you don’t want
39. to swab me? Like okay, I can do that. But how humiliating is
that? I’m
switching doctors…I just don’t want to go. I want to be able to
sit down and
talk to somebody about what’s going on with me because I’ve
been missing
medicine, and that’s serious. It’s a serious thing, and they’re so
callous to it.
As Carrie’s story so clearly illustrates, stigmatization can have
significant health
consequences for public insurance beneficiaries, particularly
those for whom other
personal attributes, such as illness-status or race, compound the
stigma experience.
An intersectionality approach suggests that health care stigma
experienced by
participants like Carrie emerges from multiple, interacting and
discredited social
positions beyond just a stigmatized insurance status.
For our participants, health care stigma towards their public
insurance status
combined with other sources of stigma to impact the quality of
health care they
received and their interpersonal interactions with providers,
which in turn had
40. significant implications for their health seeking. For some, such
experiences led
them to forgo much needed care or discontinue seeing their
health care providers,
which may have serious consequences for their health.
Discussion
In this paper we have examined the stigma experiences
described by a group of
public insurance beneficiaries in their efforts to access health
care. Participants quite
commonly felt stigmatized in being ignored, disrespected, and
not believed, being
given rushed and insufficient care, and being forced to wait well
past their
appointment times. We have also seen that the stigma associated
with public
insurance was compounded for many by stigma due to other
personal characteristics
such as class and race, resulting in intersectional stigma. This
sometimes had
important consequences for the health and health care of these
public insurance
beneficiaries.
41. Past research has found that stigma due to various personal
attributes, including
race/ethnicity, illness-status, socioeconomic status, and gender,
is a common
experience in the health care setting (Bird and Bogart 2000;
Drury, Aramburu, and
Louis 2002; Earnshaw and Quinn 2011; Kinsler et al. 2007;
Reutter et al. 2009;
Sayles et al. 2009; Stuber and Schlesinger 2006). Our findings
illustrate some
specific examples of how stigma based on public insurance
status may manifest in
clinical encounters and combine with other stigmatized
attributes, having an
172 Cult Med Psychiatry (2017) 41:161–180
123
important impact on health care. For example, Crystal’s
description of being spoken
to condescendingly as a woman who is low income, young, and
African American
reflects her experience of multiple sources of stigma including
her gender,
42. socioeconomic status, age, and race. Similarly, Carrie’s story
illustrates dual
stigmatization related to both her Medicaid coverage and her
HIV-positive status.
Others, like Ella and Teresa, felt their public insurance status
prompted negative
assumptions about their employment status, which presented
additional sources of
stigma.
Our findings build on previous studies that have found stigma
can have
significant implications for access to care, disease management
and progression, and
quality of life (Drury, Aramburu, and Louis 2002; Earnshaw and
Quinn 2011;
Sayles et al. 2009; Young and Bendavid 2010). We found that in
addition to
perceptions of suboptimal care, stigma resulted in some of our
participants changing
providers, forgoing care, or becoming reluctant to continue
seeking care. For
individuals who require ongoing medical care for serious
illnesses, this can be both
43. distressing and dangerous.
Some participants, like Carrie, Kelly, and Crystal, reported they
had noticed a
difference in how they were treated at certain healthcare
facilities over others.
While some mentioned that their treatment might be worse in
places who served
few people with public insurance, it was not always clear from
their stories whether
they felt the type of healthcare environment (i.e. private versus
public) determined
whether or not stigma might occur. While we did not ask our
participants to indicate
where their care experiences had occurred, we were able to
garner from their
accounts, that they had experienced stigma in both public and
private facilities. This
included federally qualified health centers and other clinics
targeting the
underserved, which is somewhat surprising since they may be
less impacted by
low reimbursement rates than are other kinds of clinics.
Previous research has
shown, however, that healthcare facilities treating a high
44. percentage of Medicaid
patients may not provide high quality care, as indicated by their
failure to meet
quality measurements (Goldman, Vittinghoff, and Dudley
2007). Thus, while such
clinics may be designed for serving patients with public
insurance, the quality of
care they receive may still be compromised. We also found that
our participants
experienced stigma not just from doctors and other clinicians,
but from support staff
as well, including receptionists and clerks. For example, many
participants
described long wait times which they felt were attributable to
support staff acting
as discriminatory gate-keepers. Others, like Crystal and Carrie,
experienced
‘‘standoffish’’ and ‘‘rude’’ behaviors from receptionists. Our
findings are consistent
with other studies that have found discrimination in healthcare
does not just
originate within the doctor-patient relationship, but also
between patients and
clinical support staff (Tajeu et al. 2015; Wen, Hudak, and
45. Hwang 2007). Thus,
discrimination and stigmatization may be experienced at many
levels of the
healthcare encounter, including outside of the consultation
room.
While, as our data shows, stigmatizing attitudes may be held by
various actors in
the clinical encounter including the doctors, nurses,
receptionists and other medical
staff, it is in its essence embedded in interpersonal power
differentials (cf: Goffman
1963). Power differentials in interpersonal relationships, while
experienced on an
Cult Med Psychiatry (2017) 41:161–180 173
123
individual level, are rooted in structural inequalities. These
inequalities constitute
the upstream causes of stigma in the health care setting. Link
and Phelan (2001)
write that ‘‘by itself the standard model that asks ‘what-makes-
person-A-discrim-
inate-against-person-B’ is inadequate for explaining the full
46. consequences of stigma
processes’’ because it obscures the hand of power that
structurally discriminates and
stigmatizes groups of people (Link and Phelan 2001:372). While
discussion of the
full range of structural causes of health care stigma is beyond
the scope of this
paper, we wish to focus on one important concern: that public
insurance status itself
may amplify interpersonal stigma in the health care setting.
Medicaid has long carried a burden of stigma in the United
States as a ‘‘symbol
of the waste and excess of the welfare state,’’ (Horton et al.
2014:7) carrying with it
sets of assumptions about the people who utilize these
resources. Medicaid
recipients are often socially characterized as lazy, willingly
unemployed, and less
educated (Barr 2000; Han et al. 2015; Hansen, Bourgois, and
Drucker 2014;
Levinson and Sjamsu 2004). The social construction that low-
income individuals
who enroll in Medicaid are ‘‘undeserving,’’ needy, and
dependent, in contrast to
47. ‘‘deserving’’ Medicare beneficiaries, emerged during the
inception of the two
programs (Piatak 2015), and continues to be a dominant
political perspective today
(Baker and Hunt 2016). Indeed, the personal responsibility
requirements built-into
Medicaid expansion Waivers, like Michigan’s, reflect this
notion.
Health care providers have been shown to draw on a variety of
domains in
constructing their judgements about who is deserving and who
is not, for example,
some groups may be perceived as more of a financial burden
than others, or as
failing to meet entitlement norms (Marrow 2012; Skinner et al.
2007). Furthermore,
public insurance stigma has been shown to be exacerbated by
low reimbursement
rates, treatment constraints, and high administrative costs
(Boehm 2005; Horton
et al. 2001; Willging 2005). In states with higher
reimbursements rates for
Medicaid, quality and access of care has been found to be better
than those with
48. lower rates (Cunningham and Nichols 2005; Cunningham and
O’Malley 2009;
Druss et al. 2012). Providers struggling to navigate such
financial constraints may
be more inclined—whether consciously or not—to hold
stigmatizing opinions of
public insurance and its beneficiaries and not accept them as
patients, which may
amplify the institutional limitations patients encounter when
receiving care in
poorly funded clinics where long wait times and rushed
appointments are endemic.
For example, Backus et al. (2001) found that primary care
physicians and specialists
described Medicaid patients as posing many challenges, such as
being noncompli-
ant, needing extra time for medical explanations during
consultations, and having
complex clinical and psychosocial problems.
It should be noted that this study draws on a small convenience
sample of
respondents who are qualified for public insurance, and as such
was not designed to
49. produce generalizable findings nor draw comparisons to people
with private
insurance. Still, our findings provide useful insight into the
complex and concerning
ways Medicaid recipients may experience stigma in their health
seeking while using
public insurance. Because we interviewed only Medicaid
qualified individuals, we
had no access to how their clinicians actually viewed them, or
knowledge of the
characteristics of the specific clinics they described. We can
merely surmise how
174 Cult Med Psychiatry (2017) 41:161–180
123
clinicians’ attitudes and institutional factors might impact
patient’s experiences of
stigma. Future research may add important insights to the
understanding of how
stigma impacts such patients, exploring, for example, whether
clinicians’ knowl-
edge of public insurance status affects their views of patients,
or how specific
50. institutional factors may act to promote or discourage stigma.
Future research might
also explore how funding limitations affect quality of care at
public and private
healthcare facilities, and how the experience of stigma may be
related to the actual
quality of care.
Conclusion
Stigma merits careful consideration in public insurance policy
planning because, as
we have demonstrated, it ultimately challenges health care
equity for certain groups.
Stigma can importantly affect the accessibility, continuity, and
quality of health care
received by low-income individuals. The Affordable Care Act’s
expansion of the
Medicaid program is an important step toward ensuring health
equity among low-
income Americans. New state Medicaid expansion plans
challenge typical
assumptions about who Medicaid beneficiaries are by extending
eligibility and
entitlement to middle class and working individuals (Quadagno
2015), however, it
51. remains to be seen whether those of middle class status
experience similar levels of
stigma when using public insurance.
The experiences of stigma described by the participants in this
study are inherent
to the ways public insurance is viewed not just in health care,
but in our society in
general. Simply expanding coverage will not in itself
necessarily dispel the
historical legacy of stigma associated with the Medicaid
program. The positive
impact of Medicaid expansion may be enhanced through
interventions focused on
reducing the stigma encountered by those using public health
coverage. To that end,
we join others (Allen et al. 2014; Barr 2000; Mason-Whitehead
and Mason 2007;
Reutter et al. 2009) in arguing that policy should attend
unambiguously to the issue
of stigma and its institutionalization within government
programs.
In the context of the recent presidential election, the future of
expanded Medicaid
52. programs may be in question. Still, Medicaid expansion remains
the only way many
uninsured Americans can obtain health insurance and access the
care they need. It is
our hope that states continue to expand Medicaid programs, and
that they will
simultaneously endeavor to identify, revise and remove symbols
of Medicaid as a
stigmatized status. For example, removing the ‘‘Medicaid’’
label as the main
signifier of beneficiaries’ health plan coverage and replacing it
with a neutral state-
specific plan name, such as Michigan’s ‘‘Healthy Michigan
Plan,’’ may be a starting
point in mitigating Medicaid’s stigmatized status. Policy-
makers might also
consider improving provider reimbursement rates for Medicaid
and further
incentivizing providers to accept more Medicaid patients, in the
form of financial
bonuses, perhaps. Including assessment of beneficiaries’
experiences of health care
stigma and discrimination in patient satisfaction surveys might
help identify
53. particularly problematic locations or providers.
Cult Med Psychiatry (2017) 41:161–180 175
123
Such attention to the realities of beneficiaries’ lives and
experiences may help
alleviate the problem of intersectional stigma in health care and
illuminate the ways
in which social attributes such as class, race, and gender may
combine with public
insurance stigma to impact health. Training programs might
raise awareness among
health care personnel of the importance of insurance status as a
source of stigma, the
compounding effect of intersectional stigma, and the impact of
these on the health
care they provide.
Inequitable health care received under the stigma of public
insurance is a public
health issue as it disadvantages and compromises the health of
low-income health
seekers. Toward maximizing our ability to reach the goal of
health equity, stigma
54. should be addressed directly in Medicaid policy planning and
development.
Funding The Michigan Department of Community Health
(MDCH) provided funding for this research
project (Grant # 134355). The views in this paper are those of
the authors, and should not be assumed to
reflect those of MDCH.
Compliance with Ethical Standards
Conflict of interest The authors declare that they have no
conflict of interest.
Ethical Approval All procedures performed in studies involving
human participants were in accordance
with the ethical standards of the institutional and/or national
research committee and with the 1964
Helsinki declaration and its later amendments or comparable
ethical standards.
Informed Consent Informed consent was obtained from all
individual participants included in this
study. All names have been changed to pseudonyms and
identifying information has been removed.
References
Ablon, Joan
1981 Stigmatized Health Conditions. Social Science and
Medicine 15B: 5–9.
Acquaviva, Kimberly D., and Matthew. Mintz
55. 2010 Perspective: Are we Teaching Racial Profiling? The
Dangers of Subjective Determinations of
Race and Ethnicity in Case Presentations. Academic Medicine
85(4): 702–705.
Allen, Heidi, B. J. Wright, K. Harding, and L. Broffman
2014 The Role of Stigma in Access to Health Care for the Poor.
The Milbank Quarterly 92(2): 289–
318.
Ayanian, John Z., B. A. Kohler, T. Abe, and A. M. Epstein
1993 The Relation Between Health Insurance Coverage and
Clinical Outcomes Among Women with
Breast Cancer. The New England Journal of Medicine 329(5):
326–331.
Backus, Lisa, D. Osmond, K. Grumbach, K. Vranizan, L.
Phuong, and A. B. Bindman
2001 Specialists and Primary Care Physicians’ Participation in
Medicaid Managed Care. Journal of
General Internal Medicine 16: 815–821.
Baicker, Katherine, S. L. Taubman, H. L. Allen, M. Bernstein,
J. H. Gruber, J. P. Newhouse, E. C.
Schneider, B. J. Wright, A. M. Zaslavsky, and A. N. Finkelstein
2013 The Oregon Experiment–Effects of Medicaid on Clinical
56. Outcomes. The New England Journal
of Medicine 368(18): 1713–1722.
Baker, Allison M., and Linda M. Hunt
2016 Counterproductive Consequences of a Conservative
Ideology: Medicaid Expansion and Personal
Responsibility Requirements. American Journal of Public
Health 106(7): 1181–1187.
176 Cult Med Psychiatry (2017) 41:161–180
123
Barr, Barbara Matacera
2000 Stigma: A Paper for Discussion. Covering Kids National
Program Office, Southern Institute on
Children and Families.
Becker, Gay
2004 Deadly Inequality in the Health Care ‘‘Safety Net’’:
Uninsured Ethnic Minorities’ Struggle to
Live with Life-Threatening Illnesses. Medical Anthropology
Quarterly 18(2): 258–275.
Becker, Gay, and Edwina Newsom
2003 Socioeconomic Status and Dissatisfaction with Health
57. Care Among Chronically Ill African
Americans. American Journal of Public Health 93(5): 742–748.
Bird, Sheryl.Thorburn, and Laura M. Bogart
2000 Perceived Race-Based and Socioeconomic Status (SES)-
Based Discrimination in Interactions
with Health Care Providers. Ethnicity and Disease 11(3): 554–
563.
Boehm, Deborah A.
2005 The Safety Net of the Safety Net: How Federally Qualified
Health Centers ‘‘Subsidize’’
Medicaid Managed Care. Medical Anthropology Quarterly
19(1): 47–63.
Bowleg, Lisa
2012 The Problem with the Phrase Women and Minorities:
Intersectionality—An Important
Theoretical Framework for Public Health. American Journal of
Public Health 102(7): 1267–
1273.
Burstin, Helen R., Stuart R. Lipsitz, and Troyen A. Brennan
1992 Socioeconomic Status and Risk for Substandard Medical
Care. Journal of the American Health
Association 268(17): 2383–2387.
58. Crenshaw, Kimberle
1989 Demarginalizing the Intersection of Race and Sex: A
Black Feminist Critique of Antidiscrim-
ination Doctrine, Feminist Theory and Antiracist Politics.
University of Chicago Legal Forum
1989(1): 139–167.
1991 Mapping the Margins: Intersectionality; Identity Politics,
and Violence Against Women of
Color. Stanford Law Review 43(6): 1241–1299.
Cunningham, P. J., and L. M. Nichols
2005 The Effects of Medicaid Reimbursement on the Access to
Care of Medicaid Enrollees: A
Community Perspective. Medical Care Research and Review
62(6): 676–696.
Cunningham, Peter J., and Ann S. O’Malley
2009 Do Reimbursement Delays Discourage Medicaid
Participation By Physicians?. Health Affairs
28(1): W17–W28.
Davis, Kathy
2008 Intersectionality as Buzzword: A Sociology of Science
Perspective on What Makes a Feminist
59. Theory Successful. Feminist Theory 9(1): 67–85.
DelVecchio Good, Mary-Jo, C. James, B. J. Good, and A. E.
Becker
2003 The Culture of Medicine and Racial, Ethnic, and Class
Disparities in Healthcare. In Unequal
Treatment: Confronting Racial and Ethnic Disparities in
Healthcare. B. D. Smedley, A. Y. Stith,
and A. R. Nelson, eds., pp. 594–625. Washington, D.C.: The
National Academies Press.
Drury, Alegri, Christina Aramburu, and Margaret Louis
2002 Exploring the Association Between Body Weight, Stigma
of Obesity, and Health Care
Avoidance. Journal of the American Academy of Nurse
Practitioners 14(12): 554–561.
Druss, Benjamin G., L. Zhao, J. R. Cummings, R. S. Shim, G. S.
Rust, and S. C. Marcus
2012 Mental Comorbidity and Quality of Diabetes Care Under
Medicaid: A 50-State Analysis.
Medical Care 50(5): 428–433.
Earnshaw, Valerie A., and Diane M. Quinn
2011 The Impact of Stigma in Healthcare on People Living with
Chronic Illnesses. Journal of Health
Psychology 17(2): 157–168.
60. Franks, Peter, Kevin Fiscella, and Sean Meldrum
2005 Racial Disparities in the Content of Primary Care Office
Visits. Journal of General Internal
Medicine 20(7): 599–603.
Gaines, Atwood D.
2005 Race: Local Biology and Culture in Mind. In Companion
to Psychological Anthropology:
Modernity and Psychocultural Change. C. Casey and R.
Edgerton, eds., pp. 255–278. Oxford:
Blackwell.
Cult Med Psychiatry (2017) 41:161–180 177
123
Goffman, Erving
1963 Stigma: Notes on the Management of Spoiled Identity.
New York: Simon and Schuster.
Goldman, L.Elizabeth, Eric Vittinghoff, and R. Adams Dudley
2007 Quality of Care in Hospitals with a High Percent of
Medicaid Patients. Medical Care 45(6): 579–
583.
61. Gravlee, C. C.
2009 How Race Becomes Biology: Embodiment of Social
Inequality. American Journal of Physical
Anthropology 139(1): 47–57.
Han, Xinxin, K. T. Call, J. K. Pintor, G. Alarcon-Espinoza, and
A. B. Simon
2015 Reports of Insurance-Based Discrimination in Health Care
and Its Association with Access to
Care. American Journal of Public Health 105(Suppl 3): S517–
S525.
Hansen, Helena, Philippe Bourgois, and Ernest Drucker
2014 Pathologizing Poverty: New Forms of Diagnosis,
Disability, and Structural Stigma Under
Welfare Reform. Social Science and Medicine 103: 76–83.
Hatzenbuehler, Mark L., Jo C. Phelan, and Bruce G. Link
2013 Stigma as a Fundamental Cause of Population Health
Inequalities. American Journal of Public
Health 103(5): 813–821.
Henderson, Stuart, Clare.L. Stacey, and Daniel Dohan
2008 Social Stigma and the Dilemmas of Providing Care to
Substance Users in a Safety-Net
Emergency Department. Journal of Health Care for the Poor and
62. Underserved 19(4): 1336–1349.
Horton, S.
2006 The Double Burden on Safety Net Providers: Placing
Health Disparities in the Context of the
Privatization of Health Care in the US. Social Science and
Medicine 63(10): 2702–2714.
Horton, Sarah, C. Abadı́a, J. Mulligan, and J. J. Thompson
2014 Critical Anthropology of Global Health ‘‘Takes a Stand’’
Statement: A Critical Medical
Anthropological Approach to the U.S.’s Affordable Care Act.
Medical Anthropology Quarterly
28(1): 1–22.
Horton, Sarah, J. McCloskey, C. Todd, and M. Henriksen
2001 Transforming the Safety Net: Responses to Medicaid
Managed Care in Rural and Urban New
Mexico. American Anthropologist 103(3): 733–746.
Hunt, L. M., and M. J. Kreiner
2013 Pharmacogenetics in Primary Care: The Promise of
Personalized Medicine and the Reality of
Racial Profiling. Culture, Medicine and Psychiatry 37(1): 226–
235.
Hunt, Linda M., and Katherine B. de Voogd
63. 2005 Clinical Myths of the Cultural ‘‘Other’’: Implications for
Latino Patient Care. Academic
Medicine 80(10): 918–924.
Hunt, Linda M., Nicole Truesdell, and Meta J. Kreiner
2013 Race, Genes and Culture in Primary Care: Racial Profiling
in the Management of Chronic Illness.
Medical Anthropology Quarterly. 27(2): 253–271.
Jackson, Pamela.Braboy, and David R. Williams
2006 The Intersection of Race, Gender and SES: Health
Paradoxes. In Gender, Race, Class, and
Health: Intersectional Approaches. A. Shulz and L. Mullings,
eds., pp. 131–162. San Francisco,
CA: Jossey-Bass.
Kaeser Family Foundation, Kaiser Commission on Medicaid and
the Uninsured
2013 Medicaid: A Primer-Key Information n the Nations’
Health Coverage Program for Low-Income
People, Vol. 2016. Kaeser Family Foundation.
Kinsler, Janni J., M. D. Wong, J. N. Sayles, C. Davis, and W. E.
Cunningham
2007 The Effect of Perceived Stigma from a Health Care
Provider on Access to Care Among a Low-
64. Income HIV-Positive Population. AIDS Patient Care and STDS
21(8): 584–592.
Kwok, Joseph, S. M. Langevin, A. Argiris, J. R. Grandis, W. E.
Gooding, and E. Taioli
2010 The Impact of Health Insurance Status on the Survival of
Patients with Head and Neck Cancer.
Cancer 116(2): 476–485.
Levinson, Arik, and Rahardja Sjamsu
2004 Medicaid Stigma. Washington D.C.: Georgetown
University.
Link, Bruce G., and Jo C. Phelan
2001 Conceptualizing Stigma. Annual Review of Sociology 27:
363–385.
178 Cult Med Psychiatry (2017) 41:161–180
123
Marrow, H. B.
2012 Deserving to a Point: Unauthorized Immigrants in San
Francisco’s Universal Access Healthcare
Model. Social Science and Medice 74(6): 846–854.
Mason-Whitehead, Elizabeth, and Tom Mason
65. 2007 Stigma and Exclusion in Healthcare Settings. Chichester:
Wiley.
Nadeem, Erum, J. M. Lange, D. Edge, M. Fongwa, T. Belin, and
J. Miranda
2007 Does Stigma Keep Poor Young Immigrant and U.S.-Born
Black and Latina Women From
Seeking Mental Health Care. Psychiatric Services 58(12): 1547–
1554.
Nawaz, H., and A. S. Brett
2009 Mentioning Race at the Beginning of Clinical Case
Presentations: A Survey of US Medical
Schools. Medical Education 43(2): 146–154.
Phelan, Jo C., Bruce G. Link, and Parisa Tehranifar
2010 Social Conditions as Fundamental Causes of Health
Inequalities: Theory, Evidence, and Policy
Implications. Journal of Health and Social Behavior 51(Suppl):
S28–S40.
Piatak, Jaclyn S.
2015 Understanding the Implementation of Medicaid and
Medicare Social Construction and Historical
Context. Administration & Society.
doi:10.1177/0095399715581030.
66. Piña, Darlene L.
1998 Medicaid Beneficiaries’ Experiences in HMO and Fee-For-
Service Health Care. Journal of
Health Care for the Poor and Underserved 9(4): 433–448.
Quadagno, Jill
2015 The Transformation of Medicaid from Poor Law Legacy to
Middle-Class Entitlement. In
Medicare and Medicaid at 50: America’s Entitlement Programs
in the Age of Affordable Care.
A. B. Cohen, D. C. Colby, K. A. Wailoo, and J. E. Zelizer, eds.
Oxford University Press: Oxford.
Reutter, Linda I., M. J. Stewart, G. Veenstra, R. Love, D.
Raphael, and E. Makwarimba
2009 ‘‘Who Do They Think We Are, Anyway?’’: Perceptions of
and Responses to Poverty Stigma.
Qualitative Health Research 19(3): 297–311.
Rovin, Kimberly, R. Stone, L. Gordon, E. Boffi, and L. Hunt
2012 Better than Nothing: Participant Experiences Using a
County Health Plan. Practicing
Anthropology 34(4): 13–18.
Sayles, Jennifer N., M. D. Wong, J. J. Kinsler, D. Martins, and
W. E. Cunningham
67. 2009 The Association of Stigma with Self-reported Access to
Medical Care and Antiretroviral
Therapy Adherence in Persons Living with HIV/AIDS. Journal
of General Internal Medicine
24(10): 1101–1108.
Silow-Carroll, Sharon, S. E. Anthony, P. A. Seltman, and J. A.
Meyer
2001 Community-Based Health Plans for the Uninsured:
Expanding Access, Enhancing Dignity.
Battle Creek, MI: W.K. Kellogg Foundation.
Skinner, Natalie, N. T. Feather, T. Freeman, and A. Roche
2007 Stigma and Discrimination in Health-Care Provision to
Drug Users: The Role of Values, Affect,
and Deservingness Judgments. Journal of Applied Social
Psychology 37(1): 163–186.
Sorlie, Paul D., N. J. Johnson, E. Backlund, and D. D. Bradham
1994 Mortality in the Uninsured Compared With That in
Persons With Public and Private Health
Insurance. Archives of Internal Medicine 154(14): 2409–2416.
Stuber, Jennifer, and Mark Schlesinger
2006 Sources of Stigma for Means-Tested Government
Programs. Social Science and Medicine 63(4):
68. 933–945.
Stuber, Jennifer, and Karl Kronebusch
2004 Stigma and Other Determinants of Participation in TANF
and Medicaid. Journal of Policy
Analysis and Management 23(5): 509–530.
Tajeu, Gabriel S., A. L. Cherrington, L. Andreae, C. Prince, C.
L. Holt, and J. H. Halanych
2015 ‘‘We’ll Get to You WhenWe Get to You’’: Exploring
Potential Contributions of Health Care
Staff Behaviors to Patient Perceptions of Discrimination and
Satisfaction. American Journal of
Public Health 105(10): 2076–2082.
Van Der Wees, PJ, Alan M. Zaslavsky, and John Z. Ayanian
2013 Improvements in Health Status after Massachusetts Health
Care Reform. The Milbank Quarterly
91(4): 663–689.
Cult Med Psychiatry (2017) 41:161–180 179
123
http://dx.doi.org/10.1177/0095399715581030
Wagenfeld-Heintz, Ellen, Victoria C. Ross, and Keon-Hyung
Lee
69. 2007 Physicians’ Perceptions of Patients in a County Sponsored
Health Plan. Social Work in Public
Health 23(1): 45–59.
Weech-Maldonado, Robert, A. Hall, T. Bryant, K. A. Jenkins,
and M. N. Elliott
2012 The Relationship Between Perceived Discrimination and
Patient Experiences With Health Care.
Medical Care 50(9): S62–S68.
Weiss, Mitchell, and Jayashree Ramakrishna
2006 Stigma Interventions and Research for International
Health. The Lancet 367: 536–538.
Wen, C. K., P. L. Hudak, and S. W. Hwang
2007 Homeless People’s Perceptions of Welcomeness and
Unwelcomeness in Healthcare Encounters.
Journal of General Internal Medicine 22(7): 1011–1017.
Willging, Cathleen E.
2005 Power, Blame and Accountability: Medicaid Managed
Care for Mental Health Services in New
Mexico. Medical Anthropology Quarterly 19(1): 84–102.
Witzig, R.
1996 The Medicalization of Race: Scientific Legitimization of a
70. Flawed Social Construct. Annals of
Internal Medicine 125(8): 675–679.
Young, Sean D., and Eran Bendavid
2010 The Relationship Between HIV Testing, Stigma, and
Health Service Usage. AIDS Care 22(3):
373–380.
180 Cult Med Psychiatry (2017) 41:161–180
123
Culture, Medicine & Psychiatry is a copyright of Springer,
2017. All Rights Reserved.
‘‘They Treat you a Different Way:’’ Public Insurance, Stigma,
and the Challenge to Quality Health
CareAbstractIntroductionPublic Health Insurance in
MichiganStigma and Its Implications for Health DisparitiesThe
StudyExperiences of Stigma with Public InsurancePerceptions
of Poor Quality CareNegative Interpersonal InteractionsHealth
Implications of StigmaDiscussionConclusionFundingReferences
ARTICLE IN PRESS
Geriatric Nursing 000 (2019) 1�7
Contents lists available at ScienceDirect
Geriatric Nursing
73. events,
resulting in an estimated $2.8 billion annual excess spending on
hospital-
izations.1 Registered nurses (RNs) provide important clinical
leadership
and oversight in nursing homes to prevent such events from
occurring
and ensure that residents receive appropriate care. In their roles
as direc-
tors of nursing, supervisors, and charge nurses, RNs are
responsible for
supervising other nursing personnel, coordinating care,
conducting resi-
dent surveillance, interfacing with medical staff, and overseeing
infection
control, wound care, and quality improvement programs.3,4
The ability of RNs to carry out these roles is largely influenced
by
the work environment in which they practice.5 In good work
envi-
ronments, RNs have adequate staff and resources, supportive
manag-
ers, strong nursing foundations underlying care, productive
relationships with colleagues, input into organizational affairs,
and
opportunities for advancement.6 Extensive research has shown
that
hospitals with these features have better patient outcomes
including
lower mortality, reduced length of stay, and higher
satisfaction,7�10
as well as lower RN burnout and job dissatisfaction.11�13
Nursing
home RNs report higher rates of burnout and job dissatisfaction
than
74. RNs employed in any other setting, including hospitals,14 and
are
often unable to complete necessary care due to insufficient time
and
resources.15 Burnout and job dissatisfaction are both key
drivers of
staff turnover,13,16 a significant problem in nursing homes that
has
been consistently linked to worse care quality.17�20
Nursing home work environment studies have been limited in
both scope and number. The relationship between RN staffing—
one
component of the work environment—and quality has been
studied
extensively, but results have been mixed.21�25 There have
been
many critiques of the staffing literature, the largest being that
most
studies used facility-reported staffing data which are prone to
report-
ing bias.22�25 Another factor explaining why RN staffing has
been
inconsistently associated with quality may be that staffing is so
low
in some nursing homes that small increases do not lead to
signifi-
cantly more RN oversight of residents. Additionally, staffing
improve-
ments alone may have limited influence without other elements
of
good work environments being in place.7 Supportive leadership,
RN
involvement in organizational decisions, safety climate, and
team-
work have been linked to better nursing home quality.26�31
75. Only one
study sampled RNs independently of their employers to reduce
response bias at the organizational level, and used a
comprehensive
measure of work environment.32,33 No studies have examined
the
impact of work environment on RN burnout in nursing homes.
The purpose of this study was to examine the empirical relation-
ship of work environment with care quality, RN burnout, and
job
mailto:[email protected]
https://doi.org/10.1016/j.gerinurse.2019.08.007
https://doi.org/10.1016/j.gerinurse.2019.08.007
https://doi.org/10.1016/j.gerinurse.2019.08.007
http://www.ScienceDirect.com
http://www.gnjournal.com
ARTICLE IN PRESS
2 E.M. White et al. / Geriatric Nursing 00 (2019) 1�7
dissatisfaction in nursing homes. We hypothesized that nursing
homes with better work environments would have lower rates of
pressure ulcers, antipsychotic medication use, and
hospitalizations,
and fewer RNs with job dissatisfaction and burnout. This study
is the
first to use multi-state RN survey data with the Practice
Environment
Scale of the Nursing Work Index (PES-NWI),6 a comprehensive
National Quality Forum-endorsed measure, to examine the
relation-
ship of work environment with care quality and nurse outcomes
in
76. nursing homes.6,12,34,35
Methods
Design and data sources
This study was a cross-sectional secondary data analysis of
three
linked datasets from 2015: (1) RN4CAST-US nurse survey data,
(2)
LTCfocus, and (3) Nursing Home Compare. We used
RN4CAST-US for
measures of the work environment, RN characteristics, and RN
out-
comes; LTCfocus for provider characteristics and the
hospitalization
measure; and Nursing Home Compare for the pressure ulcer and
antipsychotic measures.
RN4CAST-US
The RN survey was conducted to investigate relationships
between nursing resources, care quality, and patient and nurse
out-
comes, across a large number of healthcare organizations. From
Janu-
ary to December 2015, Aiken and colleagues surveyed a 30%
random
sample of licensed RNs in four states (CA, NJ, FL, and PA) � a
total of
231,000 RNs.39 Surveys were mailed and emailed to RNs using
con-
tact information on file with state boards of nursing. RNs were
asked
to provide their employer’s name and address in order to link
their
77. responses to their employer, and were sent multiple reminders
and
offered small incentives to participate. This sampling approach
per-
mits study of many organizations, while eliminating potential
bias
that comes with surveying RNs via their employers.
The final response rate was 26%, reflecting a growing trend in
sur-
vey non-response36 and lack of information prior to sampling
on
whether and where RNs were currently employed. To evaluate
for
response bias, Aiken et al. completed a non-responder survey on
a
random sub-sample of 1400 non-responders, yielding an 87%
response rate.37 These individuals received a shorter survey,
more
intensive attempts to contact, and a cash incentive. This double-
sam-
ple approach is considered to be the gold standard for assessing
non-
response bias.38 There were no significant differences in the
meas-
ures of interest between long-term care RN responders and non-
res-
ponders. Survey methods are described in detail
elsewhere.37,39
LTCfocus
This publicly-available dataset from Brown University has pro-
vider characteristics of all Medicare and Medicaid-certified
nursing
homes in the US. LTCfocus merges data from the Minimum
78. Data Set
(MDS), the Certification and Survey Provider Enhanced Reports
(CAS-
PER) system, Medicare claims, Nursing Home Compare, and
other
sources to generate information at the facility, county, and state
lev-
els.40 The 2015 facility-level LTCfocus file was downloaded
from
http://ltcfocus.org.
Nursing Home Compare
Nursing Home Compare data are extracted from MDS, CASPER,
and Medicare claims, and are updated on a quarterly basis. To
ensure
temporal congruency, we used second quarter data to match
with
LTCfocus, which calculates its prevalence estimates based on
data
from the first Thursday of each April. We merged the provider
infor-
mation file with the MDS second quarter quality measure files
down-
loaded from the 2015 archived files at
https://data.medicare.gov.
Study population
We identified RNs from the parent survey who worked in
nursing
homes by cross-matching respondents’ employers’ names and
addresses with a list of all Medicare and Medicaid-certified
nursing
homes. This created a sampling frame of 1540 RNs (2.6% of
respond-
ents) who were employed in 1008 nursing homes in CA, FL, NJ,
79. and
PA. We excluded RNs who did not complete the work
environment
measure in the survey (n = 311), but found no statistically
significant
differences in other variables of interest between RNs with and
with-
out missing data on that measure. We further excluded RNs who
were the sole employee of a nursing home represented in the
survey
(n = 555), since aggregated reports from multiple employees per
nursing home produced a more reliable facility-level measure of
the
work environment.12 This yielded a final sample of 674 RNs
employed in 245 nursing homes. The nursing home and RN
sample
sizes also varied somewhat by outcome because cases were
deleted
when outcome data were missing.
Variables and measures
Work environment
The 31-item Practice Environment Scale of the Nursing Work
Index (PES-NWI) is a comprehensive National Quality Forum-
endorsed measure6,12,34,35 that has been previously validated
in nurs-
ing homes.33 It is derived from questions on the RN survey, and
has
five subscales: (1) nurse participation in organizational affairs;
(2)
nursing foundations for quality of care; (3) nurse manager
ability,
leadership, and support of nurses; (4) staffing and resource ade-
quacy; and (5) collegial nurse-physician relationships. RNs
80. report the
degree to which various elements are present in their work
setting
using a four point Likert scale, where higher scores indicate
more
favorable responses. We found each subscale mean, averaged
them
across all RNs in each facility to create facility-level subscale
scores,
and then averaged the subscale scores in each facility to create a
facil-
ity-level composite scale score.6,41 We grouped nursing homes
with
composite scores and subscale scores to contrast those in the
lowest
25th percentile (which we labeled “poor”), middle 50th
percentile
(“average”), and upper 25th percentile (“good”). Across the 245
nurs-
ing homes, the facility-level score was determined from a range
of
two to eight RNs, with a mean of 2.5 RNs per facility.
Compared to
CASPER staffing data, this represented a mean of 20% of total
employed RNs per facility.
Nursing home quality measures
We examined three measures of quality, the first two from
Nurs-
ing Home Compare, and the third from LTCfocus: (1) percent of
high
risk long-stay residents with Stage II-IV pressure ulcers, (2)
percent
of long-stay residents who received antipsychotic medication,
and
81. (3) hospitalizations per resident year. The pressure ulcer and
antipsy-
chotic measures are both derived from MDS data and reflect the
facil-
ity-level unadjusted rate, after excluding cases where the
outcome
was either unavoidable or out of the facility’s control.42 The
LTCfocus
hospitalization measure is derived from MDS and claims data,
and
represents the total number of hospitalizations for short and
long-
stay residents from the facility relative to all nursing home days
for
all residents in the facility that calendar year. These measures
were
chosen because they are widely accepted measures of nursing
home
quality that have been previously linked to organizational
elements
of nursing such as staffing and turnover.
Nurse outcomes
Nurse outcomes came from the RN survey. Job dissatisfaction
was
measured on a four point Likert scale response to the question
“How
satisfied are you with your primary job?”, and was
dichotomized as
http://ltcfocus.org
https://data.medicare.gov
Table 1
82. Nursing home and registered nurse characteristics across all
nursing homes, and across nursing homes with poor, average,
and good work environments.
Nursing home work environment
Nursing home characteristics Total sample (n = 245) Poor (n =
62) Average (n = 122) Good (n = 61)
Ownership, n (%)
For-profit 124 (50.6%) 35 (56.5%) 63 (51.6%) 26 (42.6%)
Nonprofit or government 121 (49.4%) 27 (43.5%) 59 (48.4%) 35
(57.4%)
Chain-owned, n (%) 132 (53.9%) 37 (59.7%) 65 (53.3%) 30
(49.2%)
Payer mix, mean (SD)
% primary payer Medicaid 56.2 (25.1) 61.2 (23.1) 55.8 (25.0)
52.1 (26.8)
% primary payer Medicare 13.7 (12.1) 11.6 (9.7) 15.2 (12.5)
12.7 (13.1)
Staffinga, mean (SD)
RN hours per resident day 0.64 (0.37) 0.57 (0.21) 0.65 (0.34)
0.70 (0.52)
LPN hours per resident day 0.82 (0.40) 0.77 (0.24) 0.84 (0.48)
0.83 (0.37)
CNA hours per resident day 2.46 (0.53) 2.36 (0.51) 2.46 (0.53)
2.57 (0.56)
% total licensed nurse
(RN +LPN) hours per resident
day provided by RNs
43.9 (17.4) 42.5 (14.6) 44.1 (18.7) 44.9 (17.6)
Nursing home work environment
83. Registered nurse characteristics Total sample (n = 674) Poor (n
= 168) Average (n = 356) Good (n = 150)
Age in years, mean (SD) 51.7 (12.1) 52.6 (11.2) 51.0 (12.2)
52.4 (13.0)
Years of experience, mean (SD) 20.6 (14.1) 21.5 (13.2) 19.8
(14.2) 21.5 (14.6)
Sex, female, n (%) 631 (93.6%) 156 (92.9%) 331 (93.0%) 144
(96.0%)
Race, non-white, n (%) 121 (18.0%) 29 (17.3%) 69 (19.4%) 23
(15.3%)
Native language English, n (%) 584 (86.6%) 149 (88.7%) 310
(87.1%) 125 (83.3%)
Position, n (%)
Direct care staff RN 304 (45.1%) 87 (51.8%) 164 (46.1%) 53
(35.3%)*
Nurse manager/administrator 221 (32.8%) 47 (28.0%) 116
(32.6%) 58 (38.7%)*
Other nursing role 149 (22.1%) 34 (20.2%) 76 (21.3%) 39
(26.0%)*
* Differences in characteristics across nursing homes with poor,
average, and good work environments significant at p < .05, as
tested using Pearson chi-square statistics for cate-
gorical variables, and F-tests from ANOVA for continuous
variables.
a RN = registered nurse; LPN = licensed practical nurse; CNA =
certified nursing assistant.
ARTICLE IN PRESS
E.M. White et al. / Geriatric Nursing 00 (2019) 1�7 3
“very or somewhat dissatisfied” vs. “very or somewhat
satisfied”.
84. Burnout was measured with the Emotional Exhaustion scale of
the
Maslach-Burnout Inventory, a validated measure of
occupational
burnout.43 As specified in the instrument’s scoring guidelines,
RNs
were classified as having burnout if their score was 27 or
higher, the
published average for healthcare workers.44
Analysis
We first generated descriptive statistics to examine nursing
home
and RN characteristics, and determine differences in quality
meas-
ures and RN outcomes across facilities, using F-tests, t-tests,
and chi-
square tests as appropriate. We then estimated the effects of the
overall (composite) work environment, and its different
components,
on the nursing home quality measures and the RN outcomes,
control-
ling for potentially confounding factors. We used nursing home-
level
data and linear regression models for the quality measures (i.e.,
the
pressure ulcer, antipsychotic, and hospitalization outcomes),
and
controlled for nursing home factors including ownership type,
chain
affiliation, Medicare census, Medicaid census, RN skill mix,
certified
nursing assistant staffing, presence of an Alzheimer's unit,
average
resource utilization group (RUG) score (a measure of case mix),
85. and
an indicator of whether the facility accepts ventilator-dependent
patients. For the RN outcomes (job dissatisfaction and burnout),
we
used multilevel data and robust logistic regression models to
account
for clustering of RNs in nursing homes. In these models, we
con-
trolled for both nursing home characteristics and RN
characteristics
(age, sex, race, position, years of experience, native language).
To compensate for the problem of heteroscedasticity due to our
work environment measure being based on a small number of
RNs
per nursing home, we used analytic weights to weight the
aggregated
facility score in our linear regression models by the number of
respondents per facility, giving greater weight to nursing homes
with
more respondents.45,46 We also controlled for the number of
respondents per nursing home in all models. Data were analyzed
using Stata version 15.1 (Stata Corp., College Station, TX). The
Univer-
sity of Pennsylvania institutional review board approved this
study.
Results
Table 1 shows nursing home and RN sample characteristics.
Nursing
homes with poor work environments were more often for-profit,
chain-
owned, had a higher Medicaid census, and lower staffing than
nursing
homes with average or good environments, but none of these
86. differen-
ces were statistically significant. RNs in nursing homes with
good envi-
ronments were significantly more likely to be employed in
managerial
and other roles, and less likely to be employed as direct care
staff, than
RNs in nursing homes with average or poor environments. No
other RN
characteristics differed across nursing home work environments.
Table 2 summarizes variation in quality measures and RN
outcomes
across nursing homes with different characteristics. These
unadjusted
differences reveal that nursing homes with poor environments
had sig-
nificantly higher rates of pressure ulcers and antipsychotic use,
and
more RNs who were dissatisfied and exhibited burnout. Other
organi-
zational characteristics had less consistent effects across
outcomes.
Table 3 shows results of bivariate and adjusted linear regression
models for the nursing home quality measures. The three work
envi-
ronment categories are treated as a linear term for both the
overall
PES-NWI and its subscales. As such, a one unit change
represents the
difference between average vs. poor or good vs. average
environments,
while a two unit change represents the difference between good
vs.
poor environments. Controlling for other organizational
87. characteristics,
nursing homes with average vs. poor work environments, and
good vs.
average environments, had 0.9% fewer long-stay high risk
residents
with pressure ulcers (p=.02), and 0.08 fewer hospitalizations per
resi-
dent year (p=.05). This implies that nursing homes with good
vs. poor
environments had 2 £ 0.9% = 1.8% fewer pressure ulcers and
Table 2
Differences in quality measures and registered nurse (RN)
outcomes by nursing home organizational characteristics.
Quality measures RN outcomes
Percent of long-stay
high risk residents with
pressure ulcers
(n = 222)a
Percent of long-stay
residents who received
antipsychotics (n = 230)
Number of
hospitalizations per
resident year (n = 244)
Number of RNs
dissatisfied with their
88. job (n = 656)
Number of RNs with
burnout (n = 577)
Organizational
characteristics Mean SD Mean SD Mean SD n % n %
All nursing homes 5.1 (3.8) 15.5 (6.8) 1.1 (0.5) 161 (24.5) 196
(34.0)
Work environment
Poor 5.6 (3.6)* 17.5 (7.3)* 1.1 (0.5) 76 (46.6)* 77 (55.4)*
Average 5.2 (4.4) 14.9 (6.6) 1.1 (0.6) 73 (21.1) 100 (32.4)
Good 4.3 (2.7) 14.7 (6.5) 1.0 (0.6) 12 (8.2) 19 (14.7)
Ownership
For-profit 5.5 (4.5) 15.5 (6.8) 1.2 (0.6)* 88 (28.8)* 99 (36.8)
Nonprofit or government 4.6 (3.0) 15.5 (7.0) 0.9 (0.5) 73 (20.9)
97 (31.5)
Chain-owned
Yes 4.6 (3.5)* 14.8 (6.9) 1.2 (0.6)* 87 (26.1) 108 (35.6)
No 5.7 (4.2) 16.3 (6.7) 1.0 (0.5) 74 (23.0) 88 (32.2)
Medicaid census
Highb 5.1 (3.2) 16.7 (7.4)* 1.0 (0.4) 90 (25.5) 102 (32.8)
Low 5.1 (4.5) 14.0 (5.8) 1.1 (0.7) 71 (23.4) 94 (35.3)
Medicare census
Highb 5.0 (4.1) 14.5 (5.6) 1.4 (0.6) 44 (25.0) 66 (40.2)*
Low 5.1 (3.8) 15.9 (7.2) 0.9 (0.5) 117 (24.4) 130 (31.5)
Average Resource
Utilization Group score
89. Highb 4.9 (4.0) 15.4 (6.4) 1.2 (0.6)* 107 (26.6) 130 (36.3)
Low 5.4 (3.6) 15.7 (7.5) 0.9 (0.4) 54 (21.3) 66 (30.1)
RN hours per resident dayc
Highb 5.2 (4.3) 14.7 (7.1) 1.1 (0.6) 84 (23.3) 115 (35.0)
Low 4.9 (3.3) 16.4 (6.4) 1.0 (0.4) 77 (26.1) 81 (32.7)
LPN hours per resident dayc
Highb 5.1 (3.7) 16.1 (7.3) 1.1 (0.6) 65 (24.5) 75 (34.3)
Low 5.1 (3.9) 15.1 (6.5) 1.1 (0.5) 96 (24.6) 121 (33.8)
CNA hours per resident dayc
Highb 5.0 (4.0) 14.8 (6.1) 1.1 (0.6) 82 (23.4) 94 (30.8)
Low 5.2 (3.7) 16.3 (7.5) 1.1 (0.5) 79 (25.9) 102 (37.5)
% of total licensed nurse (RN+LPN)
hours per resident day
provided by RNs
Highb 5.4 (4.4) 14.7 (7.0)* 1.1 (0.6) 97 (23.5) 126 (33.6)
Low 4.7 (2.8) 16.7 (6.5) 1.0 (0.5) 64 (26.3) 70 (34.7)
* Differences significant at p < .05, as indicated by F-tests or t-
tests.
a Sample sizes vary across quality measures and nurse outcomes
because of missing outcomes data.
b “High” and “Low” represent values that are at/above and
below the national mean, as determined from LTC Focus data.
c RN = registered nurse; LPN = licensed practical nurse; CNA =
certified nursing assistant.
ARTICLE IN PRESS
4 E.M. White et al. / Geriatric Nursing 00 (2019) 1�7
90. 2 £ 0.08 = 0.16 fewer hospitalizations per resident year, or 16
fewer
hospitalizations per 100 residents per year. Since these
differences rep-
resent about one-half of a standard deviation in the case of
pressure
ulcers and one-third of standard deviation with respect to
hospitaliza-
tions, the difference between nursing homes with good vs. poor
work
environments would equate, all else being equal, to being in the
40th
vs. 60th percentile for pressure ulcers, and in the 43rd vs. 56th
percen-
tile for hospitalizations. Nursing homes with good vs. poor
work envi-
ronments had fewer residents on antipsychotics, but the
difference
was not statistically significant in adjusted models.
Similar effects were found for the different subscales, though
only
roughly half of them were statistically significant in the
adjusted pres-
sure ulcer and hospitalization models. Strong nursing
foundations,
nursing leadership, and collegial nurse-physician relationships
were
significantly associated with reduced pressure ulcers.
Staffing/resource
adequacy and collegial nurse-physician relationships were
significantly
associated with reduced hospitalizations. None of the subscales
were
significant in adjusted models for the antipsychotic outcome.
91. Table 4 summarizes results of bivariate and adjusted logistic
regres-
sion models for the RN outcomes. Controlling for nursing home
and RN
characteristics, the odds ratios in the table indicate that RNs in
nursing
homes with good vs. average work environments, and in nursing
homes with average vs. poor environments, were significantly
less
likely to report job dissatisfaction and to exhibit high burnout,
by fac-
tors of 0.32 and 0.35, respectively. Since these coefficients are
multipli-
cative, the squared odds ratios shown in the table indicate that
RNs in
nursing homes with good vs. poor work environments, were
one-tenth
as likely to be dissatisfied with their jobs, and one-eighth as
likely to
exhibit burnout, as RNs employed in facilities with poor
environments.
All subscales were significantly associated with both outcomes.
Discussion
Nursing homes with better RN work environments had fewer
pressure ulcers and hospitalizations. RNs employed in these
facilities
were significantly less likely to exhibit job dissatisfaction and
burn-
out than RNs employed in facilities with poor environments.
Our sub-
scale analysis showed that multiple components of the work
environment were associated with outcomes we examined, not
just
staffing and resource adequacy. This suggests that, in addition
92. to hav-
ing adequate staffing and resources, other work environment
ele-
ments are necessary to support RNs in providing high quality
care in
nursing homes. And while this study specifically examined RNs,
it is
likely that these same elements also help to support licensed
Table 3
Effects of the work environment composite scale and subscales
on quality measures, adjusting for other nursing home
characteristics.
Quality measures
Percent of long-stay residents
with pressure ulcers (n = 222)a
Percent of long-stay residents
on antipsychotics (n = 230)
Number of hospitalizations
per resident year (n = 244)
Work environment measures b 95% CI p b 95% CI p b 95% CI p
PES-NWI composite scale
Bivariate �0.88* (�1.61, �0.14) .02 �1.42* (�2.67, �0.18)
.03 �0.05 (�0.15, 0.05) .32
Adjusted �0.90* (�1.64, �0.17) .02 �1.10 (�2.32, 0.12) .08
�0.08* (�0.15,�0.001) .05
PES-NWI subscales
93. Nurse participation in organizational affairs
Bivariate �0.59 (�1.34, 0.16) .12 �1.39* (�2.65, �0.13) .03
�0.01 (�0.11, �0.10) .92
Adjusted �0.57 (�1.32, 0.19) .14 �0.92 (�2.15, 0.32) .14
�0.03 (�0.11, 0.04) .39
Nursing foundations for quality of care
Bivariate �0.86* (�1.60, �0.13) .02 �1.34* (�2.58, �0.11)
.03 �0.06 (�0.16, 0.03) .20
Adjusted �0.86* (�1.61, �0.12) .02 �1.01 (�2.23, 0.21) .11
�0.06 (�0.14, 0.02) .12
Nurse manager ability, leadership, and support
Bivariate �0.78* (�1.51,�0.05) .04 �1.22 (�2.45, 0.01) .05
�0.03 (�0.13, 0.63) .48
Adjusted �0.81* (�1.54,�0.08) .03 �0.96 (�2.16, 0.24) .12
�0.06 (�0.13, 0.02) .12
Staffing/resource adequacy
Bivariate �0.65 (�1.42, 0.11) .10 �1.37* (�2.65, �0.08) .04
�0.12* (�0.23, �0.02) .02
Adjusted �0.72 (�1.50, 0.07) .07 �1.14 (�2.44, 0.16) .09
�0.10* (�0.18,�0.02) .01
Collegial nurse-physician relationships
Bivariate �1.47* (�2.27, �0.66) <.001 �0.32 (�1.70, �1.07)
.65 �0.14* (�0.24, �0.03) .01
Adjusted �1.46* (�2.26, �0.66) <.001 �0.28 (�1.63, 1.07) .69
�0.12* (�0.19, �0.04) .005
* Differences were significant at p < .05, as indicated by z-
scores in bivariate and adjusted linear regression models. b
coefficients represent the difference in outcomes between
nursing homes with average vs. poor, and good vs. average
work environments. Adjusted models control for nursing home
ownership type, chain affiliation, Medicare census, Med-
94. icaid census, and RN skill mix. Additional covariates vary by
outcome, as follows: (1) for pressure ulcers, certified nursing
assistant (CNA) staffing was also controlled; (2) for antipsy-
chotics, CNA staffing and presence of Alzheimer's unit were
controlled; and (3) for hospitalizations per resident year,
average Resource Utilization Group (RUG) score, and an
indicator for whether the facility accepts ventilator-dependent
patients were controlled. All models, including bivariate
models, weight the aggregated nursing home work environ-
ment score by the number of respondents per facility using
analytic weights, and control for the number of respondents per
facility. The three categories of the composite Practice
Environment Scale of the Nursing Work Index (PES-NWI), and
the subscales that comprise it, are treated as a linear term; thus,
a one unit change represents the difference between
average and poor environments, and a two unit change
represents the difference between good and poor environments.
CI = confidence interval; p = the probability that the coeffi-
cients are zero.
a Sample sizes vary across outcomes because of missing
outcomes data.
ARTICLE IN PRESS
E.M. White et al. / Geriatric Nursing 00 (2019) 1�7 5
practical nurses (LPNs) and certified nursing assistants (CNAs),
who
provide much of the direct patient care in this setting.
Nursing home leaders often function under tight budgetary con-
straints due to heavy dependence on Medicaid, yet there are still
Table 4
Effects of the work environment composite scale and subscales
on nurse job dissatisfaction a
95. Dissatisfied with job (n =
Work environment measures OR OR2 95% C
PES-NWI composite scale
Bivariate 0.31* 0.10 (0.24, 0.4
Adjusted 0.32* 0.10 (0.24, 0.4
PES-NWI subscales
Nurse participation in organizational affairs
Bivariate 0.39* 0.15 (0.30, 0.5
Adjusted 0.39* 0.15 (0.29, 0.5
Nursing foundations for quality of care
Bivariate 0.37* 0.14 (0.29, 0.4
Adjusted 0.38* 0.15 (0.29, 0.5
Nurse manager ability, leadership, support
Bivariate 0.40* 0.16 (0.31, 0.5
Adjusted 0.41* 0.17 (0.32, 0.5
Staffing/resource adequacy
Bivariate 0.33* 0.11 (0.25, 0.4
Adjusted 0.34* 0.12 (0.25, 0.4
Collegial nurse-physician relationships
Bivariate 0.55* 0.30 (0.40, 0.7
Adjusted 0.56* 0.31 (0.41, 0.7
* Differences significant at p < .05. All estimates are from
adjusted robust multivariate lo
ment Scale of the Nursing Work Index (PES-NWI), and the
subscales that comprise it, are tr
reporting the two outcomes in nursing homes with good vs.
average and average vs. poor
odds of RNs reporting the two outcomes in nursing homes with
96. good vs. poor environments
RN respondents per nursing home; nursing home characteristics
(ownership type, chain af
sex, race, position, years of experience, native language). CI =
confidence interval; p = the pro
a Registered nurse (RN) sample sizes for job dissatisfaction and
burnout differ due to the n
many evidence-based interventions that can improve work
environ-
ments through changes in organizational culture and practi-
ces.6,32,33,47 Strong nursing care foundations were
significantly
associated with the pressure ulcer and nurse outcomes in our
study.
nd burnout, after adjusting for other facility characteristics.
656)a Burnout (n = 577)
I p OR OR2 95% CI p
1) <.001 0.38* 0.14 (0.29, 0.48) <.001
2) <.001 0.35* 0.12 (0.27, 0.46) <.001
1) <.001 0.49* 0.24 (0.37, 0.63) <.001
1) <.001 0.47* 0.22 (0.36, 0.61) <.001
9) <.001 0.40* 0.16 (0.31, 0.51) <.001
1) <.001 0.38* 0.15 (0.29, 0.50) <.001
2) <.001 0.48* 0.23 (0.38, 0.61) <.001
3) <.001 0.47* 0.22 (0.36, 0.61) <.001
4) <.001 0.40* 0.16 (0.31, 0.52) <.001
7) <.001 0.38* 0.15 (0.29, 0.51) <.001
97. 4) <.001 0.48* 0.23 (0.37, 0.62) <.001
7) <.001 0.48* 0.23 (0.36, 0.62) <.001
gistic regression models, in which the 3 categories of the
composite Practice Environ-
eated as a linear term. Thus, odds ratios (OR) indicate the
difference in the odds of RNs
work environments, and the odds ratios squared (OR2) represent
the difference in the
. All models account for clustering within nursing homes, and
control for the number of
filiation, Medicare census, Medicaid census, RN skill mix); and
RN characteristics (age,
bability that the odds ratios are 1.0, which indicates no
difference.
umber of RNs with missing data on the two outcomes.
ARTICLE IN PRESS
6 E.M. White et al. / Geriatric Nursing 00 (2019) 1�7
Multiple nursing care processes are integral to the prevention
and
treatment of pressure ulcers such as risk assessment, skin
surveil-
lance, mobility and positioning, nutrition interventions, and
inconti-
nence management.48 Interventions to support nursing staff in
this
regard include providing regular continuing education
opportunities,
organizing formal preceptor programs to train and mentor new
hires,
and maintaining active quality assurance programs that engage
nurses in identifying and addressing areas for improvement.6
98. Nurse
leadership was also associated with both the pressure ulcer and
nurse outcomes. To provide effective leadership, staff nurses
must
have support from their supervisors, supervisors must have
support
from their director(s) of nursing, and the director(s) of nursing
must
have support from other senior level administrative staff. This
means
offering mentorship and training for nurses to develop
leadership
skills, recognizing employees when work is done well, and
creating a
culture where mistakes are used as learning opportunities
instead of
for criticism or punishment.6
Collegial nurse-physician relationships were associated with the
pressure ulcer, hospitalization, and nurse outcomes, supporting
an
existing literature that has shown effective nurse-physician
commu-
nication to be an important factor in maintaining resident safety
and
preventing avoidable hospitalizations from the nursing
home.49,50
Though the PES-NWI specifically measures communication
between
nurses and physicians, these findings likely also apply to
advanced
practice clinicians, who are playing an increasingly visible role
as
medical providers in nursing homes. Interventions in this
domain
99. include encouraging regular participation of all staff in
interdisciplin-
ary gatherings such as morning rounds and careplan meetings,
and
offering training on best communication practices between
nurses
and medical staff. Finally, nurse participation in organizational
affairs
was associated with both job dissatisfaction and burnout.
Interven-
tions to improve nurse engagement include offering clinical
ladders
and other career development opportunities, involving nurses on
quality improvement committees, leadership working with staff
to
find solutions to problems, and having formal processes for
respond-
ing to employee concerns.6
Some limitations of our study should be noted. First, the cross-
sectional design prevented examination of causal relationships
between the work environment and outcomes. Second, the
facility-
level quality measures did not allow for resident-level
adjustment
beyond what was already built into Nursing Home Compare.
Third,
our nursing home PES-NWI measures are based on a small
number of
RNs per facility, a trade-off of using a state-wide RN sample
rather
than surveying RNs through their employers. The former
approach
offers a clear advantage of reduced response bias at the
employer
level, but also makes it harder to find nursing homes with
100. multiple
respondents, particularly since nursing homes employ far fewer
RNs
than hospitals. We used analytic weights in our linear
regression
models and controlled for the number of RN respondents per
facility
to compensate for heteroscedasticity. Finally, our sample of 245
nurs-
ing homes represents just over 8% of all nursing homes in our
four
states, which may limit generalizability of our findings. Still,
this was
the first study to use a multistate sample of RNs to study the
impact
of work environment in nursing homes.
Conclusions
The work environment is an important area for interventions to
improve nursing staff retention and care quality in nursing
homes.
Nursing home RNs exhibit high rates of job dissatisfaction and
burn-
out which contribute to turnover, a significant problem in this
set-
ting. An extensive body of evidence has already shown that
better
nurse work environments are associated with improved patient
safety and reduced staff burnout and job dissatisfaction in
hospitals.
This study is one of the first to show similar relationships in
nursing
homes and has implications not just for RNs, but also for other
nurs-
ing staff. Interventions to improve work environments reflect
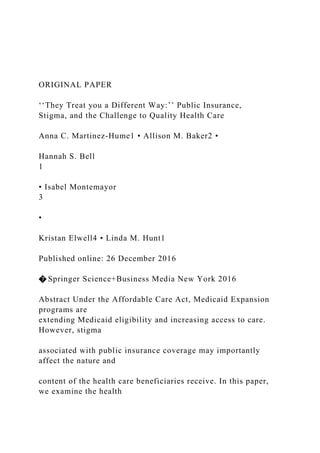
![care stigma experiences described by a group of low-income
public insurance
beneficiaries. They perceive stigma as manifest in poor quality
care and negative
interpersonal interactions in the health care setting. Using an
intersectional
approach, we found that the stigma of public insurance was
compounded with other
sources of stigma including socioeconomic status, race, gender,
and illness status.
Experiences of stigma had important implications for how
subjects evaluated the
quality of care, their decisions impacting continuity of care, and
their reported
ability to access health care. We argue that stigma challenges
the quality of care
provided under public insurance and is thus a public health
issue that should be
addressed in Medicaid policy.
Keywords Stigma � Insurance � Poverty � Healthcare �
Medicaid �
Intersectionality
& Linda M. Hunt
[email protected]
1](data:image/gif;base64,R0lGODlhAQABAIAAAAAAAP///yH5BAEAAAAALAAAAAABAAEAAAIBRAA7)