
Recommended
Recommended
More Related Content
Similar to Copyrighted Material 1 Shrink the Targets Disasters .docx
Similar to Copyrighted Material 1 Shrink the Targets Disasters .docx (16)
More from vanesaburnand
More from vanesaburnand (20)
Recently uploaded
Recently uploaded (20)
Copyrighted Material 1 Shrink the Targets Disasters .docx
- 1. Copyrighted Material 1 Shrink the Targets Disasters from natural sources, from industrial and technolog- ical sources, and from deliberate sources such as terrorism have all increased in the United States in recent decades, and no diminution is in sight.1 Weather disturbances are predicted to increase; low- level industrial accidents continue but threaten to intensify and the threat of cyber attacks on our “critical infrastructure” becomes ever more credible; foreign terrorists have not relaxed and we anxiously await another attack. Cataclysmic fantasies proliferate on movie screens and DVDs, and scholars write books with “collapse,” “ca tastrophe,” “our final hour,” and “worst cases” in their titles. But we have neglected a fundamental response to the trio of dis- aster sources. Instead of focusing only on preventing disasters and coping with their aftermath—which we must continue to do—we should reduce the size of vulnerable targets. Weapons of mass de- 1The evidence for the increase in industrial disasters comes from the Swiss rein-
- 2. surance firm, the world’s largest, Swiss Re. The worldwide figures can be found in its Sigma reports. (Swiss Re 2002) “Man-made disasters” include road and ship- ping accidents, major fires, and aerospace incidents, and the threshold for qualify- ing is 20 deaths, or 50 injured, or 2,000 homeless, or $70 billion in losses, or in- surances losses ranging from $143 million for shipping, $28 billion for aerospace to $35 billion for the rest. Similar criteria are applied to natural disasters. For man- made disasters in the United States, the period from 1970 to 1992 averaged 7.7; 2 Copyrighted Material _ C H A P T E R 1 struction (WMDs) already litter our landscape; terrorists need not sneak them in, and they are more likely to be triggered by natural and industrial disasters than by terrorists. Ninety-ton tank cars of chlorine gas are WMDs that travel daily through our cities; dis- persing the deadly gas via a tornado or hurricane, an industrial ac- cident, or a terrorist’s suitcase bomb would endanger up to seven million people. New Orleans and its surroundings is, or was, our largest port, but it could have been a target one-third the size of
- 3. its pre-Katrina population of some 450,000 souls, and much easier to defend and evacuate. Because of the increased concentration of the electric power industry, our vital electric power grid is so poorly managed that sagging power lines hitting tree branches in Ohio plunged the Northeast into darkness for hours and even days in some areas in 2003. The industry has made its grid a better target for a heat spell, a flood, a hurricane, or a few well-placed small bombs. Deconcentrating the industry would uncouple the vulner- abilities and barely decrease efficiency, as we shall see. Not all of the dangers confronting us can be reduced through downsizing our targets. Some natural hazards we just have to face: we are unlikely to stop settling in earthquake zones, nor can we avoid tsunamis, volcanoes, asteroids, or even tornadoes. Even small targets are at risk in the case of epidemics, and terrorists with bio- logical and radiological weapons can cause such widespread dev- astation that the size of the target is irrelevant. But, except for tornadoes, all these are rare. Devastations from the more common sources such as high winds, water and fire dam- from 1993 to 2001 it was 12.8, a 60 percent rise. (Special tabulation provided by Swiss Re.) Natural disasters rose steadily in this period, well below the man-made
- 4. ones in the 1970s but rising to almost thirty a year for the period 1993 to 2001. Data on terrorist attacks and casualties are harder to come by, but following the end of Algerian, Italian, and Irish terrorist activity in the 1970s and early 1980s, there was a decline. But there has been a rise in the 1990s to the present. The num- ber of “significant” international terrorists attacks has increased eightfold in the last over the last two decades, according to an analysis of U.S. government data presented in the Human Security Report. There has also been a clear but uneven upward trend in the number of casualties from international terror, between 1982 and 2003. (Centre 2005, 32) 3 Copyrighted Material _S H R I N K T H E T A R G E T S age, industrial and technological accidents, and terrorist attacks on large targets can be greatly reduced. It will not be easy, but given our yearly disaster bill in the billions of dollars, it makes economic sense as well as social sense. It will require a change in our mind- set about markets and regulation. Since our current mindset is only
- 5. decades old—it changed quickly from the 1970s on—it is hardly inconceivable that it could not change again. Disasters expose our social structure and culture more sharply than other important events. (Clarke 2005) They reveal starkly the failure of organizations, regulations, and the political system. But we regard disasters as exceptional events, and after a disaster we shore up our defenses and try to improve our responses while leav- ing the target in place. However, as Clarke persuasively argues, dis- asters are not exceptional but a normal part of our existence. To reduce their damage will require probing our social structure and culture to see how these promote our vulnerabilities. We will do this throughout this book in the hope of prodding changes in these areas. Two of the major themes in this work are the inevitable failure of organizations, public and private, to protect us from disasters and the increasing concentration of targets that make the disasters more consequential. There are many explanations for the first theme, organizational failures, but we will highlight one in partic- ular: organizations are tools that can be used for ends other than their official ones. To prevent unwarranted use, we require regula- tion in the private sector and representative governance in the pub- lic sectors. The failure of the political system means ineffective reg-
- 6. ulation. This can be changed. One goal of regulation is to prevent the accumulation of eco- nomic power in private hands. Otherwise, we get the concentration not just of economic power but of hazardous materials, popula- tions in risky areas with inadequate protection, and vulnerabilities in parts of our critical infrastructure such as the Internet, electric power, transportation, and agriculture. (We also need regulation to ensure that the public sector is not wasteful, that standards are ad- equate to protect us, that corruption is minimized, and so on.) The 4 Copyrighted Material _ C H A P T E R 1 third major theme concerns a structural alternative to the concen- trations that endanger us. We encounter it first in the electric power grid and second in the Internet; these are networked systems, rather than hierarchical systems. Networks are decentralized, with mini- mal concentrations of destructive energy and economic power. They are efficient, reliable, and adaptive, which minimizes the
- 7. dangers of organizational failures. In the grid and the Internet, they are being challenged by consolidating forces, but these can be resisted. We explore the advantages of networks in the final chapter, where we examine networks of small firms, and terrorist networks. THE CONVENTIONAL VIEW In contrast to the approach taken here, which is to reduce concen- trations of the things that make us most vulnerable, most efforts ei- ther accept such concentrations as inevitable or don’t notice them at all and focus on responding to disasters, limiting the damages, and preventing disasters. All three strategies are necessary and should be vigorously pursued, but their limitations are apparent. Responding to disasters involves “first responders,” such as po lice, fire, and voluntary agencies. (Lee Clarke calls them “official first responders,” since the friends, family, or coworkers of victims and also passerbys are always the first and most effective respon- ders.) We have not done well here. We are barely equipped for the routine fire, flood, or explosion and fail dramatically with the big and unexpected disasters. Our new Department of Homeland Se- curity is often criticized by the Government Accountability Office (GAO) and public policy organizations for its woefully
- 8. inadequate first-responder funding. The title of a 2003 Council on Foreign Relations task force report summed up the problems: “Emergency Responders: Drastically Underfunded, Dangerously Unprepared.” (Rudman, Clarke and Metzl 2003) This was apparent in the 2005 Katrina hurricane. Furthermore, we have a “panic” model of behavior, which mis takenly limits information, which in turn breeds skepticism on the 5 Copyrighted Material _S H R I N K T H E T A R G E T S part of the public. Years of research on disasters indicates that panic is rare, as is rioting and looting, and that the very first re- sponders are citizens whose capacity for innovative response is im- pressive. The panic model unfortunately legitimates the tendency to centralize responses thus both curtailing citizen responses and interfering with the responses of the lowest-level agencies, such as police, fire, medical teams, and voluntary agencies. Research shows the most effective response comes when such decentralized units
- 9. are free to act on the basis of firsthand information and familiarity with the setting. (Clarke 2002; Quarantelli 1954; Quarantelli 2001; Tierney 2003) The panic model can even make things worse. Disaster expert Kathleen Tierney shows how the media’s penchant for the panic model probably caused unnecessary deaths in the Ka- trina disaster. (Tierney, Bevc, and Kuligowski 2006) Limiting damage involves building codes, which cover structural standards and require protection of hazardous materials, and evac- uation plans. There have been improvements here, but it is unlikely they will ever be enough. Government organizations often do not enforce codes; evacuation plans are unrealistic or unimplemented (as Katrina showed); inventories of hazardous materials (com- monly called hazmats) are not made; local interests defy national standards on building sites (if these even exist); and our Supreme Court has eviscerated floodplain and wetlands regulations that would limit flood damages. Finally, preventing disasters that involve vulnerable targets is the most developed of the three strategies, perhaps because there are more profits for private industry to be found in expensive preven- tion devices than in training and funding first responders or in
- 10. fol- lowing building codes. Here we have alarms and warning systems for natural and industrial dangers; and for terrorism we have bio- chemical snifters and suits, border and airport inspections, covert surveillance of citizens, and encryption for our electronic trans- missions and interception of those of other nations. The economic opportunities here are substantial, so substantial that one angry re- view of the Department of Homeland Security (DHS) after the Ka- trina disasters spoke not of mismanagement, or even graft, but of 6 Copyrighted Material _ C H A P T E R 1 outright “looting” of the public treasury (Klinenberg and Frank 2005). A front-page article in the New York Times about Katrina and the DHS was titled “‘Breathtaking’ Waste and Fraud in Hur- ricane Aid.” (Lipton 2006b) One lawyer for a prominent Wash ington DC law firm was up front about corporate interests: he wrote a newsletter article titled “Opportunity and Risk: Securing Your Piece of the Homeland Security Pie.” (Shenon 2003a; Shenon
- 11. 2003b) It is a very large pie indeed. The Department of Homeland Security is virtually a textbook example of organizational failure that impacts all three of our dis- aster sources. For example, the Federal Emergency Management Agency (FEMA), once a model organization, was moved into the DHS, its budget for natural-disaster management was cut, its au- thority to coordinate emergency responses was taken from it, and it was staffed with inexperienced political appointees. (Staff 2005c) It became an extreme case of “permanently failing organizations” (Meyer and Zucker 1989)—those that we cannot do without but, in addition to the human fallibility of their members, are beset by underfunding in the public sphere, used for ends they are not de- signed for, and shackled with bad rules and regulations. OUR VULNERABILITIES There is little consideration by policy makers of the possibility of re- ducing our vulnerabilities, rather than just prevention, remediation, and damage limitation. (Steven Flynn’s book, America the Vulner- able [2004] is one of the few attempts to explore this. Allenby and Fink [2005] imply target reduction in their discussion of resiliency in societies.) Yet, it would be the most effective in the long run.
- 12. The sources of our vulnerabilities are threefold: • The first are concentrations of energy, such as explosive and toxic substances (largely at industrial storage and pro- cess industries), highly flammable substances (e.g., dry or diseased woods, brush), and dams (one of the concentra- tions we can do little about). 7 Copyrighted Material _S H R I N K T H E T A R G E T S • The second are concentrations of populations (in risky, even if desirable, areas), and especially when high-density populations also contain unnecessarily high concentrations of explosive and toxic substances, such as ruptured oil stor- age tanks in the case of Katrina and propane tank farms in St. Louis that were nearly set off by a huge flood. • The third are concentrations of economic and political power, as with concentrations in the electric power indus- try, in the Internet (e.g., the “monoculture” Microsoft has created with the Windows operating system), and in food production such as beef and milk. The three sources are interrelated. Concentrations of economic and political power allow the concentrations of energy, generally by means of deregulation, and these tend to be where there are concentrations of populations. To give a minor example, deregula-
- 13. tion of the airlines started with President Carter and led initially to more airlines, more competition, and lower fares—all favorable results. But starting in the 1990s, the number of airlines decreased as the industry reconcentrated because of weakened antitrust con- cerns in the government. The airlines concentrated their routes through the hub-and-spoke system, which encouraged the use of ever larger aircraft as smaller flights were channeled into one hub, and passengers were then flown en masse to key destinations. Be- cause of the concentrated hub-and-spoke system, simple industrial accidents, computer breakdowns, or false alarms at major airports now can paralyze whole sections of the nation. The attempted ter- rorist attack on the Los Angeles airport in December 1999 would have disrupted far more traffic than one under the regulated sys- tem. And when nature, software failures, or terrorists bring down the new airplanes carrying 550 passengers, we will realize our vul- nerability to the inevitable failures of airplanes, pilots, and control- lers has increased just a bit. But the concentrated airline industry is only a relatively small in- stance of the increased size of our targets; we will examine larger ones in the following chapters, starting with the first of our trio of
- 14. mounting threats, natural forces. The forces have not increased 8 Copyrighted Material _ C H A P T E R 1 much (how much is in dispute), but our vulnerable concentrations have greatly swollen. I will argue in the final chapter that our em- phasis on the terrorist threat is exaggerated. It is a threat, but not as certain or consequential as those of natural forces and industrial and technological accidents. Were the terrorist threat to disappear, I would still recommend all the deconcentrations presented in this volume. THE ARGUMENT I will start with the easiest argument in chapter 2: natural disasters, with emphasis on floods and hurricanes. Thanks to their increas- ing prosperity in the past half-century and a fortunate lull in pat- terns of extreme weather, people have moved closer to the water- front. Their concentrated settlements are imperfectly regulated and
- 15. thus are vulnerable to storms while lacking evacuation provisions. Perverse incentives in the form of subsidized insurance and federal reconstruction funds, combined with powerful local growth poli- cies, increase our losses from natural disasters every decade. We will consider the Gulf Coast, a Mississippi River flood, and the nu- merous vulnerabilities of California. Part 2 concerns the formal governmental response to disasters. Initially these were mainly natural disasters, and chapter 3 exam- ines the government’s response to disasters past. Surprisingly, the substantial role the federal government plays in helping with disas- ters is only about sixty years old, and I will examine that short his- tory and in particular the role of FEMA, the key disaster agency. We will see that for a time it was an effective agency, one of the few ef- fective ones that we will examine, but that twice in its history it has been hijacked for other purposes by presidents Ronald Reagan and George W. Bush. A model agency in the mid-1990s, it was made dysfunctional in 2001. We shall see why in chapters 3 and 4. Disasters have other causes besides nature, and chapter 4 con- siders our response to terrorist threats (and the implications for FEMA). While the nation has always had domestic terrorist threats,
- 16. 9 Copyrighted Material _S H R I N K T H E T A R G E T S the scope of the 9/11 attacks prodded the federal government to do something more concerted than leaving the threat of foreign ter- rorist to be handled by intelligence agencies, border patrols, the FBI, and local police. This attempt by our government gives us the short and sorry history of the Department of Homeland Security, the largest federal reorganization ever. Its history illustrates well the difficulty of creating effective organizations. We should not expect too much of organizations, but the DHS is extreme in its dysfunctions. As with all organizations, the DHS has been used by its masters and outsiders for purposes that are be- yond its mandate, and the usage of the DHS has been inordinate. One major user of the DHS is Congress. While Congress is the arm of the government that is closest to the people, it is also the one that is most influenced by corporations and local interest groups that do not have the interests of the larger community in mind. Chapter 4, on the DHS and the intelligence reorganization, is mainly focused on the government, but our vulnerabilities are in- creasing in the private sector, and that is what we turn to in the four chapters of part 3.
- 17. Much of our critical infrastructure is in the hands of large cor- porations and, like our government, these private organizations are prone to error, in the form of industrial accidents as well as their failure to provide ample protection from natural and terror- ist disasters. These risks are national in scope, rather than confined to an area impacted by hurricanes or floods. The private sector contains some of the largest vulnerable concentrations with cata- strophic potential. We will start with the nuclear power industry, in chapter 5, which carries the fearsome potential of a nuclear meltdown that could, as one famous report said just before the Three Mile Island near miss, irradiate an area half the size of Pennsylvania. Organi- zational and regulatory failures abound in this poorly regulated enterprise. Beyond the inevitable but prosaic failures of organiza- tions, however, we will encounter here very good evidence of what will be called “executive failure,” where the chief executive ignores the warnings of his staff and forces them to conduct unsafe prac- Copyrighted Material _10 C H A P T E R 1 tices. Given the size of the potential disaster in this case, such
- 18. ex- ecutive failures are frightening. There is a sinister side to organiza- tional failures—not all are just prosaic—and where national safety is concerned, we should be especially concerned. As Diane Vaughan, the chronicler of space-shuttle failures, points out, this “dark side” of organizations is missing from the conventional literature. (Vaughan 1999) We shall also see how the regulatory agency bows to industry pressure and cuts back on inspections. And, of course, there is the inept attempt to deal with the terrorist threat. Next we will examine the chemical industry in chapter 6, a vital industry that has provided better living through chemistry even while we suffer from its mostly hidden depredations. Despite its claims, it has done little to reduce the threat of terrorism, and its targets are perhaps the most poorly defended and the easiest to at- tack with garden-variety weapons. The danger is not just in the lack of protection from terrorists but in the huge concentrations of explosive and toxic materials, since these are also vulnerable to natural disasters, as in the case of oil spills because of Katrina. The concentrations are also vulnerable to industrial accidents, where the steady death toll could rise substantially as concentration of hazardous materials increases, along with the pressures to increase the use of unqualified contract workers in risky “turnaround” op- erations.
- 19. The chemical industry’s record on self-regulation is not good. By claiming that they meet their trade association standards of low pollution, chemical companies escape federal inspection and pol- lute more. Bigger is not safer in this industry; the larger companies and the larger plants pollute more and have more accidents. Con- gress has been unable to set higher standards; useful bills are locked up in Republican-controlled committees. The Supreme Court de- clared that New Jersey’s higher standards are invalid; the lower federal standards will prevail. Pressure from public interest groups has made the industry more responsive to some product safety and pollution concerns, so there is encouragement here, but these groups are not pursuing the more consequential issues of safer processes and smaller hazmat inventories. Copyrighted Material _S H R I N K T H E T A R G E T S 11 The third conventional industry, and the single most vital one in our critical infrastructure—electrical utilities—is considered in chapter 7. The individual plants that produce electricity are vul- nerable to our three sources of disaster but only moderately so. We
- 20. will be much more concerned with the electric power grid. Con- centration in the industry, as a result of deregulation that speeded up in the late 1990s, has resulted in business plans by the utilities that minimize investment in transmission but instead perversely overload the burdened, unmodernized grid with long-distance trans- missions that reap small benefits in cost in return for large risks of cascading failures and a large increase in vulnerability to deliber- ate attacks, accidents, and weather. Industry self-regulation again encourages cheating on safety and reliability. Another aspect of the grid that we will examine closely is the ef- fects of deregulation. Before extensive deregulation, which did not lower the price of electricity but increased industry profits, the grid was remarkably efficient and reliable, self-adjusting to a limited degree, and able to handle increases in transmission without in- creases in blackouts. This illustrates the potential for network forms of organization rather than our traditional hierarchical forms, which will also be explored in chapters 8 and 9. These forms offer more reliability and resiliency, and less vulnerability, and could be models for other aspects of our critical infrastructure. The public is aware of the scale and degree of the natural disas- ter hazard and the failures of FEMA and even the DHS, but it is largely unaware of the hazardousness of the chemical, nuclear,
- 21. and electric power industries. It is even less aware of the hazard poten- tial of the Internet, examined in chapter 8, our final industry chap- ter. As with the power grid, there is a resilient aspect to the Inter- net and World Wide Web but also a vulnerability that could make accidents or deliberate attacks very consequential. The vulnerabil- ity lies largely in the monopoly power of the Microsoft Windows operating system and the threatened consolidation of internet ser- vice providers (ISPs). Even more than the power grid, the Internet is a remarkable, vast, decentralized, resilient system that could be a model for some of our other critical industries. The threats to it Copyrighted Material _12 C H A P T E R 1 come from lack of regulation as a common carrier—we will ex- amine this “open access” or “net neutrality” issue—and the profit potentials that come with concentration. These open the Net to easier attack, not just from viruses and hackers but from terrorists. Terrorists could disable power plants, including nuclear ones, tamper with the files of intelligence agencies, read the plans of
- 22. the Department of Defense, and assault the banking sector. Hackers already have done these things. Part 4 contains the final chapter. It brings together several of the themes and explores the costs and opportunities of deconcentrat- ing our most vulnerable targets. One crucial question is whether the attempt to reduce the size of targets entails a loss of efficiency that is presumably gained with the economies of scale that come with large corporations. An obvious answer is that, given the dis- aster potential, we should be prepared to pay a bit more to reduce our vulnerability. The costs of Katrina, the 2003 northeastern power blackout, the Baltimore railroad tunnel fire, and many other such disasters greatly outweighed the expenditures that could have prevented them. A more subtle answer is to distinguish dependen- cies from interdependencies in our highly interconnected world. Many dependencies can and should be avoided, and instead we should reorganize to maximize the values of interdependency. In some notable cases, this increases economic efficiency as well as re- ducing vulnerabilities. Chapter 9 will also revisit the terrorist threat. In the industrial chapters I have placed it more or less on a par with threats from nature and from industrial accidents. But in chapter 9 I will ex- plore the idea that we have spent too much on the very remote pos-
- 23. sibility of another massive terrorist attack, and with little benefit given our basic vulnerabilities; and far too little on natural and in- dustrial disasters, which are certainties; and next to nothing on tar- get reduction. I examine the reasons why we are much more likely to experience small-scale foreign terrorist attacks than the massive ones involving weapons of mass destruction we spend most on pre- venting, and I argue that neither of these can receive anything like adequate protection. What will matter most is deconcentrating vulnerable targets. Copyrighted Material _S H R I N K T H E T A R G E T S 13 Finally there is the question of whether it is even possible to deconcentrate populations, hazardous materials, and powerful or- ganizations such as Microsoft and the electric power industry. Throughout the book I will suggest, in connection with each risky system, that this is quite possible, and I bring the arguments to- gether at the end. Political changes over the last three or four de- cades have made it more difficult, but these are reversible.2 2We will not explore the ways in which the poor and minorities bear most of the
- 24. brunt of disasters. They are indeed the population most “targeted” in natural and industrial disasters. The classic work on this is Bullard 1990. See also Mohai and Bryant 1992; Schnaiberg 1983; and for prescient work dealing with oil and chem- ical plants near New Orleans see Allen 2003. A classic broader view is Erikson 1994. For a quite different view, see “Richer is sicker versus richer is safer,” a chap ter in Wildavksy 1988, 59 –75. 153 CHAPTER 6 HAZARD, VULNERABILITY, AND RISK ANALYSIS This chapter describes how preimpact conditions act together with event-specific conditions to produce a disaster’s physical and social impacts. These disaster impacts can be reduced by emergency management interventions. In addition, this chapter discusses how emergency managers can assess the preimpact conditions that produce disaster vulnerability within their communities. The chapter concludes with a discussion of vulnerability dynamics and methods for disseminating hazard/vulnerability data. Introduction A disaster occurs when an extreme event exceeds a community’s ability to cope with that event.
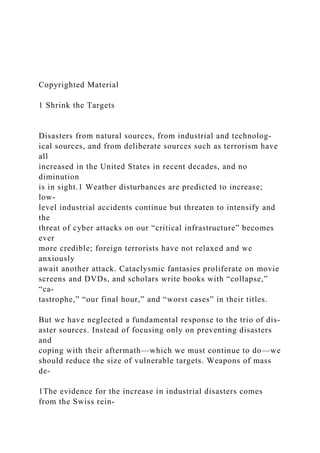
- 25. Understanding the process by which natural disasters produce community impacts is important for four reasons. First, information from this process is needed to identify the preimpact conditions that make communities vulnerable to disaster impacts. Second, information about the disaster impact process can be used to identify specific segments of each community that will be affected disproportionately (e.g., low income households, ethnic minorities, or specific types of businesses). Third, information about the disaster impact process can be used to identify the event- specific conditions that determine the level of disaster impact. Fourth, an understanding of disaster impact process allows planners to identify suitable emergency management interventions. The process by which disasters produce community impacts can be explained in terms of models proposed by Cutter (1996) and Lindell and Prater (2003). Specifically, Figure 6-1 indicates the effects of a disaster are determined by three preimpact conditions—hazard exposure, physical vulnerability, and social vulnerability. There also are three event-specific conditions, hazard event characteristics, improvised disaster responses, and improvised disaster recovery. Two of the
- 26. event-specific conditions, hazard event characteristics and improvised disaster responses, combine with the preimpact conditions to produce a disaster’s physical impacts. The physical impacts, in turn, combine with improvised disaster recovery to produce the disaster’s social impacts. Communities can engage in three types of emergency management interventions to ameliorate disaster impacts. Physical impacts can be reduced by hazard mitigation practices and emergency preparedness practices, whereas social impacts can be reduced by recovery preparedness practices. The following sections describe the components of the model in greater detail. Specifically, the next section will describe the three preimpact conditions— hazard exposure, physical vulnerability, and social vulnerability. This section will be followed by sections discussing hazard event characteristics and improvised disaster responses. The fourth section will discuss disasters’ physical impacts, social impacts, and improvised disaster recovery. The last section will discuss three types of strategic interventions, hazard mitigation practices, emergency preparedness practices, and recovery preparedness practices.
- 27. Preimpact Conditions Hazard Exposure Hazard exposure arises from people’s occupancy of geographical areas where they could be affected by specific types of events that threaten their lives or property. For natural hazards, this exposure is caused by living in geographical areas as specific as floodplains that sometimes extend only a few feet beyond the floodway or as broad as the Great Plains of the Midwest where tornadoes can strike anywhere over an area of hundreds of thousands of square miles. For technological hazards, exposure can arise if people move into areas where they could be exposed to explosions or hazardous materials releases. In principle, hazard exposure can be measured by the probability of occurrence of a given event magnitude, 154 but these exceedance probabilities can be difficult to obtain for hazards about which the historical data are insufficient to reliably estimate the probability of very unusual events. For example, many areas of the US have meteorological and hydrological data that are limited to
- 28. the past 100 years, so the estimation of extreme floods requires extrapolation from a limited data series. Moreover, urbanization of the watersheds causes the boundaries of the 100-year floodplains to change in ways that may be difficult for local emergency managers to anticipate. Even more difficult to estimate are the probabilities of events, such as chemical and nuclear reactor accidents, for which data are limited because each facility is essentially unique. In such cases, techniques of probabilistic safety analysis are used to model these systems, attach probabilities to the failure of system components, and synthesize probabilities of overall system failure by mathematically combining the probabilities of individual component failure. Figure 6-1. Disaster Impact Model. Source: Adapted from Lindell and Prater (2003)
- 29. The greatest difficulties are encountered in attempting to estimate the probabilities of social hazards such as terrorist attacks because the occurrence of these events is defined by social system dynamics that cannot presently be modeled in the same way as physical systems. That is, the elements of social systems are difficult to define and measure. Moreover, the interactions of the system elements have multiple determinants and involve complex lag and feedback effects that are not well understood, let alone precisely measured. Indeed, there are significant social and political constraints that limit the collection of data on individuals and groups. These constraints further inhibit the ability of scientists to make specific predictions of social system behavior. Physical Vulnerability Human vulnerability. Humans are vulnerable to environmental extremes of temperature, pressure, and chemical exposures that can cause death, injury, and illness. For any hazard agent—water, wind, ionizing radiation, toxic chemicals, infectious agents—there often is variability in the physiological Emergency management interventions
- 31. Improvised disaster response Event-specific conditions Social impacts Physical impacts 155 response of the affected population. That is, given the same level of exposure, some people will die, others will be severely injured, still others slightly injured, and the rest will survive unscathed. Typically, the most susceptible to any environmental stressor will be the very young, the very old, and those with weakened immune systems. Agricultural vulnerability. Like humans, agricultural plants and animals are also vulnerable to environmental extremes of temperature, pressure, chemicals, radiation, and infectious agents. Like humans, there are differences among individuals within each plant and animal population. However,
- 32. agricultural vulnerability is more complex than human vulnerability because there is a greater number of species to be assessed, each of which has its own characteristic response to each environmental stressor. Structural vulnerability. Structural vulnerability arises when buildings are constructed using designs and materials that are incapable of resisting extreme stresses (e.g., high wind, hydraulic pressures of water, seismic shaking) or that allow hazardous materials to infiltrate into the building. The construction of most buildings is governed by building codes intended to protect the life safety of building occupants from structural collapse—primarily from the dead load of the building material themselves and the live load of the occupants and furnishings— but do not necessarily provide protection from extreme wind, seismic, or hydraulic loads. Nor do they provide an impermeable barrier to the infiltration of toxic air pollutants. Social Vulnerability The social vulnerability perspective (e.g., Cannon, Twigg & Rowell, 2003; Cutter, Boruff & Shirley, 2003) represents an important extension of previous
- 33. theories of hazard vulnerability (Burton, et al., 1978). As a concept, social vulnerability has been defined in terms of people’s “capacity to anticipate, cope with, resist and recover from the impacts of a natural hazard” (Wisner, Blakie, Canon & Davis, 2004, p. 11). Whereas people’s physical vulnerability refers to their susceptibility to biological changes (i.e., impacts on anatomical structures and physiological functioning), their social vulnerability refers to their susceptibility to behavioral changes. As will be discussed in greater detail below, these consist of psychological, demographic, economic, and political impacts. The central point of the social vulnerability perspective is that, just as people’s occupancy of hazard prone areas and the physical vulnerability of the structures in which they live and work are not randomly distributed, neither is social vulnerability randomly distributed—either geographically or demographically. Thus, just as variations in structural vulnerability can increase or decrease the effect of hazard exposure on physical impacts (property damage and casualties), so too can variations in social vulnerability. Social vulnerability varies across communities and also across households within
- 34. communities. It is the variability in vulnerability that is likely to be of greatest concern to local emergency managers because it requires that they identify the areas within their communities having population segments with the highest levels of social vulnerability. Event-Specific Conditions Hazard Event Characteristics Hazard impacts often are difficult to characterize because a given hazard agent may initiate a number of different threats. For example, tropical cyclones (also known as hurricanes or typhoons) can cause casualties and damage through wind, rain, storm surge, and inland flooding (Bryant, 1991). Volcanoes can impact human settlements through ash fall, explosive eruptions, lava flows, mudflows and floods, and forest fires (Perry & Lindell, 1990; Saarinen & Sell, 1985; Warrick, et al., 1981). However, 156 once these distinct threats have been distinguished from each other, each can be characterized in terms of six significant characteristics. These are the speed of onset,
- 35. availability of perceptual cues (such as wind, rain, or ground movement), the intensity, scope, and duration of impact, and the probability of occurrence. The speed of onset and availability of perceptual cues affect the amount of forewarning that affected populations will have to complete emergency response actions (Gruntfest, et al., 1978; Lindell, 1994c). In turn, these attributes determine the extent of casualties among the population and the degree of damage to structures in the affected area. A hazard’s impact intensity can generally be defined in terms of the physical materials involved and the energy these materials impart. The physical materials involved in disasters differ in terms of their physical state—gas (or vapor), liquid, or solid (or particulate). In most cases, the hazard from a gas arises from its temperature or pressure. Examples include hurricane or tornado wind (recall that the atmosphere is a mixture of gases), which is hazardous because of overpressures that can inflict traumatic injuries directly on people. High wind also is hazardous because it can destroy structures and accelerate debris that can itself cause traumatic injuries. Alternatively, the hazard from a gas might arise from its toxicity,
- 36. as is the case in some volcanic eruptions. Liquids also can be hazardous because of their toxicity, but the most common liquid hazard is water. It is hazardous to structures because of the pressure it can exert and is hazardous to living things when it fills the lungs and prevents respiration. Lava is solid rock that has been liquefied by extreme heat and therefore is hazardous to people and structures because of its thermal energy. Solids also can be hazardous if they take the form of particulates such as airborne volcanic ash or floodborne mud. These are particularly significant because they can leave deposits that have impacts of long duration. The scope of impact defines the number of affected social units (e.g., individuals, households, and businesses). The probability of occurrence (per unit of time) is another important characteristic that affects disaster impacts indirectly because more probable hazards are likely to mobilize communities to engage in hazard mitigation and emergency preparedness measures to reduce their vulnerability (Prater & Lindell, 2000). Improvised Disaster Response
- 37. Disaster myths commonly portray disaster victims as dazed, panicked, or disorganized but, as will be discussed at greater length in Chapter 8, people actually respond in a generally adaptive manner when disasters strike. Adaptive response is often delayed because normalcy bias delays people’s realization that an improbable event is, in fact, occurring to them. Further delays occur because people have limited information about the situation and, therefore, seek confirmation of any initial indications of an emergency before initiating protective action. In addition, the vast majority of people respond in terms of their customary social units—especially their households and neighborhoods—which usually consumes time in developing social organizations that can cope with the disaster’s demands. Contrary to stereotypes of individual selfishness, disaster victims often devote considerable effort to protecting others’ persons and property. Accordingly, there is considerable convergence on the disaster impact area, as those in areas nearby move in to offer assistance. When existing organizations seem incapable of meeting the needs of the emergency response, they expand to take on new members, extend to take on new tasks, or new
- 38. organizations emerge (Dynes, 1970). Improvised Disaster Recovery Once the situation has stabilized to the point that the imminent threat to life and property has abated, disaster-stricken communities must begin the long process of disaster recovery. Immediate tasks 157 in this process include damage assessment, debris clearance, reconstruction of infrastructure (electric power, fuel, water, wastewater, telecommunications, and transportation networks), and reconstruction of buildings in the residential, commercial, and industrial sectors. Improvised disaster assistance is derived primarily from resources provided by individuals and organizations within the community. The victims themselves might have financial (e.g., savings and insurance) as well as tangible assets (e.g., property) that are undamaged by hazard impact. As one might expect, low-income victims tend to have lower levels of savings, but they also are more likely to be victims of insurance redlining and, thus, have been forced
- 39. into contracts with insurance companies that go bankrupt after the disaster. Thus, even those who plan ahead for disaster recovery can find themselves without the financial resources they need (Peacock & Girard, 1997). Alternatively, victims can promote their recovery by bringing in additional funds through overtime employment or by freeing up the needed funds by reducing their consumption below preimpact levels. Friends, relatives, neighbors, and coworkers can assist recovery through financial and in-kind contributions, as can community based organizations (CBOs) and local government. In addition, the latter also can provide assistance by means of tax deductions or deferrals. Disaster Impacts As noted earlier, disaster impacts comprise physical and social impact. The physical impacts of disasters include casualties (deaths and injuries) and property damage, and both vary substantially across hazard agents. The physical impacts of a disaster are usually the most obvious, easily measured, and first reported by the news media. Social impacts, which include psychosocial, demographic, economic, and political impacts, can develop over a long period of time and
- 40. can be difficult to assess when they occur. Despite the difficulty in measuring these social impacts, it is nonetheless important to monitor them, and even to predict them if possible, because they can cause significant problems for the long-term functioning of specific types of households and businesses in an affected community. A better understanding of disasters’ social impacts can provide a basis for preimpact prediction and the development of contingency plans to prevent adverse consequences from occurring. Physical Impacts Casualties. According to Noji (1997b), hurricanes produced 16 of the 65 greatest disasters of the 20th Century (in terms of deaths) and the greatest number of deaths from 1947-1980 (499,000). Earthquakes produced 28 of the greatest disasters and 450,000 deaths, whereas floods produced four of the greatest disasters and 194,000 deaths. Other significant natural disasters include volcanic eruptions with nine of the greatest disasters and 9,000 deaths, landslides with four of the greatest disasters and 5,000 deaths, and tsunamis with three of the greatest disasters and 5,000 deaths. There is significant
- 41. variation by country, with developing countries in Asia, Africa, and South America accounting for the top 20 positions in terms of number of deaths from 1966-1990. Low-income countries suffer approximately 3,000 deaths per disaster, whereas the corresponding figure for high-income countries is approximately 500 deaths per disaster. Moreover, these disparities appear to be increasing because the average annual death toll in developed countries declined by at least 75% between 1960 and 1990, but the same time period saw increases of over 400% in developing countries (Berke, 1995). There often are difficulties in determining how many of the deaths and injuries are “caused by” a disaster. In some cases it is impossible to determine how many persons are missing and, if so, whether this is due to death or unrecorded relocation. The size of the error in estimates of disaster death tolls can be seen in the fact that for many of the most catastrophic events the number of deaths is rounded to the 158 nearest thousand and some even are rounded to the nearest ten
- 42. thousand (Noji, 1997b). Estimates of injuries are similarly problematic (see Langness, 1994; Peek- Asa, et al., 1998; Shoaf, et al., 1998, regarding conflicting estimates of deaths and injuries attributable to the Northridge earthquake). Even when bodies can be counted, there are problems because disaster impact may be only a contributing factor to casualties with pre-existing health conditions. Moreover, some casualties are indirect consequences of the hazard agent as, for example, with casualties caused by structural fires following earthquakes (e.g., burns) and destruction of infrastructure (e.g., illnesses from contaminated water supplies). Damage. Losses of structures, animals, and crops also are important measures of physical impacts, and these are rising exponentially in the United States (Mileti, 1999). However, the rate of increase is even greater in developing countries such as India and Kenya (Berke, 1995). Such losses usually result from physical damage or destruction of property, but they also can be caused by losses of land use to chemical or radiological contamination or loss of the land itself to subsidence or erosion. Damage to the built environment can be classified broadly as
- 43. affecting residential, commercial, industrial, infrastructure, or community services sectors. Moreover, damage within each of these sectors can be divided into damage to structures and damage to contents. It usually is the case that damage to contents results from collapsing structures (e.g., hurricane winds failing the building envelope and allowing rain to destroy the furniture inside the building). Because collapsing buildings are a major cause of casualties as well, this suggests that strengthening the structure will protect the contents and occupants. However, some hazard agents can damage building contents without affecting the structure itself (e.g., earthquakes striking seismically-resistant buildings whose contents are not securely fastened). Thus, risk area residents may need to adopt additional hazard adjustments to protect contents and occupants even if they already have structural protection. Perhaps the most significant structural impact of a disaster on a stricken community is the destruction of households’ dwellings. Such an event initiates what can be a very long process of disaster recovery for some population segments. According to Quarantelli (1982a), people typically pass through
- 44. four stages of housing recovery following a disaster. The first stage is emergency shelter, which consists of unplanned and spontaneously sought locations that are intended only to provide protection from the elements, typically open yards and cars after earthquakes (Bolin & Stanford, 1991, 1998). The next step is temporary shelter, which includes food preparation and sleeping facilities that usually are sought from friends and relatives or are found in commercial lodging, although “mass care” facilities in school gymnasiums or church auditoriums are acceptable as a last resort. The third step is temporary housing, which allows victims to re-establish household routines in nonpreferred locations or structures. The last step is permanent housing, which re-establishes household routines in preferred locations and structures. Households vary in the progression and duration of each type of housing and the transition from one stage to another can be delayed unpredictably, as when it took nine days for shelter occupancy to peak after the Whittier Narrows earthquake (Bolin, 1993). Particularly significant are the problems faced by lower income households, which tend to be headed disproportionately by females and racial/ethnic
- 45. minorities. Such households are more likely to experience destruction of their homes because of preimpact locational vulnerability. This is especially true in developing countries such as Guatemala (Peacock, Killian & Bates, 1987), but also has been reported in the US (Peacock & Girard, 1997). The homes of these households also are more likely to be destroyed because the structures were built according to older, less stringent building codes, used lower quality construction materials and methods, and were less well maintained (Bolin & Bolton, 1986). Because lower income households have fewer 159 resources on which to draw for recovery, they also take longer to transition through the stages of housing, sometimes remaining for extended periods of time in severely damaged homes (Girard & Peacock, 1997). In other cases, they are forced to accept as permanent what originally was intended as temporary housing (Peacock, et al., 1987). Consequently, there may still be low- income households in temporary sheltering and temporary housing even after high-income households all
- 46. have relocated to permanent housing (Berke, et al., 1993; Rubin, Sapperstein & Barbee, 1985). As is the case with estimates of casualties, estimates of losses to the built environment are prone to error. Damage estimates are most accurate when trained damage assessors enter each building to assess the percent of damage to each of the major structural systems (e.g., roof, walls, floors) and the percentage reduction in market valuation due to the damage. Early approximate estimates are obtained by conducting “windshield surveys” in which trained damage assessors drive through the impact area and estimate the extent of damage that is visible from the street, or by conducting computer analyses using HAZUS (National Institute of Building Sciences, 1998). These early approximate estimates are especially important in major disasters because detailed assessments are not needed in the early stages of disaster recovery and the time required to conduct them on a large number of damaged structures using a limited number of qualified inspectors would unnecessarily delay the community recovery process. Other important physical impacts include damage or contamination to cropland, rangeland, and
- 47. woodlands. Such impacts may be well understood for some hazard agents but not others. For example, ashfall from the 1980 Mt. St. Helens eruption was initially expected to devastate crops and livestock in downwind areas, but no significant losses materialized (Warrick, et al., 1981). There also is concern about damage or contamination to the natural environment (wild lands) because these areas serve valuable functions such as damping the extremes of river discharge and providing habitat for wildlife. In part, concern arises from the potential for indirect consequences such as increased runoff and silting of downstream river beds, but many people also are concerned about the natural environment simply because they value it for its own sake. Social Impacts For many years, research on the social impacts of disasters consisted of an accumulation of case studies, but two research teams conducted comprehensive statistical analyses of extensive databases to assess the long-term effects of disasters on stricken communities (Friesma, et al., 1979; Wright, et al., 1979). The more comprehensive Wright, et al. (1979) study used
- 48. census data from the 1960 (preimpact) and 1970 (post-impact) censuses to assess the effects of all recorded disasters in the United States. The authors concurred with earlier findings by Friesma, et al. (1979) in concluding no long-term social impact of disasters could be detected at the community level. In discussing their findings, the authors acknowledged their results were dominated by the types of disasters occurring most frequently in the United States—tornadoes, floods, and hurricanes. Moreover, most of the disasters they studied had a relatively small scope of impact and thus caused only minimal disruption to their communities even in the short term. Finally, they noted their findings did not preclude the possibility of significant long-term impacts upon lower levels such as the neighborhood, business, and household. Nonetheless, their findings called attention to the importance of the impact ratio—the amount of damage divided by the amount of community resources—in understanding disaster impacts. They hypothesized long-term social impacts tend to be minimal in the US because most hazard agents have a relatively small scope of impact and tend to strike undeveloped
- 49. areas more frequently than intensely developed areas simply because there are more of the former than the latter. Thus, the numerator of the 160 impact ratio tends to be low and local resources are sufficient to prevent long-term effects from occurring. Even when a disaster has a large scope of impact and strikes a large developed area (causing a large impact ratio in the short term), state and federal agencies and NGOs (e.g., American Red Cross) direct recovery resources to the affected area, thus preventing long- term impacts from occurring. For example, Hurricane Andrew inflicted $26.5 billion in losses to the Miami area, but this was only 0.4% of the US GDP (Charvériat, 2000). Recovery problems described in the studies reported in Peacock, Morrow and Gladwin (1997) were determined more by organizational impediments than by the lack of resources. Psychosocial impacts. Research reviews conducted over a period of 25 years have concluded that disasters can cause a wide range of negative psychological responses (Bolin 1985; Gerrity & Flynn, 1997;
- 50. Houts, Cleary & Hu, 1988; Perry & Lindell, 1978). These include psychophysiological effects such as fatigue, gastrointestinal upset, and tics, as well as cognitive signs such as confusion, impaired concentration, and attention deficits. Psychological impacts include emotional signs such as anxiety, depression, and grief. They also include behavioral effects such as sleep and appetite changes, ritualistic behavior, and substance abuse. In most cases, the observed effects are mild and transitory—the result of “normal people, responding normally, to a very abnormal situation” (Gerrity & Flynn 1997, p. 108). Few disaster victims require psychiatric diagnosis and most benefit more from a crisis counseling orientation than from a mental health treatment orientation, especially if their normal social support networks of friends, relatives, neighbors, and coworkers remain largely intact. However, there are population segments requiring special attention and active outreach. These include children, frail elderly, people with pre-existing mental illness, racial and ethnic minorities, and families of those who have died in the disaster. Emergency workers also need attention because they often work long hours without rest, have
- 51. witnessed horrific sights, and are members of organizations in which discussion of emotional issues may be regarded as a sign of weakness (Rubin, 1991). However, as Chapter 11 will indicate, there is little evidence of emergency workers needing directive therapies either. The negative psychological impacts described above, which Lazarus and Folkman (1984) call emotion focused coping, generally disrupt the social functioning of only a very small portion of the victim population. Instead, the majority of disaster victims engage in adaptive problem focused coping activities to save their own lives and those of their closest associates. Further, there is an increased incidence in prosocial behaviors such as donating material aid and a decreased incidence of antisocial behaviors such as crime (Drabek, 1986; Mileti, et al., 1975; Siegel, et al., 1999). In some cases, people even engage in altruistic behaviors that risk their own lives to save the lives of others (Tierney, et al., 2001). There also are psychological impacts with long-term adaptive consequences, such as changes in risk perception (beliefs in the likelihood of the occurrence a disaster and its personal consequences for the
- 52. individual) and increased hazard intrusiveness (frequency of thought and discussion about a hazard). In turn, these beliefs can affect risk area residents’ adoption of household hazard adjustments that reduce their vulnerability to future disasters. However, these cognitive impacts of disaster experience do not appear to be large in aggregate, resulting in modest effects on household hazard adjustment (see Lindell & Perry, 2000 for a review of the literature on seismic hazard adjustment, and Lindell & Prater 2000; Lindell & Whitney, 2000; and Whitney, Lindell & Nguyen, 2004 for more recent empirical research). Demographic impacts. The demographic impact of a disaster can be assessed by adapting the demographic balancing equation, Pa – Pb = B – D + IM – OM, where Pa is the population size after the disaster, Pb is the population size before the disaster, B is the number of births, D is the number of deaths, IM is the number of immigrants, and OM is the number of emigrants (Smith, Tayman & Swanson, 2001). 161 The magnitude of the disaster impact, Pa – Pb, is computed for the population of a specific geographical
- 53. area and two specific points in time. Ideally, the geographical area would correspond to the disaster impact area, Pb would be immediately before disaster impact, and Pa would be immediately after disaster impact. In practice, population data are available for census divisions (census block, block group, tract, or larger area), so a Geographical Information System (GIS) must be used to estimate the impact on the impact area. Moreover, population data are likely to be most readily available from the decennial censuses, so the overall population change and its individual demographic components—births, deaths, immigration, and emigration—are likely to be estimated from that source (e.g., Wright, et al., 1979). On rare occasions, special surveys have been conducted in the aftermath of disaster (e.g., Peacock, Morrow & Gladwin, 1997). The limited research available on demographic impacts (Friesma, et al., 1979; Wright, et al., 1979) suggests disasters have negligible demographic impacts on American communities, but the highly aggregated level of analysis in these studies does not preclude the possibility of significant impacts at lower levels of aggregation (census tracts, block groups, or blocks). Although it is logically possible
- 54. that disasters could affect the number of births, it does not seem likely that the effect would be large. Moreover, as noted in the previous section on physical impacts, the number of deaths from disasters in the United States has been small relative to historical levels (e.g., the 6000 deaths in the 1900 Galveston hurricane were approximately 17% of the city’s population) or to the levels reported in developing countries. The major demographic impacts of disasters are likely to be the (temporary) immigration of construction workers after major disasters and the emigration of population segments that have lost housing. In many cases, the housing-related emigration is also temporary, but there are documented cases in which housing reconstruction has been delayed indefinitely— leading to “ghost towns” (Comerio, 1998). Other potential causes of emigration are psychological impacts (belief that the likelihood of disaster recurrence is unacceptably high), economic impacts (loss of jobs or community services), or political impacts (increased neighborhood or community conflict). Economic impacts. The property damage caused by disaster impact creates losses in asset values
- 55. that can be measured by the cost of repair or replacement (Committee on Assessing the Costs of Natural Disasters, 1999). Disaster losses in United States are initially borne by the affected households, businesses, and local government agencies whose property is damaged or destroyed. However, some of these losses are redistributed during the disaster recovery process. There have been many attempts to estimate the magnitude of direct losses from individual disasters and the annual average losses from particular types of hazards (e.g., Mileti, 1999). Unfortunately, these losses are difficult to determine precisely because there is no organization that tracks all of the relevant data and some data are not recorded at all (Charvériat, 2000; Committee on Assessing the Costs of Natural Disasters, 1999). For insured property, the insurers record the amount of the deductible and the reimbursed loss, but uninsured losses are not recorded so they must be estimated—often with questionable accuracy. The ultimate economic impact of a disaster depends upon the disposition of the damaged assets. Some of these assets are not replaced, so their loss causes a reduction in consumption (and, thus, a
- 56. decrease in the quality of life) or a reduction in investment (and, thus, a decrease in economic productivity). Other assets are replaced—either through in-kind donations (e.g., food and clothing) or commercial purchases. In the latter case, the cost of replacement must come from some source of recovery funding, which generally can be characterized as either intertemporal transfers (to the present time from past savings or future loan payments) or interpersonal transfers (from one group to another at a given time). Some of the specific mechanisms for financing recovery include obtaining tax deductions or 162 deferrals, unemployment benefits, loans (paying back the principal at low- or no-interest), grants (requiring no return of principal), insurance payoffs, or additional employment. Other sources include depleting cash financial assets (e.g., savings accounts), selling tangible assets, or migrating to an area with available housing, employment, or less risk (in some cases this is done by the principal wage earner only). In addition to direct economic losses, there are indirect losses
- 57. that arise from the interdependence of community subunits. Research on the economic impacts of disasters (Alesch, et al., 1993; Dacy & Kunreuther, 1969; Dalhamer & D’Sousa, 1997; Durkin, 1984; Gordon, et al., 1995; Kroll, et al., 1991; Lindell & Perry, 1998; Nigg, 1995; Tierney, 1997a) suggests the relationships among the social units within a community can be described as a state of dynamic equilibrium involving a steady flow of resources, especially money. Specifically, a household’s linkages with the community are defined by the money it must pay for products, services, and infrastructure support. This money is obtained from the wages that employers pay for the household’s labor. Similarly, the linkages that a business has with the community are defined by the money it provides to its employees, suppliers, and infrastructure in exchange for inputs such as labor, materials and services, and electric power, fuel, water/wastewater, telecommunications, and transportation. Conversely, it provides products or services to customers in exchange for the money it uses to pay for its inputs. It also is important to recognize the financial impacts of recovery (in addition to the financial
- 58. impacts of emergency response) on local government. Costs must be incurred for tasks such as damage assessment, emergency demolition, debris removal, infrastructure restoration, and re-planning stricken areas. In addition to these costs, there are decreased revenues due to loss or deferral of sales taxes, business taxes, property taxes, personal income taxes, and user fees. Political impacts. There is substantial evidence that disaster impacts can cause social activism resulting in political disruption, especially during the seemingly interminable period of disaster recovery. The disaster recovery period is a source of many victim grievances and this creates many opportunities for community conflict, both in the US (Bolin 1982, 1993) and abroad (Bates & Peacock 1988). Victims usually attempt to recreate preimpact housing patterns, but it can be problematic for their neighbors if victims attempt to site mobile homes on their own lots while awaiting the reconstruction of permanent housing. Conflicts arise because such housing usually is considered to be a blight on the neighborhood and neighbors are afraid the “temporary” housing will become permanent. Neighbors also are pitted
- 59. against each other when developers attempt to buy up damaged or destroyed properties and build multifamily units on lots previously zoned for single family dwellings. Such rezoning attempts are a major threat to the market value of owner-occupied homes but tend to have less impact on renters because they have less incentive to remain in the neighborhood. There are exceptions to this generalization because some ethnic groups have very close ties to their neighborhoods, even if they rent rather than own. Attempts to change prevailing patterns of civil governance can arise when individuals sharing a grievance about the handling of the recovery process seek to redress that grievance through collective action. Consistent with Dynes’s (1970) typology of organizations, existing community groups with an explicit political agenda can expand their membership to increase their strength, whereas community groups without an explicit political agenda can extend their domains to include disaster-related grievances. Alternatively, new groups can emerge to influence local, state, or federal government agencies and legislators to take actions that they support and to terminate actions that they disapprove.
- 60. Indeed, such was the case for Latinos in Watsonville, California following the Loma Prieta earthquake (Tierney, et al., 2001). Usually, community action groups pressure government to provide additional 163 resources for recovering from disaster impact, but may oppose candidates’ re-elections or even seek to recall some politicians from office (Olson & Drury, 1997; Prater & Lindell, 2000; Shefner, 1999). The point here is not that disasters produce political behavior that is different from that encountered in normal life. Rather, disaster impacts might only produce a different set of victims and grievances and, therefore, a minor variation on the prevailing political agenda (Morrow & Peacock, 1997). Emergency Management Interventions As Figure 6-1 indicates, there are three types of preimpact interventions that can effect reductions in disaster impacts. Hazard mitigation and emergency preparedness practices directly reduce a disaster’s physical impacts (casualties and damage) and indirectly reduce its social impacts, whereas recovery
- 61. preparedness practices directly reduce a disaster’s social impacts. Improvised disaster response actions also directly affect disasters’ physical impacts but, by their very nature, are likely to be much less effective than planned interventions. Similarly, improvised recovery assistance directly affects disasters’ social impacts but is likely to be less effective than systematic recovery preparedness practices. Figure 6-1 includes the four “phases” of emergency management—mitigation, preparedness, response, and recovery—but makes it clear there is a complex relationship between them. In reality, these “phases” might better be called functions, since they are neither discrete nor temporally sequential. Later chapters will address hazard mitigation (Chapter 7), emergency preparedness (Chapter 9), emergency response (Chapter 10), and disaster recovery (Chapter 11) in greater detail. However, this section will provide a brief description of each of these functions and their interrelationships. Hazard Mitigation Practices One way to reduce the physical impacts of disasters is to adopt hazard mitigation practices. These
- 62. can be defined as preimpact actions that protect passively against casualties and damage at the time of hazard impact (as opposed to an active emergency response). Hazard mitigation includes hazard source control, community protection works, land use practices, building construction practices, and building contents protection. Hazard source control acts directly on the hazard agent to reduce its magnitude or duration. For example, patching a hole in a leaking tank truck prevents a gas from being released. Community protection works, which limit the impact of a hazard agent on an entire community, include dams and levees that protect against floodwater and sea walls that protect against storm surge. Land use practices reduce hazard vulnerability by avoiding construction in areas that are susceptible to hazard impact. The use of the term land use practices instead of land use regulations is deliberate. Landowners can adopt sustainable practices whether or not they are required to do so. Thus, government agencies can encourage the adoption of appropriate land use practices by providing incentives to encourage development in safe locations, establishing sanctions to prevent development in hazardous locations, or
- 63. engaging in risk communication to inform landowners about the risks and benefits of development in locations throughout the community. Hazard mitigation can also be achieved through building construction practices that make individual structures less vulnerable to natural hazards. Here too, the use of the term building construction practices rather than building codes is deliberate because building owners can adopt hazard resistant designs and construction materials in the absence of government intervention. Disaster resistant construction practices include elevating structures out of flood plains, designing structures to respond more effectively to lateral stresses, and providing window shutters to protect against wind pressure and debris impacts. Government agencies can encourage the adoption of appropriate building construction 164 practices by providing incentives to encourage appropriate designs and materials, establishing code requirements for hazard resistant building designs and materials, or informing building owners about the
- 64. risks and benefits of different building designs and materials. Finally, hazard mitigation can be achieved by contents protection strategies such as elevating appliances above the base flood elevation or bolting them to walls to resist seismic forces. Emergency Preparedness Practices Another way to reduce a disaster’s physical impacts is to adopt emergency preparedness practices, which are preimpact actions that provide the human and material resources needed to support active responses at the time of hazard impact (Lindell & Perry, 2000). The first step in emergency preparedness is to use community hazard/vulnerability analysis (HVA) to identify the emergency response demands that must be met by performing four basic emergency response functions—emergency assessment, hazard operations, population protection, and incident management (Lindell & Perry, 1992, 1996b). Emergency assessment consists of actions that define the potential scope of the disaster impacts (e.g., projecting hurricane wind speed) whereas hazard operations consists of short-term actions to protect property through expedient hazard mitigation actions initiated during an emergency (e.g.,
- 65. sandbagging around structures). Population protection actions protect people from impact (e.g., warning and evacuation) and incident management actions activate and coordinate the emergency response (e.g., communication among responding agencies). The next step is to determine which community organization will be responsible for accomplishing each function (Federal Emergency Management Agency, 1996b). Once functional responsibilities have been assigned, each organization must develop procedures for accomplishing those functions. Finally, the organizations must acquire response resources (personnel, facilities, and equipment) to implement their plans and they need to maintain preparedness for emergency response through continued planning, training, drills, and exercises (Daines, 1991). Recovery Preparedness Practices Just as emergency preparedness practices are preimpact actions intended to develop the human and material resources needed to support an active emergency response, recovery preparedness practices are preimpact actions that are intended to develop the financial and material resources needed to support a
- 66. prompt and effective disaster recovery. First of all, households and businesses need to prepare for disaster recovery by purchasing hazard insurance because this will provide the money they need to rebuild damaged structures and replace destroyed contents. However, hazard insurance varies significantly in its availability and cost—flood, hurricane, and earthquake insurance being particularly problematic (Kunreuther & Roth, 1998). Moreover, some ethnic groups cannot afford the rates of high quality insurance companies or are denied coverage altogether (Peacock & Girard, 1997). In addition, the governments of hazard prone communities need to prepare for actions including impact assessment, debris management, infrastructure restoration, housing recovery, economic recovery, and linkage to hazard mitigation. It seems to be commonly thought that the development of disaster recovery operations plans (ROPs) can be delayed until after disaster strikes, but practitioners and researchers agree that community disaster recovery is faster and more effective when it is based on a plan that has been developed prior to disaster impact (Geis, 1996; Olson, Olson & Gawronski, 1998; Schwab,
- 67. et al., 1998; Wilson, 1991; Wu & Lindell, 2004). There are six important features of a preimpact ROP. First, it should define a disaster recovery organization. Second, it should identify the location of temporary housing because resolving this issue can cause conflicts that delay consideration of longer-term issues of permanent housing and distract 165 policymakers altogether from hazard mitigation (Bolin & Trainer, 1978; Bolin, 1982). Third, the plan should indicate how to accomplish essential tasks such as damage assessment, condemnation, debris removal and disposal, rezoning, infrastructure restoration, temporary repair permits, development moratoria, and permit processing because all of these tasks must be addressed before the reconstruction of permanent housing can begin (Schwab, et al., 1998). Fourth, preimpact recovery plans also should address the licensing and monitoring of contractors and retail price controls to ensure victims are not exploited and also should address the jurisdiction’s administrative powers and resources, especially the level of
- 68. staffing that is available. It is almost inevitable that local government will have insufficient staff to perform critical recovery tasks such as damage assessment and building permit processing, so arrangements should be made to borrow staff from other jurisdictions (via pre-existing Memoranda of Agreement) and to use trained volunteers such as local engineers, architects, and planners. Fifth, these plans also need to address the ways in which recovery tasks will be implemented at historical sites (Spennemann & Look, 1998). Finally, preimpact recovery plans should recognize the recovery period as a unique time to enact policies for hazard mitigation and make provision for incorporating this objective into the recovery planning process. Conducting Community Hazard/Vulnerability Analyses The model described in the previous pages provides a framework for understanding how hazard agent characteristics produce physical and social impacts that can be ameliorated by emergency management interventions. The next section will describe how local emergency managers can use this framework to guide assessments of their communities’ exposure to specific hazards and vulnerability to
- 69. physical and social impacts. Although this section focuses on how to conduct hazard/vulnerability analyses (HVAs), it is important to remember who should be involved in the process. The HVAs provides critical information for the community’s hazard mitigation, emergency preparedness, and recovery preparedness practices so it should involve a wide range of the community’s emergency management stakeholders (Pearce, 2003). This is an important reason for the LEMC to conduct the community HVA through the LEMC’s Hazard/Vulnerability Analysis subcommittee. Mapping Natural Hazard Exposure States and local jurisdictions across the country vary in their exposure to the hazards described in Chapter 5. Consequently, an important objective for a local emergency manager is to identify the hazards that his or her community should set as priorities for its emergency management program. There are many useful sources of information about the regional incidence of these hazards, one of which is the set of maps contained in the Federal Emergency Management Agency’s (1997) Multi Hazard Identification
- 70. and Risk Assessment. This source has an extensive set of maps describing exposure to natural hazards and also addresses some technological hazards. The maps of natural hazard exposures contained in Multi Hazard Identification and Risk Assessment can be supplemented by visiting the Web sites of FEMA (www.fema.gov), the US Geological Survey (www.usgs.gov), and the National Weather Service (www.nws.noaa.gov). These maps provide a good start toward assessing the potential impacts of disasters, but they have three limitations. First, many of these large scale maps are designed to compare the relative risk of broad geographical areas (i.e., regions of the country). This information enables local emergency managers to identify the hazards that could strike their jurisdictions, but it does not provide enough resolution to tell them which areas within their jurisdictions are most likely to be struck by a disaster. For example, a coastal county might be exposed to hurricanes but, as Chapter 5 indicated, only 166 part of the jurisdiction is likely to experience significant damage. Consequently, smaller scale maps are
- 71. needed to assess exposure of different areas to storm surge, inland flooding, and high wind. Second, these maps vary from one hazard to another in terms of whether they define risk areas in terms of event magnitudes or in terms of recurrence intervals. For example, hurricane risk area maps identify areas that are expected to be affected by Category 1-5 hurricanes. However, these maps provide no information about the probability that each of these different hurricane intensities would occur. By contrast, US Geological Survey earthquake hazard maps plot the peak ground acceleration (PGA) with a 2% probability of exceedance in 50 years. Thus, these maps provide useful information about the areas in which buildings are most likely to collapse and some indication likelihood of a disaster. However, as will be explained in the section on physical vulnerability, trained engineers would be needed to use this quantitative information to assess the probabilities of building failure. Third, these maps are insufficient for local HVAs because local emergency managers also need to assess the relative risk of different hazards for a given geographical area. That is, emergency managers
- 72. need to know whether their jurisdictions are at risk for certain hazards, but they also need to know what is the likelihood of a flood in comparison to a tornado, an earthquake, or a toxic chemical release. As a result of these limitations, local emergency managers must often settle for qualitative comparisons of the relative risk of different hazards. That is, they must typically categorize the probability of disaster impact as high, medium, or low (Federal Emergency Management Agency, 1996b). Such categorization provides only a “rough screen” for determining which hazards require the most attention, but this limitation is often more apparent than real because many hazards impose similar demands on the community, especially during the emergency response phase. Specifically, the equipment and methods used for emergency assessment and hazard operations might differ among the meteorological, hydrological, geophysical, and hazardous materials hazards, but the equipment and methods used for population protection and incident management will be quite similar. Consequently, differences in hazard probability are often unimportant because preparedness for one provides
- 73. preparedness for many, if not all, other hazards. Nonetheless, many mitigation measures are hazard- specific, so an understanding of the relative risk from different hazards can provide valuable guidance in determining which investments are most likely to reduce a community’s vulnerability. Mapping Hazmat Exposures Incidents involving fires, explosions, or chemical releases can be initiated by internal (accident or sabotage) or external (geophysical, meteorological, or hydrological events, or terrorist attacks) causes. The types of hazards that can occur at a chemical facility, their initiating events, their consequences, and their likelihoods of occurrence can be assessed using hazard analysis (Huebner, et al., 2000). This process begins by identifying dangerous chemicals (i.e., those that are threats because of their flammability, reactivity, or toxicity), their locations, and the quantities stored at those locations. Once the chemical inventory has been developed, this information can be used to assess the threats these chemicals pose to the facility, its workers, its neighbors, and the environment. In the case of Extremely Hazardous
- 74. Substances (EHSs) defined under SARA Title III, Vulnerable Zones (VZs) can be computed using data on the chemical’s toxicity, its quantity available for release, the type of spill (liquid or gaseous), the postulated release duration (e.g., 10 minutes), assumed meteorological conditions (wind speed and atmospheric stability), and terrain (urban or rural). Available methods include manual computations (US Environmental Protection Agency, 1987), ALOHA (Federal Emergency Management Agency, no date, a, see information about CAMEO at www.epa.gov/ceppo/cameo), or RMP*Comp at 167 yosemite.epa.gov/oswer/ceppoweb.nsf/content/ rmp-comp.htm). Once the radii of the VZs for the different chemicals have been computed, these can be overlaid onto a map with the release point in the center of the circle and the radius drawn around it (see Figure 6-2). Emergency managers also should work with their LEPCs to identify the highway, rail, water, and air routes though which hazardous materials are transported. Once these routes have been identified, the
- 75. number of tank trucks, railroad tankcars, and barges carrying each type of hazardous material can be counted in a commodity flow study. Information about hazardous materials transportation can be found on the US DOT Web site (hazmat.dot.gov) and specific guidance for commodity flow studies is found at hazmat.dot.gov/hmep/guide_flow_surveys.pdf. Once the chemicals being transported have been identified, analysts can use the same procedures that were used for fixed site facilities. As Figure 6-2 indicates, this will lead to the construction of rectangular VZs surrounding the transportation routes. The facility and transportation route VZs can then be examined to identify areas of residential, commercial, and industrial land use (see Lindell, 1995, for an analysis of hazardous waste transportation to an incinerator). Figure 6-2. Vulnerable Zones around fixed-site facility and transportation route.
- 76. Source: Adapted from Lindell (2006) If VZs for the transportation routes have not been prepared before an incident occurs, the North American Emergency Response Guidebook (hazmat.dot.gov/ohmform.htm#erg) can be used to approximate them. This document contains a table listing the principal chemicals commonly found in transportation, each chemical’s identification number, and the emergency response guide that should be used to provide technical assistance in responding to a spill. In addition, the table identifies the most dangerous chemicals and directs emergency responders to a Table of Initial Isolation and Protective Action Distances that should be used to determine where protective action (either evacuation or shelter in- place) should be implemented. Emergency managers should understand that the Emergency Response
- 77. Guidebook classifies releases only as small or large, so use of the procedures in the Technical Guidance for Hazards Analysis or more advanced methods identified in the Handbook of Chemical Hazard Analysis Procedures is preferred to the table in the Emergency Response Guidebook. Town of Buckley Hazmat Inc. H ig h w a y 1 0 1 Fixed site facility Facility Vulnerable Zone Transportation route Vulnerable Zone Hazmat transportation route
- 78. H ig h w a y 1 0 1 168 A special case of hazmat exposures arises in connection with nuclear power plants. The NRC conducted extensive analyses to define the emergency planning zones (EPZs) that should be designated around these facilities. The NRC’s analyses led to the establishment of a 10 mile radius plume inhalation EPZ in which state and local authorities should be prepared for people to evacuate or shelter in-place to avoid inhalation exposure and direct radiation from a radioactive plume (US Nuclear Regulatory Commission, 1978). In addition, there is a 50 mile radius ingestion pathway EPZ in which authorities
- 79. should prepare to monitor water, milk, and food (especially leafy green vegetables) for contamination. Mapping Exposure to Secondary Hazards Emergency managers should recall that some disaster impacts can initiate others. As noted in Chapter 5, earthquakes can cause surface faulting, ground failure, landslides, fires, dam failures, and hazardous materials releases in addition to the expected structural failures caused by ground shaking. One method of identifying areas exposed to multiple hazards is to use a GIS to overlay the areas subject to these different hazards. This is accomplished by entering all of the data on primary and secondary hazard exposures and special facilities into a GIS that creates separate layers for fault lines; areas prone to the highest levels of ground shaking, subsidence, and landsliding; hazardous facility Vulnerable Zones; and locations of sensitive facilities. Next, these layers are intersected to produce composite maps displaying the areas subject to multiple hazards. Finally, the layers identifying the locations of residential, commercial, and industrial areas, and sensitive facilities are overlaid to produce the final maps. The most
- 80. common secondary hazards of the events described in Chapter 5 are listed in Table 6-1. Table 6-1. Secondary Hazards. Primary Hazard Secondary Hazards Severe storms Floods, tornadoes, landslides Extreme summer weather Wildfires Tornadoes Toxic chemical or radiological materials releases Hurricane wind Toxic chemical or radiological materials releases Wildfires Landslides (on hillsides in later rains) Floods Toxic chemical or radiological materials releases Storm surge Toxic chemical or radiological materials releases Tsunamis Toxic chemical or radiological materials releases Volcanic eruptions Floods, wildfires, tsunamis Earthquakes Fires, floods (dam failures), tsunami, landslides, toxic chemical or radiological materials releases Landslides Tsunami Assessing Physical Vulnerability Information on hazard exposure needs to be supplemented with information on physical
- 81. vulnerability of structures and people. This makes it necessary to identify the types of structures and populations that are located in the areas exposed to environmental hazards. Structural Vulnerability to Wind, Seismic, and Water Forces Structures can be vulnerable to environmental hazards because of inadequate designs, inadequate construction materials, or both. Older homes have been constructed under earlier building codes and most neighborhoods are relatively homogeneous with respect to age, so identifying older neighborhoods in hazard-prone areas will help set priorities of emergency management interventions. For example, many areas of the country have homes, built during the early part of the 20th Century using unreinforced masonry (brick walls constructed without steel reinforcing rods), that are especially vulnerable to 169 earthquakes. Similarly, older homes are usually less weathertight, so they are much more prone to infiltration of hazardous materials. There are three major issues in assessing structural
- 82. vulnerability. First is the question of whether the structure has the strength or resilience to withstand environmental forces such as wind, seismicity, or water. In this case, the concern is about the impact on the structure itself and, consequently, the loss of function and the time and cost of rebuilding. The second issue concerns the ability of the structure to protect the contents. This issue is distinct from the first one because in earthquakes, for example, buildings that survive ground shaking without damage can transmit the motion to light fixtures, cabinets, and furniture—possibly damaging these items. The third issue concerns the ability of the structure to protect the occupants. This is especially important in connection with hazardous materials because they can infiltrate into a structure and kill the occupants without damaging the building. Once the areas at risk from environmental hazards have been identified, emergency managers should identify the types of residential, commercial, and industrial land uses located within them. It is particularly important to determine if there are any facilities within each VZ that have highly vulnerable populations. A list of such facilities is listed in Table 6-2 and
- 83. important characteristics of the facility users are listed in Table 6-3. These characteristics make it much more problematic to evacuate facility occupants than households (Vogt, 1991). In addition, it is important to identify the location of critical infrastructure facilities (see Table 6-4). Table 6-2. Facilities With Highly Vulnerable Populations. HEALTH RELATED Hospitals Nursing homes Halfway houses (drug, alcohol, mental retardation) Mental institutions PENAL Jails Prisons Detention camps Reformatories ASSEMBLY & ATHLETIC Auditoriums
- 84. Theaters Exhibition halls Gymnasiums Athletic stadiums or fields AMUSEMENT & RECREATION Beaches Camp/conference centers Amusement parks/fairgrounds/race courses Campgrounds/Recreational Vehicle parks Parks/lakes/rivers Golf courses Ski resorts Community recreation centers RELIGIOUS Churches/synagogues Evangelical group centers HIGH DENSITY RESIDENTIAL
- 85. Hotels/motels Apartment/condominium complexes Mobile home parks Dormitories (college, military) Convents/monasteries TRANSPORTATION Rivers/lakes Dam locks/toll booths Ferry/railroad/bus terminals COMMERCIAL Shopping centers Central business districts Commercial/industrial parks EDUCATIONAL Day care centers Preschools/kindergartens
- 86. Elementary/secondary schools Vocational/business/specialty schools Colleges/universities Source: Lindell and Perry (1992). 170 Of course, the assessment of structural vulnerability usually involves all three issues. For riverine flooding and hurricane storm surge, structures—especially concrete structures with well-anchored foundations—resist battering waves to protect the structure and provide the height to escape the rising water that could threaten contents and occupants. In other cases, it is the strength of construction in resisting wind loads (tornadoes and hurricanes), blast forces (explosions and volcanic eruptions) and ground shaking (earthquakes) that protects the structure, contents, and occupants. For chemical, radiological, and volcanic ash threats, it is the tightness of construction in preventing the infiltration of outside (contaminated) air into the structure that is the important protective feature. Finally, in the case of
- 87. exposure to a cloud of radioactive material, the construction material can provide shielding from penetrating radiation and from surface contamination. Table 6-3. Characteristics of Special Facility Users. Characteristics Of Users Special Considerations Mobility of users Ambulatory Require close supervision Nonambulatory Require life support Permanent residence of users Facility residents Residents of the impact area, but not of the facility (e.g., prison guards) Transients Periods of use Days of week/hours of day Special events User density Concentrated Dispersed
- 88. Sheltering in place Highly effective Moderately effective Minimally or not effective Transportation support Would use own vehicles Require buses or other high occupancy vehicles Require ambulances Source: Lindell and Perry (1992). In high wind (including tornadoes and hurricanes) and explosions (usually technological in origin, but also including some volcanic eruptions), a substantial increase in air pressure can cause structures to collapse. Such structural failures are caused by deficiencies in either design or materials, or both (American Institute of Architects, 1995; Institute for Business and Home Safety, 1997). Fortified homes (see www.ibhs.org) provide for installation of connections and braces to reinforce roofs and gable-end walls against wind attack. In addition to positive pressure on upwind walls, high wind creates negative pressure, or suction, as it is forced to flow up and over the roof. This suction is greatest in flat roofs, intermediate in gable-end roofs (which
- 89. slope in two directions), and least in hipped roofs (which slope in four directions). Suction tends to lift the roof from the walls unless resisted by adequate connections to the walls—which in turn, must have adequate connections to the foundation. Adequate designs and materials also provide protection to building openings such as windows and doors, thus preventing the wind from pressurizing the interior and adding to the stress on roof and walls. The need for window and sliding glass door shutters is widely recognized because the shutters resist the direct pressure of the wind and the impact of flying debris. However, door reinforcement is also important— especially for double-wide (two-car) garage doors that are highly susceptible to failure because their great width allows the wind to deflect them inward and pull the rollers out of their tracks. 171 Table 6-4. Infrastructure Facilities. Facility Type Examples Water Pumping stations and pipelines
- 90. Sewer Pumping stations and pipelines Electric power Generating stations and power lines Liquid (e.g., oil) and gas (e.g. natural gas) fuels Pumping stations and pipelines Telecommunications Broadcast studios, transmission towers Cellular telephone towers Telephone switching centers and telephone lines Transportation Bus/truck terminals and roads Rail yards and rail lines Sea and inland marine ports Airports Public safety and health Police and fire stations Ambulance garages Hospitals Similar observations apply to earthquakes; building damage typically results from the lateral pressures (ground shaking, surface faulting, and soil failure) exerted against a structure that was designed principally to resist the vertical loads resulting from the weight of the occupants, furniture, upper stories,
- 91. and roof (American Institute of Architects, 1992). Rigid structures such as unreinforced masonry are extremely vulnerable, whereas wood frame dwellings are much safer. In the latter case, there might be rigid portions of a structure, such as brick chimneys, that separate from the rest of the structure and collapse into the living area. In addition, glass from broken windows, falling pictures and mirrors, the toppling of unsecured furniture, and other flying debris are safety hazards. For hurricanes, structures on the open coast must be of sufficiently sturdy construction that they can resist the direct impact of storm surf as well as the force of extremely high winds. However, both riverine flooding and hurricane storm surge also require the structure to have foundations anchored well enough to resist scouring by water currents that can undermine building foundations and cause structural collapse. Additional protection can be provided by expedient floodproofing that uses waterproof construction materials, sealing of cracks, provision of valves on sewer lines, steel bulkheads for lower- level openings, and sump pumps to eject seepage (US Office of Emergency Preparedness, 1972). As with hurricane surge and riverine flooding, volcanic