Tree biomass & litterfall in Indian cities
•Download as DOCX, PDF•
0 likes•38 views

Tree biomass & litterfall in Indian cities using literature survey fro green buildings association & action w.r.t. tree planting/ SWM.

Recommended
Recommended
More Related Content
What's hot
What's hot (17)
Similar to Tree biomass & litterfall in Indian cities
Similar to Tree biomass & litterfall in Indian cities (20)
More from Utkarsh Ghate
More from Utkarsh Ghate (16)
Recently uploaded
Recently uploaded (20)
Tree biomass & litterfall in Indian cities
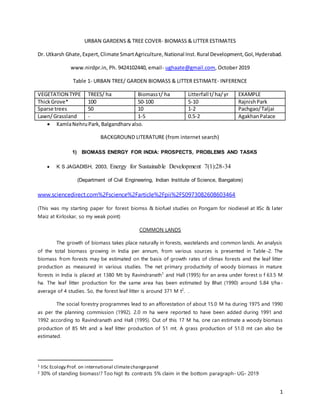
- 1. 1 URBAN GARDENS & TREE COVER- BIOMASS & LITTER ESTIMATES Dr. Utkarsh Ghate,Expert,Climate SmartAgriculture,National Inst.Rural Development,GoI,Hyderabad. www.nirdpr.in, Ph. 9424102440, email- ughaate@gmail.com, October 2019 Table 1- URBAN TREE/ GARDEN BIOMASS & LITTER ESTIMATE- INFERENCE VEGETATION TYPE TREES/ ha Biomasst/ ha Litterfall t/ha/yr EXAMPLE ThickGrove* 100 50-100 5-10 RajnishPark Sparse trees 50 10 1-2 Pachgao/Taljai Lawn/Grassland - 1-5 0.5-2 AgakhanPalace KamlaNehruPark,Balgandharvalso. BACKGROUND LITERATURE (from internet search) 1) BIOMASS ENERGY FOR INDIA: PROSPECTS, PROBLEMS AND TASKS K S JAGADISH, 2003, Energy for Sustainable Development 7(1):28-34 (Department of Civil Engineering, Indian Institute of Science, Bangalore) www.sciencedirect.com%2Fscience%2Farticle%2Fpii%2FS0973082608603464 (This was my starting paper for forest biomss & biofuel studies on Pongam for niodiesel at IISc & later Maiz at Kirloskar, so my weak point) COMMON LANDS The growth of biomass takes place naturally in forests, wastelands and common lands. An analysis of the total biomass growing in India per annum, from various sources is presented in Table-2. The biomass from forests may be estimated on the basis of growth rates of climax forests and the leaf litter production as measured in various studies. The net primary productivity of woody biomass in mature forests in India is placed at 1380 Mt by Ravindranath1 and Hall (1995) for an area under forest o f 63.5 M ha. The leaf litter production for the same area has been estimated by Bhat (1990) around 5.84 t/ha- average of 4 studies. So, the forest leaf litter is around 371 M t2 . . The social forestry programmes lead to an afforestation of about 15.0 M ha during 1975 and 1990 as per the planning commission (1992). 2.0 m ha were reported to have been added during 1991 and 1992 according to Ravindranath and Hall (1995). Out of this 17 M ha, one can estimate a woody biomass production of 85 Mt and a leaf litter production of 51 mt. A grass production of 51.0 mt can also be estimated. 1 IISc Ecology Prof. on international climatechangepanel 2 30% of standing biomass!? Too higt Its contrasts 5% claim in the bottom paragraph- UG- 2019
- 2. 2 Weeds in agricultural lands also lead to about 80 Mt assuming a pessimistic estimate of 0.5 t/ ha. It is also useful to estimate the biomass in village forests. In one of the village studies Ravindranath et al report a standing biomass of about 0.83 t/ head. Extending this to the total rural population of India of about 650.0 m, there is a standing biomass of 540 Mt. Assuming an annual growth of 5%, the wood growth per annum is 27 mt. A leaf litter cum grass growth of 27 Mt may also be estimated. It has been observed that the wastelands in India have a significant coverage of exotic tree species known as Prosopis Juliflora3 . This has the property of rapid regeneration in alluvial and black soils. The four southern states have a waste land of 28.6 m hectares and assuming that 10% of this to be covered by Prosopis, whose yield is estimated to be 15 t/ha per year, a woody biomass growth of 43 Mt can be considered. Again assuming 5 t/ha of leaf litter and grass, a leafy biomass of 14 Mt may be estimated. Taking the estimate of wastelands of India at 90 M ha, we may assume a pessimistic figure of 2 t/ha of grass cum leaf biomass i.e. 180 Mt. Table-2: Total biomass growth per annum in India WOODY BIOMASS (mt) LEAFY BIOMASS (mt) OTHER BIOMASS (FUEL) (mt) FOREST 138.04 371.0 - SOCIAL FORESTRY 85.0 102.0 - AGRICULTURE - 412.4 171.3 WEEDS - 80.0 - VILLAGE FORESTS 27.0 27.0 - WASTELANDS (PROSOPIS) 43.0 14.3 - OTHER WASTELANDS - 180.0 - ROADSIDE TREES 14.4 - - TOTAL 307.4 mt5 1186.7 mt 171.3 mt GRAND TOTAL 1665.4 mt6 2) Carbon sequestrationin Pune University Campus with specialreference to Geographicalinformation system January 2013, Hamed Haghparast, Azam Sadat Delbari, D. K. Kulkarni Abstract ABSTRACT The potential of urban vegetation towards mitigation of Carbon dioxide as the most dominant green house gas was studied in Pune city. It is second big city in the state of Maharashtra. According to the recorded data from Pune University campus field survey and 3 Vedi/ surangi Babhool- Marathi name 4 Typo- its 1380 by lastpagetext, at 20 ton/ ha, which is bareminimum. It can be in fact * 25. Times, at50 t/ ha. 5 Actually its 1550 M t min. including1380 for 65 M ha, as said above.Its ridiculous,for the author, editor & me, I noted it now, after 15 years pastusing it @ 2005-2010!A BIG error! I am shamed. 6 Above total needs to be revised to 2780 M t when the 1st left column total is corrected to 1,550 M t.
- 3. 3 geographical information system (GIS)analyzes, Dalbergia melanoxylon and Gliricidia sepium are the most dominant species in terms of carbon sequestration, whereas species such as Ficus bengalensis and Samania saman, Cocos nucifera and Delonixr egia were categorized next to this two species. 106.4 tonnes per hectare was the highest recorded sequestration volume for Dalbergia melanoxylon counted in Shivaji garden, front of Botany Department, Range hills sampling sites. Species wise Dalbergia melanoxylon and Gliricidia sepium sequestrating 49% and 30% respectively. According to final prepared map from Arc view 9.2, it is safe to say that conservation and enhancement of such major terrestrial carbon pool seems to be essential for fast developing cities such as Pune in terms of local mitigation of carbon dioxide and achieving sustainable development through the most applicable and economic technique for CO2mitigation. Keywords: Carbon sequestration, Pune City, urban forest, Global information system (GIS) Excerpt from it- Warran and Patwardhan (13) selected five sites around Pune city, like Vetal hill, Parvati- Pachgaon, Katraj, Singad and Sambhaji Garden for carbon sequestration of tree sources. They reported that maximum carbon was sequestrated at Sinhagad region i.e. 12.92 T/year. The second maximum carbon sequestrating region was Katraj i.e. 4.03 T/year. Vetal hill 0.43 t/year, Parvati-pachgaon 0.28 T/year and Sambhaji garden (Ankur Patwardhan is my RANWA NGO friend, now vice Princi, Garware vollege, its based on our joint paper in Curr Sci. in 2005 below & carbon sequestered is assumed to be 50% of annual tree biomass growth) Further, they report- Chavan and Rasal (1) carried out standing carbon stock in selective tree species grown in Dr. B.A.M. University campus at Aurangabad. They had selected 20 different tree species having diameter > 10 cm. The average standing stock of organic carbon was about 1.65 t/tree. 3) Ghate, U. A. Patwardhan1,, A. Waran, 2005. Reducedurban consumerism and enhancedrural bio-enterprises for food, water and climatic security, Current Science, Vol. 88, No. 2, pp 213-214. (based on above paper by Warran & Patwardhan,plz. Google) Pune city with its 2.5 million population and 1 million vehicles, emits an estimated over 100 t of air pollutants per day. Among the 3 largest cities in the country with over 10 million population, Kolkata and Mumbai have efficient public transport viz. metro railway and emit 300 and 600 t each respectively. New Delhi, the 3rd metropolis emitted 1300 t pollutants per day, before the metro rail service. Vehicles contribute 30, 52 and 64% of the total pollution in these cities. Altogether, carbon emissions (50% of total pollution) may more than double from 50 t at present to 100 t by 2015 in Oune, largely due to growth in fossil-fuel-driven private vehicles. Sequestering about 35,000 t of carbon would require 14,000 ha, i.e. 140 km2 of tree plantation, as 5–10 year-old tree plantations grow about 5 t/ ha/ year, including 50% carbon sequestered. But this amounts to 22% of the present Pune urban area of 700 km2, which is untenable since so much vacant land does not exist. Tree plantation areas such as avenues and gardens with fully grown tree canopy comprise about 10% in Pune city, but are not net carbon sequesters as they
- 4. 4 emit carbon through litter fall and decomposition. About 50% of tree canopy is lost in Pune city in the last 50 years to urbanization. 4) Agroforestry Article (PDF Available) in Range Management and Agroforestry 37(2):116-127 · December Om Prakash Chaturvedi o Central Agroforestry Research Institute, Jhansi Abstract Productivity of any vegetation system mainly depends on biomass production and carbon storage potential in their different components, which are affected by nature and age of plant, and other climatic, edaphic, topographic and biotic factors. In different vegetation systems, the bole/ stem biomass contributed 28 to 86% of total aboveground biomass. The contributions of bole, branch and leaf were 65-76, 14-19, 3-12 % resp. for fast growing tree species. In case of other tree based systems stem contributed about 76-80%, branch 11-29% and leaves 3- 14% of aboveground biomass. A tree allocates on an average 82% to above ground biomass (stem, branch, leaves and litter) and 18% to below ground biomass (roots). The available estimates of carbon stored in tree based systems ranged from 0.29 to 15.21 Mg C ha1year-1 in above ground and 30-300 Mg C ha-1 upto 1 m depth in the soil. Soil carbon storage potential in agroforestry systems differed from system to system and highest storage potential was observed in homegardens where it stored 119.3 t SOC per hectare Note- One tonne is equivalent to: Metric/SI: 1 megagram (Mg) (by definition). Equal to 1000000 grams (g) or 1000 kilograms (kg). Mg is distinct from mg, milligram. 5) Tree biomass and carbon density estimation in the tropical dry forestof Southern WesternGhats, India Babu Padmakumar(1) , NaduparambuPSreekanth (2) ,ViswanathanShanthiprabha(2) ,etal iForest - Biogeosciences and Forestry, Volume 11, Issue 4, Pages 534-541 (2018) Abstract Average biomass and carbon density of the vegetation were 64.13 t ha-1 and 30.46 t-C ha-1, respectively. Among the 32 species identified, Tamarindus indica L. (17%), Hardwickia binata Roxb. (14%), Terminalia arjuna (Roxb. ex DC.) Wight & Arn (10%) and Pleiospermium alatum (Wight & Arn.) Swingle (10%) were dominant as for carbon storage. The small- (diameter at breast height 3-9 cm) to medium-sized trees (diameter at breast height 10-69 cm) were found to contribute to more than 50% of biomass and carbon in the forest. 5) A systematic reviewonthe abovegroundbiomass and carbon stocks of Indian forest ecosystems Onkar Salunkhe,P.K.Khare, RichaKumari & M. L. Khan
- 5. 5 Ecological Processes volume 7, Article number: 17 (2018) Manhas et al.(2006) reportedthe India’stotal carbonstockas 1085 and 1083 Mt in 1984 and1994, respectively7 .The majorforestscontributedtocarbonstockwere of the order of:Miscellaneousforest> Shorea robusta forest>Tectona grandis forest> Temperate forest>Tropical forest> Bambooforest, etc.Chhabra etal. (2002a, b) calculatedtotal standingbiomass(above andbelow ground) usingbiomass expansionfactors.Theirresultsshowedthat total biomasswas 8683 Mt, that is,aboveground(6865 Mt) and belowgroundbiomass(1818 Mt) i.e.79% and 21% to the total biomass,resp.,withmean biomassdensityof Indianforestas135 t h− 1 . From studiesoncarbonbudgetof the Indianforestecosystems,Haripriya(2003) concludedthatthe Indianforestsectoractedas a source of 12.8 Tg C for the year1994. Estimatedcarbonpool size of trees and forestsin India ranged from 41 to 48 Mg C ha− 1 and8 from 39 to 47 Mg C ha− 1 for 1992 and 2002, respectively(Kauletal. 2011). Sheikhetal.(2011) estimated India’sforestbiomassand reported variations from 3325 to 3161 Mt foryear 2003 to 2007, respectively.Netfluxesof CO2 were 372 Mt and 288 Mt in9 assessmentperiods1& 2 resp.withannual emissionof 186 and 114 Mt of CO2,resp. From: A systematic review on the aboveground biomass and carbon stocks of Indian forests Tree species Area (ha) Avg. litter production C flux Total C flux in the planted area (Mt. C yr.− 1) (FSI 1999) (t ha− 1 yr.− 1) (Mt C yr.− 1) Eucalyptus spp. 1360 4.50 2.03 27.5 Tectona grandis 1330 3.60 1.62 21.5 Acacia auriculiformis 564 3.03 1.36 7.7 Pinus roxburghii 381 4.94 2.22 7.1 Dalbergia sisoo 266 3.03 1.36 3.6 Shorea robusta 250 11.27 5.07 1.3 Gmelina arborea 148 2.17 0.97 1.4 Casuarina equisetifolia 134 3.15 1.41 1.9 Populus deltoids 47 3.71 1.66 0.8 Bombax ceiba 37 1.30 0.58 0.2 1. Raizada et al. (2003) 2. Table 5 Allocation of plant biomass (t ha− 1) in tropical dry forest of India Locality Plant biomass Source 7 Similar to Jagdish (2003) IISc assessmentbut its 75%underestimate as I showed & reported justbelow this. 8 This implies doublei.e. 70 to 80 t/ ha biomass. 9 This indicates about10-15%of standingbiomas thatis flux- litterfall & new shoots growth. As forest area is 75 M ha, this indicates standingbiomassof 50 t/ha and flux of 6 t/ha/yr. Of this,litterfall can behalf- 3 t. ha/ yr.
- 6. 6 AG BG Total Varanasi – 7.6 – Bandhu (1970) Varanasi10 205 34.3 239.8 Singh (1975) Udaipur 28 – – Ranawat and Vyas (1975) Dehra Dun 129 – – Kaul et al. (1979) Varanasi 643 10 78 Singh and Singh (1981) Chandraprabha 95 – – Singh (1989) Tripura 114 24 138 Negi et al. (1990) Coimbatore 27 11 38 George et al. (1990) Haldwani 74–164 15–18 90–181 Negi et al. (1995) Chhindwara 28–85 9–15 371–1009 Pande (2005) Madhya Pradesh (Dry Deciduous) 55 – – Salunkhe et al. (2016) 6) http://cdn.narendramodi.in/ebooks/other- ebooks1/tree_cover_in_urban_area/files/assets/basic-html/page22.html The Delhi-based National Institute of Environment Studies (NIES) prepared a list of major cities with tree cover and mentioned that Calcu!a has the lowest green cover (less than one per cent of geographical area) among all mega ci_es 23. The NIES estimated a tree cover of 8.60 % in Bangalore; 11.9 % in New Delhi; 6.20 % in Greater Mumbai; and 7.5 % in Chennai. According to the norms, mentioned by the NIES and someother literature, the tree cover should be at least 15 % for megacities with a millionplus popula_on23. Thus, majority of the cities, including the green cties, in India have tree cover below the minimum optimum norm. Due to lack of space and demand of the land for other purpose, it may be difficult to achieve the tree cover of 15% of city area or 20 m 2 per inhabitants in the megacities like Ahmedabad (MCD), and surat. Instead, 10% or 15 m 2 per person may be realistic. New Delhi Municipal Council (NDMC) and Delhi Development Authority (DDA) have many parks, city forests,biodiversity parks and other green belts. There are nine city forests and two biodiversity parks in Delhi. Nine more city forests are planned to be created. till there is a need to idetify vacant areas which can be put under the green cover. Entire ridge area (about 6,000 ha) needs to be greened. Delhi has done great job in having 20% are under green cover- 11% under tree cover & 9% under parks/ gardens. The status about the tree cover for different cities in India is not available, but the Forest Survey of India (2011) 20 reported forest and tree cover in the two Urban Areas (Chandigadh and Delhi) of the Union Territories. The Gujarat Forest Department conducted a separate study (2011)21 to assess tree cover in Gandhinagar Town Planning Area,and the comparable figures have been given in Table-1. In Gujrat state,3,783 sq km host30 crore treesoutside foresti.e.343/ha. Gandhinagarhas3,075 ha are undertree coverwith8.65 lakhtree i.e.282/ ha.11 10 I doubt this,its 2-3 times higher than avg. also its initial study so no much criticism& correction faced. 11 The trees may be small,so high in umbers likeProsopis or in Pune university.
- 7. 7 POTENTIALCONTRIBUTION OFTHE TREES OFNAGPUR CITY TO CARBON SEQUESTRATION February2018, https://www.researchgate.net/publication/323445442_POTENTIAL_CONTRIBUTION_OF_THE_T REES_OF_NAGPUR_CITY_TO_CARBON_SEQUESTRATION Project: POTENTIALCONTRIBUTION OFTHE TREES OFNAGPUR CITY TO CARBON SEQUESTRATION Rakhi Shambharkar From the recordeddatatotal standingbiomasswasestimatedandfrombiomass total carbon sequestrationbytreesof Nagpurcitywasestimated.Carbonsequestrationrate of treesindense areas perhector of the Nagpurcitywas 20.96 tonsand peryear 725 tons.An average carbonsequestrationby the treesof city includingdense,moderate andspare plantationwas8tons perhector.Total carbon dioxide sequestrationfromatmospherebytotal treesof citywas estimatedas12249 tons. https://www.researchgate.net/publication/333967429_CARBON_SEQUESTRATION_CLIMATE_CHANGE_ ADAPTATION_AND_MITIGATION_BY_DEVELOPING_A_SELF- _SUSTAINING_BIODIVERSITY_PARK_ON_A_DEGRADED_LAND_AT_LONI_KALBHOR_IN_PUNE_DISTRICT ShantanuGoel & Aparna Watve- he wasmy MSc biodivstudentatGarware college &thenat UNDP,She was myclassmate at Fergusson! Floraof ReservedForestof Loni Kalbhor- page 12-13 As perthe ChampionandSeth’sclassification,the foresttype of Loni fallsunderthe category‘Southern Tropical Thorn Forests’.Asperthe classification,the maintreespeciesof these forestsare Acaciaarabica (Babul),Acacialeucophloea(Hiwar),Ziziphusjujube(Bor),Buteamonosperma(Palas),andBalanites roxburghii (Hinganbet).These forestsare alsofull of EuphorbiaandCassiascrub.ForestSurveyof India, inits Atlasof ForestTypesinIndia,has beendescribedthe ForestType forLoni as ‘DryDeciduousScrub Forest’withshrubbygrowthof heightsbetween3to6 metersincludingsome tree species.The Loni KalbhorforestareaisdominatedbyAcaciasp, withcompositionmainlycomprisingAcaciacatechu, Acacia nilotica,AzadirachtaindicaandZizyphusjujube.There isnoscientificdataon the tree and shrub densityof the forestareainLoni Kalbhor,butonvisual observation,itcouldbe estimatedtobe 100 to 150 shrubs/treesperhectare.
- 8. 8 http://iaetsdjaras.org/gallery/38-february-528.pdf CarbonStorage inTreesof Urban andPeri-urbanForestsof Agartala,Tripura Tamal Majumdar1 and ThiruSelvan2* Departmentof ForestryandBiodiversity,TripuraUniversity,Suryamaninagar,Agartala,Tripura 1majumdart3@gmail.com *CorrespondingAuthor:2tselvan@tripurauniv.in Abstract-Quantificationof total carbonsequestrationbyurbantreesinAgartala,Indiawasdone based on generalizedallometricmodel byestimating above andbelow groundtree biomassandcarbon content.All treeswithGirthatBreast Height(GBH) ⩾10cm were measuredin444 surveyedplotsof equal size (20×20m). A total 3470 treesof 111 species,92generaand in45 familieswererecorded.Total standbasal area240.76 m2 (13.56m2 ha1), biomasscarbon806.52 Mg (45.42 Mg ha1) and carbon dioxide sequestration2959.92 Mg (166.66 Mg ha1) were recordedfromstudyarea.Out of total recorded1613.04 Mg biomass,Above Groundbiomasswas1153.05 Mg, Below GroundBiomasswas 287.03 Mg and LitterBiomass172.95 Mg. In the studyarea, biomassrangedfrom0.0012 Mg/ha to 27.41 Mg/ha and carbon stockfrom0.0006 Mg/ha to 13.70 Mg/ha. Tree diameterclass21-30 cm contributed24.90 Mg/ha biomass(27.42%).The rate of CO2 fixationper tree was foundhighestinAlstoniascholarisfollowedbyAlbiziasaman.Native(94.33%) andevergreen (85.44%) speciesshowedbetterperformance inbiomassandcarbonsequestrationoverintroducedand deciduous.Itisevidentthatbiomassandcarboncontentof a tree relatedwithitsdiameterandnoton numberof treesalone.Diameterof treeshasshownstrongpositivecorrelationwithitstotal biomass (0.965) andcarbon content(0.963). KeyWords:Carbon sequestration,UrbanForest,StandingBiomass,UrbanTrees,AgartalaCity.