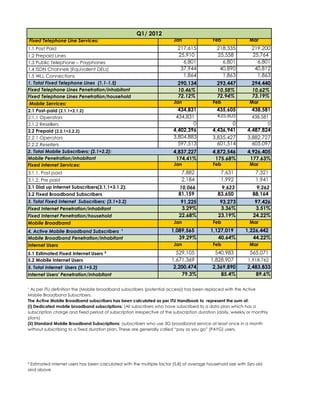
SlideShare a Scribd company logo
1 of 2
Download to read offline
Jan Feb Mar
217,615 218,335 219,200
25,910 25,558 25,764
6,801 6,801 6,801
37,944 40,890 40,812
1,864 1,863 1,863
290,134 293,447 294,440
10.46% 10.58% 10.62%
72.12% 72.94% 73.19%
Jan Feb Mar
434,831 435,605 438,581
434,831 435,605 438,581
0 0 0
4,402,396 4,436,941 4,487,824
3,804,883 3,835,427 3,882,727
597,513 601,514 605,097
4,837,227 4,872,546 4,926,405
174.41% 175.68% 177.63%
Jan Feb Mar
7,882 7,631 7,321
2,184 1,992 1,941
10,066 9,623 9,262
81,159 83,650 88,164
91,225 93,273 97,426
3.29% 3.36% 3.51%
22.68% 23.19% 24.22%
Jan Feb Mar
1,089,565 1,127,019 1,226,442
39.29% 40.64% 44.22%
Jan Feb Mar
529,105 540,983 565,071
1,671,369 1,828,907 1,918,762
2,200,474 2,369,890 2,483,833
79.3% 85.4% 89.6%
1.5 WLL Connections
Q1/ 2012
2.2.2 Resellers
2.2 Prepaid (2.2.1+2.2.2)
1.4 ISDN Channels (Equivalent DELs)
1. Total Fixed Telephone Lines (1.1-1.5)
Fixed Telephone Line Services:
1.1 Post Paid
1.2 Prepaid Lines
1.3 Public Telephone – Payphones    
Fixed Telephone Lines Penetration/household
Mobile Services:
2.1 Post-paid (2.1.1+2.1.2)
2.2.1 Operators
2.1.1 Operators
2.1.2 Resellers
Fixed Telephone Lines Penetration/inhabitant
2. Total Mobile Subscribers; (2.1+2.2):
¹ As per ITU definition the (Mobile broadband subscribers (potential access)) has been replaced with the Active
Mobile Broadband Subscribers.
The Active Mobile Broadband subscribers has been calculated as per ITU Handbook to represent the sum of:
(i) Dedicated mobile broadband subscriptions: (All subscribers who have subscribed to a data plan which has a
subscription charge and fixed period of subscription irrespective of the subscription duration (daily, weekly or monthly
plans)
(ii) Standard Mobile Broadband Subscriptions: (subscribers who use 3G broadband service at least once in a month
without subscribing to a fixed duration plan. These are generally called “pay as you go” (PAYG) users.
3.1 Dial up Internet Subscribers(3.1.1+3.1.2):
Mobile Broadband
Fixed Internet Services:
3.1.1. Post paid
3.1.2. Pre paid
3. Total Fixed Internet Subscribers; (3.1+3.2)
3.2 Fixed Broadband Subscribers
5.1 Estimated Fixed Internet Users ²
4. Active Mobile Broadband Subscribers ¹
Mobile Penetration/inhabitant
Fixed Internet Penetration/inhabitant
Internet Users' Penetration/inhabitant
Note: New published population (2,773,479) and households (402,286)
Fixed Internet Penetration/household
Mobile Broadband Penetration/inhabitant
Internet Users
5.2 Mobile Internet Users
5. Total Internet Users (5.1+5.2)
² Estimated internet users has been calculated with the multiple factor (5.8) of average household size with 5yrs old
and above
Note: New published population (2,773,479) and households (402,286)

More Related Content

Similar to 1st quarter 2012

Venture-Backed Exits Q3 07
Venture-Backed Exits Q3 07  Venture-Backed Exits Q3 07
Venture-Backed Exits Q3 07
mensa25
 
Igp m (fgv) indice acumulado
Igp m (fgv) indice acumuladoIgp m (fgv) indice acumulado
Igp m (fgv) indice acumulado
custos contabil
 
Venture Backed Exits - Q4 '07/full year 2007
 	Venture Backed Exits - Q4 '07/full year 2007   	Venture Backed Exits - Q4 '07/full year 2007
Venture Backed Exits - Q4 '07/full year 2007
mensa25
 

Similar to 1st quarter 2012 (20)

2nd Quarter 2013
2nd Quarter 2013 2nd Quarter 2013
2nd Quarter 2013
 
Q1 2010
Q1  2010Q1  2010
Q1 2010
 
Q1 2010
Q1  2010Q1  2010
Q1 2010
 
Q3 2010
Q3 2010Q3 2010
Q3 2010
 
Q3 2009
Q3 2009Q3 2009
Q3 2009
 
Q2 2010
Q2  2010Q2  2010
Q2 2010
 
E4 03 שכר חודשי ממוצע לשכיר
E4 03 שכר חודשי ממוצע לשכירE4 03 שכר חודשי ממוצע לשכיר
E4 03 שכר חודשי ממוצע לשכיר
 
Q1 jan mar 2011
Q1 jan mar 2011Q1 jan mar 2011
Q1 jan mar 2011
 
Venture-Backed Exits Q3 07
Venture-Backed Exits Q3 07  Venture-Backed Exits Q3 07
Venture-Backed Exits Q3 07
 
PV Project Development Pre-Feasibility Financial Model
PV Project Development Pre-Feasibility Financial ModelPV Project Development Pre-Feasibility Financial Model
PV Project Development Pre-Feasibility Financial Model
 
Monthly economic report real estate analysis benchmark - june 9 2017...
Monthly economic report   real estate analysis  benchmark - june 9 2017...Monthly economic report   real estate analysis  benchmark - june 9 2017...
Monthly economic report real estate analysis benchmark - june 9 2017...
 
May 2017 - Alberta Real Estate Benchmark and Economic Report
May 2017 - Alberta Real Estate Benchmark and Economic ReportMay 2017 - Alberta Real Estate Benchmark and Economic Report
May 2017 - Alberta Real Estate Benchmark and Economic Report
 
Multi Objective Optimization of PMEDM Process Parameter by Topsis Method
Multi Objective Optimization of PMEDM Process Parameter by Topsis MethodMulti Objective Optimization of PMEDM Process Parameter by Topsis Method
Multi Objective Optimization of PMEDM Process Parameter by Topsis Method
 
Igp m (fgv) indice acumulado
Igp m (fgv) indice acumuladoIgp m (fgv) indice acumulado
Igp m (fgv) indice acumulado
 
Venture Backed Exits - Q4 '07/full year 2007
 	Venture Backed Exits - Q4 '07/full year 2007   	Venture Backed Exits - Q4 '07/full year 2007
Venture Backed Exits - Q4 '07/full year 2007
 
Ctia Survey Midyear 2009 Graphics
Ctia Survey Midyear 2009 GraphicsCtia Survey Midyear 2009 Graphics
Ctia Survey Midyear 2009 Graphics
 
July 2017 Monthly economic report real estate analysis benchmark - july 7,...
July 2017 Monthly economic report   real estate analysis  benchmark - july 7,...July 2017 Monthly economic report   real estate analysis  benchmark - july 7,...
July 2017 Monthly economic report real estate analysis benchmark - july 7,...
 
PPT Item # 5&6 - Water & Sewer Rate Study
PPT Item # 5&6 - Water & Sewer Rate StudyPPT Item # 5&6 - Water & Sewer Rate Study
PPT Item # 5&6 - Water & Sewer Rate Study
 
July 2021 - Market Report
July 2021 - Market Report July 2021 - Market Report
July 2021 - Market Report
 
Orr' projection model v 2020 03-29
Orr' projection model v 2020 03-29Orr' projection model v 2020 03-29
Orr' projection model v 2020 03-29
 

More from traoman

More from traoman (20)

passive_infrastructure draft regulationar-AR
  passive_infrastructure draft regulationar-AR  passive_infrastructure draft regulationar-AR
passive_infrastructure draft regulationar-AR
 
522 tra position_onpassiveinfrastructurepc_ar
522 tra position_onpassiveinfrastructurepc_ar522 tra position_onpassiveinfrastructurepc_ar
522 tra position_onpassiveinfrastructurepc_ar
 
الربع الرابع 2005
الربع الرابع 2005الربع الرابع 2005
الربع الرابع 2005
 
الربع الثالث 2005
الربع الثالث 2005الربع الثالث 2005
الربع الثالث 2005
 
الربع الثاني 2005
الربع الثاني 2005الربع الثاني 2005
الربع الثاني 2005
 
الربع الاول 2005
الربع الاول 2005الربع الاول 2005
الربع الاول 2005
 
الربع الرابع 2006
الربع الرابع 2006الربع الرابع 2006
الربع الرابع 2006
 
الربع الثالث 2006
الربع الثالث 2006الربع الثالث 2006
الربع الثالث 2006
 
الربع الثاني 2006
الربع الثاني 2006الربع الثاني 2006
الربع الثاني 2006
 
الربع الاول 2006
الربع الاول 2006الربع الاول 2006
الربع الاول 2006
 
Q4 2008
Q4 2008Q4 2008
Q4 2008
 
Q4 2007
Q4 2007Q4 2007
Q4 2007
 
Q2 2007
Q2 2007Q2 2007
Q2 2007
 
الربع الثالث 2007
الربع الثالث 2007الربع الثالث 2007
الربع الثالث 2007
 
الربع الاول 2007
الربع الاول 2007 الربع الاول 2007
الربع الاول 2007
 
الربع الثالث 2008
الربع الثالث 2008الربع الثالث 2008
الربع الثالث 2008
 
الربع الثاني 2008
الربع الثاني 2008الربع الثاني 2008
الربع الثاني 2008
 
الربع الاول 2008
الربع الاول 2008الربع الاول 2008
الربع الاول 2008
 
الربع الرابع 2009
الربع الرابع 2009الربع الرابع 2009
الربع الرابع 2009
 
الربع الثالث 2009
الربع الثالث 2009الربع الثالث 2009
الربع الثالث 2009
 

1st quarter 2012

  • 1. Jan Feb Mar 217,615 218,335 219,200 25,910 25,558 25,764 6,801 6,801 6,801 37,944 40,890 40,812 1,864 1,863 1,863 290,134 293,447 294,440 10.46% 10.58% 10.62% 72.12% 72.94% 73.19% Jan Feb Mar 434,831 435,605 438,581 434,831 435,605 438,581 0 0 0 4,402,396 4,436,941 4,487,824 3,804,883 3,835,427 3,882,727 597,513 601,514 605,097 4,837,227 4,872,546 4,926,405 174.41% 175.68% 177.63% Jan Feb Mar 7,882 7,631 7,321 2,184 1,992 1,941 10,066 9,623 9,262 81,159 83,650 88,164 91,225 93,273 97,426 3.29% 3.36% 3.51% 22.68% 23.19% 24.22% Jan Feb Mar 1,089,565 1,127,019 1,226,442 39.29% 40.64% 44.22% Jan Feb Mar 529,105 540,983 565,071 1,671,369 1,828,907 1,918,762 2,200,474 2,369,890 2,483,833 79.3% 85.4% 89.6% 1.5 WLL Connections Q1/ 2012 2.2.2 Resellers 2.2 Prepaid (2.2.1+2.2.2) 1.4 ISDN Channels (Equivalent DELs) 1. Total Fixed Telephone Lines (1.1-1.5) Fixed Telephone Line Services: 1.1 Post Paid 1.2 Prepaid Lines 1.3 Public Telephone – Payphones     Fixed Telephone Lines Penetration/household Mobile Services: 2.1 Post-paid (2.1.1+2.1.2) 2.2.1 Operators 2.1.1 Operators 2.1.2 Resellers Fixed Telephone Lines Penetration/inhabitant 2. Total Mobile Subscribers; (2.1+2.2): ¹ As per ITU definition the (Mobile broadband subscribers (potential access)) has been replaced with the Active Mobile Broadband Subscribers. The Active Mobile Broadband subscribers has been calculated as per ITU Handbook to represent the sum of: (i) Dedicated mobile broadband subscriptions: (All subscribers who have subscribed to a data plan which has a subscription charge and fixed period of subscription irrespective of the subscription duration (daily, weekly or monthly plans) (ii) Standard Mobile Broadband Subscriptions: (subscribers who use 3G broadband service at least once in a month without subscribing to a fixed duration plan. These are generally called “pay as you go” (PAYG) users. 3.1 Dial up Internet Subscribers(3.1.1+3.1.2): Mobile Broadband Fixed Internet Services: 3.1.1. Post paid 3.1.2. Pre paid 3. Total Fixed Internet Subscribers; (3.1+3.2) 3.2 Fixed Broadband Subscribers 5.1 Estimated Fixed Internet Users ² 4. Active Mobile Broadband Subscribers ¹ Mobile Penetration/inhabitant Fixed Internet Penetration/inhabitant Internet Users' Penetration/inhabitant Note: New published population (2,773,479) and households (402,286) Fixed Internet Penetration/household Mobile Broadband Penetration/inhabitant Internet Users 5.2 Mobile Internet Users 5. Total Internet Users (5.1+5.2) ² Estimated internet users has been calculated with the multiple factor (5.8) of average household size with 5yrs old and above
  • 2. Note: New published population (2,773,479) and households (402,286)