SlideShare a Scribd company logo
1 of 1
April May June
253,499
25,256
6,801
44,418
1,786
331,760 0 0
9.16% 0.00% 0.00%
82.47% 0.00% 0.00%
April May June
484,968 0 0
484,968
0
4,859,078 0 0
4,357,119
501,959
5,344,046 0 0
147.50% 0.00% 0.00%
April May June
4,766
459
5,225 0 0
129,476
134,701 0 0
3.72% 0.00% 0.00%
33.48% 0.00% 0.00%
April May June
1,908,243
52.67% 0.00% 0.00%
4. Active Mobile Broadband Subscribers ¹
3.1.2. Pre paid
Fixed Internet Penetration/inhabitant
Fixed Internet Penetration/household
Mobile Broadband Penetration/inhabitant
Mobile Broadband
3.1 Dial up Internet Subscribers(3.1.1+3.1.2):
3. Total Fixed Internet  Subscribers; (3.1+3.2)
3.2 Fixed Broadband Subscribers
 Fixed Telephone Line Services:
3.1.1. Post paid
1.5 WLL Connections
2.2.2 Resellers
2.2 Prepaid (2.2.1+2.2.2)
Mobile Penetration/inhabitant
Fixed Internet Services:
2.2.1 Operators  
Note: The penetraion rates for the month of (March), according to the lastest statistics recieved from NCSI, which is
(3,623,001) up to Mid of 2012; and households (402,286)
Q2/2013
Note: The penetration rates for the month of (Jan & Feb ) according to the provisional population which was (3,295,298) up to
Mid of 2011; provided by the National Center for Statistics & Information and households (402,286)
¹ As per ITU definition the (Mobile broadband subscribers (potential access)) has been replaced with the Active Mobile
Broadband Subscribers.
The Active Mobile Broadband subscribers has been calculated as per ITU Handbook to represent the sum of:
(i) Dedicated mobile broadband subscriptions: (All subscribers who have subscribed to a data plan which has a subscription
charge and fixed period of subscription irrespective of the subscription duration (daily, weekly or monthly plans)
(ii) Standard Mobile Broadband Subscriptions: (subscribers who use 3G broadband service at least once in a month without
subscribing to a fixed duration plan. These are generally called “pay as you go” (PAYG) users.
 Mobile Services:
2.1 Post-paid (2.1.1+2.1.2)
2.1.1 Operators
2.1.2 Resellers
2. Total Mobile Subscribers; (2.1+2.2):
1.1 Post Paid     
1.2 Prepaid Lines
1.3 Public Telephone – Payphones    
Fixed Telephone Lines Penetration/household
1.4 ISDN Channels (Equivalent DELs)       
1. Total Fixed Telephone Lines (1.1-1.5)
Fixed Telephone Lines Penetration/inhabitant

More Related Content

Similar to 4th Quarter 2013

1st Quarter 2013
1st Quarter 2013 1st Quarter 2013
1st Quarter 2013 traoman
 
1st quarter 2012
1st quarter 20121st quarter 2012
1st quarter 2012traoman
 
Quarter 4, 2012
 Quarter 4, 2012 Quarter 4, 2012
Quarter 4, 2012traoman
 
Active customer defination.pptx
Active customer defination.pptxActive customer defination.pptx
Active customer defination.pptxTaye22
 
KDDI Financial Results for the 1st Quarter of FY2015.3
KDDI Financial Results for the 1st Quarter of FY2015.3KDDI Financial Results for the 1st Quarter of FY2015.3
KDDI Financial Results for the 1st Quarter of FY2015.3KDDI
 
2015 - Broadband development in Moldova
2015 - Broadband development in Moldova2015 - Broadband development in Moldova
2015 - Broadband development in MoldovaRoman Bahnaru
 
2nd quarter 2012
2nd quarter 20122nd quarter 2012
2nd quarter 2012traoman
 
KDDI Financial Results for the 1st Half of FY2015.3
KDDI Financial Results for the 1st Half of FY2015.3KDDI Financial Results for the 1st Half of FY2015.3
KDDI Financial Results for the 1st Half of FY2015.3KDDI
 
Casestudy bsnl-090628043816-phpapp01
Casestudy bsnl-090628043816-phpapp01Casestudy bsnl-090628043816-phpapp01
Casestudy bsnl-090628043816-phpapp01atiyarahman
 
KDDI Financial Results for the 3rd Quarter of FY2015.3
KDDI Financial Results for the 3rd Quarter of FY2015.3KDDI Financial Results for the 3rd Quarter of FY2015.3
KDDI Financial Results for the 3rd Quarter of FY2015.3KDDI
 
Communications Statistics December 2021_1643809069 (1).pdf
Communications Statistics December 2021_1643809069 (1).pdfCommunications Statistics December 2021_1643809069 (1).pdf
Communications Statistics December 2021_1643809069 (1).pdfEricklucas30
 
BSNL Supply Chain Mgt PPT
BSNL Supply Chain Mgt PPTBSNL Supply Chain Mgt PPT
BSNL Supply Chain Mgt PPTShreyash Gupta
 
virgin media. q42007_final
virgin media. q42007_finalvirgin media. q42007_final
virgin media. q42007_finalfinance28
 
virgin media. _q42007_final
virgin media. _q42007_finalvirgin media. _q42007_final
virgin media. _q42007_finalfinance28
 
Performance indicator report_jun_2015
Performance indicator report_jun_2015Performance indicator report_jun_2015
Performance indicator report_jun_2015Megha Jain
 
Gsm tariffs in punjab
Gsm tariffs in punjabGsm tariffs in punjab
Gsm tariffs in punjabBsnl Punjab
 

Similar to 4th Quarter 2013 (20)

1st Quarter 2013
1st Quarter 2013 1st Quarter 2013
1st Quarter 2013
 
1st quarter 2012
1st quarter 20121st quarter 2012
1st quarter 2012
 
Q3 2009
Q3 2009Q3 2009
Q3 2009
 
Q4 2009
Q4 2009Q4 2009
Q4 2009
 
Quarter 4, 2012
 Quarter 4, 2012 Quarter 4, 2012
Quarter 4, 2012
 
Active customer defination.pptx
Active customer defination.pptxActive customer defination.pptx
Active customer defination.pptx
 
KDDI Financial Results for the 1st Quarter of FY2015.3
KDDI Financial Results for the 1st Quarter of FY2015.3KDDI Financial Results for the 1st Quarter of FY2015.3
KDDI Financial Results for the 1st Quarter of FY2015.3
 
2015 - Broadband development in Moldova
2015 - Broadband development in Moldova2015 - Broadband development in Moldova
2015 - Broadband development in Moldova
 
2nd quarter 2012
2nd quarter 20122nd quarter 2012
2nd quarter 2012
 
KDDI Financial Results for the 1st Half of FY2015.3
KDDI Financial Results for the 1st Half of FY2015.3KDDI Financial Results for the 1st Half of FY2015.3
KDDI Financial Results for the 1st Half of FY2015.3
 
Casestudy bsnl-090628043816-phpapp01
Casestudy bsnl-090628043816-phpapp01Casestudy bsnl-090628043816-phpapp01
Casestudy bsnl-090628043816-phpapp01
 
KDDI Financial Results for the 3rd Quarter of FY2015.3
KDDI Financial Results for the 3rd Quarter of FY2015.3KDDI Financial Results for the 3rd Quarter of FY2015.3
KDDI Financial Results for the 3rd Quarter of FY2015.3
 
Communications Statistics December 2021_1643809069 (1).pdf
Communications Statistics December 2021_1643809069 (1).pdfCommunications Statistics December 2021_1643809069 (1).pdf
Communications Statistics December 2021_1643809069 (1).pdf
 
BSNL Supply Chain Mgt PPT
BSNL Supply Chain Mgt PPTBSNL Supply Chain Mgt PPT
BSNL Supply Chain Mgt PPT
 
Q2 2008
Q2 2008Q2 2008
Q2 2008
 
virgin media. q42007_final
virgin media. q42007_finalvirgin media. q42007_final
virgin media. q42007_final
 
virgin media. _q42007_final
virgin media. _q42007_finalvirgin media. _q42007_final
virgin media. _q42007_final
 
Performance indicator report_jun_2015
Performance indicator report_jun_2015Performance indicator report_jun_2015
Performance indicator report_jun_2015
 
Casestudy Bsnl
Casestudy BsnlCasestudy Bsnl
Casestudy Bsnl
 
Gsm tariffs in punjab
Gsm tariffs in punjabGsm tariffs in punjab
Gsm tariffs in punjab
 

More from traoman

passive_infrastructure draft regulationar-AR
  passive_infrastructure draft regulationar-AR  passive_infrastructure draft regulationar-AR
passive_infrastructure draft regulationar-ARtraoman
 
522 tra position_onpassiveinfrastructurepc_ar
522 tra position_onpassiveinfrastructurepc_ar522 tra position_onpassiveinfrastructurepc_ar
522 tra position_onpassiveinfrastructurepc_artraoman
 
الربع الرابع 2005
الربع الرابع 2005الربع الرابع 2005
الربع الرابع 2005traoman
 
الربع الثالث 2005
الربع الثالث 2005الربع الثالث 2005
الربع الثالث 2005traoman
 
الربع الثاني 2005
الربع الثاني 2005الربع الثاني 2005
الربع الثاني 2005traoman
 
الربع الاول 2005
الربع الاول 2005الربع الاول 2005
الربع الاول 2005traoman
 
الربع الرابع 2006
الربع الرابع 2006الربع الرابع 2006
الربع الرابع 2006traoman
 
الربع الثالث 2006
الربع الثالث 2006الربع الثالث 2006
الربع الثالث 2006traoman
 
الربع الثاني 2006
الربع الثاني 2006الربع الثاني 2006
الربع الثاني 2006traoman
 
الربع الاول 2006
الربع الاول 2006الربع الاول 2006
الربع الاول 2006traoman
 
الربع الثالث 2007
الربع الثالث 2007الربع الثالث 2007
الربع الثالث 2007traoman
 
الربع الاول 2007
الربع الاول 2007 الربع الاول 2007
الربع الاول 2007 traoman
 
الربع الثالث 2008
الربع الثالث 2008الربع الثالث 2008
الربع الثالث 2008traoman
 
الربع الثاني 2008
الربع الثاني 2008الربع الثاني 2008
الربع الثاني 2008traoman
 
الربع الاول 2008
الربع الاول 2008الربع الاول 2008
الربع الاول 2008traoman
 
الربع الرابع 2009
الربع الرابع 2009الربع الرابع 2009
الربع الرابع 2009traoman
 

More from traoman (20)
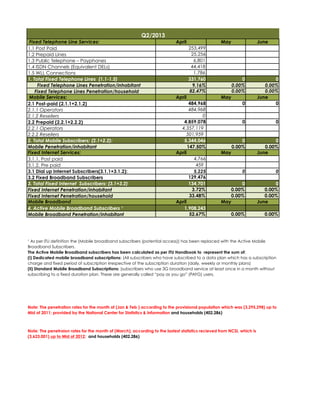
passive_infrastructure draft regulationar-AR
  passive_infrastructure draft regulationar-AR  passive_infrastructure draft regulationar-AR
passive_infrastructure draft regulationar-AR
 
522 tra position_onpassiveinfrastructurepc_ar
522 tra position_onpassiveinfrastructurepc_ar522 tra position_onpassiveinfrastructurepc_ar
522 tra position_onpassiveinfrastructurepc_ar
 
الربع الرابع 2005
الربع الرابع 2005الربع الرابع 2005
الربع الرابع 2005
 
الربع الثالث 2005
الربع الثالث 2005الربع الثالث 2005
الربع الثالث 2005
 
الربع الثاني 2005
الربع الثاني 2005الربع الثاني 2005
الربع الثاني 2005
 
الربع الاول 2005
الربع الاول 2005الربع الاول 2005
الربع الاول 2005
 
الربع الرابع 2006
الربع الرابع 2006الربع الرابع 2006
الربع الرابع 2006
 
الربع الثالث 2006
الربع الثالث 2006الربع الثالث 2006
الربع الثالث 2006
 
الربع الثاني 2006
الربع الثاني 2006الربع الثاني 2006
الربع الثاني 2006
 
الربع الاول 2006
الربع الاول 2006الربع الاول 2006
الربع الاول 2006
 
Q4 2008
Q4 2008Q4 2008
Q4 2008
 
Q1 2010
Q1  2010Q1  2010
Q1 2010
 
Q4 2007
Q4 2007Q4 2007
Q4 2007
 
Q2 2007
Q2 2007Q2 2007
Q2 2007
 
الربع الثالث 2007
الربع الثالث 2007الربع الثالث 2007
الربع الثالث 2007
 
الربع الاول 2007
الربع الاول 2007 الربع الاول 2007
الربع الاول 2007
 
الربع الثالث 2008
الربع الثالث 2008الربع الثالث 2008
الربع الثالث 2008
 
الربع الثاني 2008
الربع الثاني 2008الربع الثاني 2008
الربع الثاني 2008
 
الربع الاول 2008
الربع الاول 2008الربع الاول 2008
الربع الاول 2008
 
الربع الرابع 2009
الربع الرابع 2009الربع الرابع 2009
الربع الرابع 2009
 

4th Quarter 2013

  • 1. April May June 253,499 25,256 6,801 44,418 1,786 331,760 0 0 9.16% 0.00% 0.00% 82.47% 0.00% 0.00% April May June 484,968 0 0 484,968 0 4,859,078 0 0 4,357,119 501,959 5,344,046 0 0 147.50% 0.00% 0.00% April May June 4,766 459 5,225 0 0 129,476 134,701 0 0 3.72% 0.00% 0.00% 33.48% 0.00% 0.00% April May June 1,908,243 52.67% 0.00% 0.00% 4. Active Mobile Broadband Subscribers ¹ 3.1.2. Pre paid Fixed Internet Penetration/inhabitant Fixed Internet Penetration/household Mobile Broadband Penetration/inhabitant Mobile Broadband 3.1 Dial up Internet Subscribers(3.1.1+3.1.2): 3. Total Fixed Internet  Subscribers; (3.1+3.2) 3.2 Fixed Broadband Subscribers  Fixed Telephone Line Services: 3.1.1. Post paid 1.5 WLL Connections 2.2.2 Resellers 2.2 Prepaid (2.2.1+2.2.2) Mobile Penetration/inhabitant Fixed Internet Services: 2.2.1 Operators   Note: The penetraion rates for the month of (March), according to the lastest statistics recieved from NCSI, which is (3,623,001) up to Mid of 2012; and households (402,286) Q2/2013 Note: The penetration rates for the month of (Jan & Feb ) according to the provisional population which was (3,295,298) up to Mid of 2011; provided by the National Center for Statistics & Information and households (402,286) ¹ As per ITU definition the (Mobile broadband subscribers (potential access)) has been replaced with the Active Mobile Broadband Subscribers. The Active Mobile Broadband subscribers has been calculated as per ITU Handbook to represent the sum of: (i) Dedicated mobile broadband subscriptions: (All subscribers who have subscribed to a data plan which has a subscription charge and fixed period of subscription irrespective of the subscription duration (daily, weekly or monthly plans) (ii) Standard Mobile Broadband Subscriptions: (subscribers who use 3G broadband service at least once in a month without subscribing to a fixed duration plan. These are generally called “pay as you go” (PAYG) users.  Mobile Services: 2.1 Post-paid (2.1.1+2.1.2) 2.1.1 Operators 2.1.2 Resellers 2. Total Mobile Subscribers; (2.1+2.2): 1.1 Post Paid      1.2 Prepaid Lines 1.3 Public Telephone – Payphones     Fixed Telephone Lines Penetration/household 1.4 ISDN Channels (Equivalent DELs)        1. Total Fixed Telephone Lines (1.1-1.5) Fixed Telephone Lines Penetration/inhabitant