1. 1
CHAPTER 1
INTRODUCTION
1.1GENERAL
Cochin port trust which is aptly known as “queen of Arabian Sea”, the
fast growing commercial hub in India offers more diverse attraction than any
other city in the country with its rich culture and heritage. The modern port of
Cochin was developed during the period of 1920-1940 due to untiring efforts
of Sir Robert Bristow. By 1930-1931 the port was formally opened for vessels
upto 30ft draught. Cochin was given the status of a major port in 1936.
Cochin Port is the premier cruise port among the Indian Ports and has
witnessed an encouraging growth in the arrival of luxury cruise liners to its
shore. The slew of cruise tourism friendly business initiatives of Cochin Port
has led to Cochin emerging as the most preferred cruise destination in India.
Cochin figures prominently in the cruise itinerary of all the major cruise lines
like Carnival Cruise Lines, Royal Caribbean International and their sister
affiliates.
As a leading cruise destination of India, every year Cochin hosts, on an
average, 35-45 cruise call and depending on the ship size, between 500 to
3000 international guests per call. Cochin is also acts as a passenger
turnaround destination of M/s Aida Cruises, Germany, which calls at Cochin
twice a year. Cochin Port is preferred by certain cruise lines for their home
port operation. In 2009-10, M.V. Aquamarine, of Louis Cruise Ltd, and during
2011-12, M.C. AMET Majesty of Amet Shipping India P Ltd, were home
ported at Cochin.
2. 2
The entrance of port is through the Cochin gut between the peninsular
headland Vypin and Fort Cochin. Cochin Port aims at being the major cruise
destination on the East-West Sea Trade Route from Europe to Australia
offering services of comparable international standards
The dawn of globalisation has brought about tremendous changes in
maritime trade and cruise tourism.in the fast changing marine environment the
shipping community is looking forward to e ports which can provide them
with the complete range of services and facilities. Cochin Port is developing a
dedicated Cruise Terminal by extending the BTP/ NCB berth with the
financial assistance provided by the Ministry of Tourism.
1.2 SCOPE OF THE PROJECT
The national economic development of India requires a well-
functioning seaport system. In order to realize the economic growth potential,
the attention needs to be given to development and modernization of economic
infrastructure. To become globally competitive, utmost importance must be
given for development of infrastructure in sectors like roads, airports, seaports,
railways etc. in general and port sector in particular as the ports play the vital
role in the overall economic development of the country. There has been
sustained rise in volume of exports with revival of growth in the
manufacturing sector and improved export competitiveness. About 95% by
volume and 70% by value of the country‟s international trade is carried on
through the maritime transport. There are 12 Major Ports, six each on the West
and the East coast and about 200 minor ports along a coast line of over 7000
KMs. The total volume of traffic handled by all the Indian Ports during 2006-
07 was 649.90 million tonnes, of which 463.78 million tonnes i.e. around 71%
was handled by Major Ports and remaining 186.12 million tonnes by the non-
3. 3
Major Ports. During 2007-08 the total traffic was 739.16 million tonnes out of
which 519.16 million tonnes (70%) were handled by Major Ports.
Cochin Port considers cruise as a major business prospect. Thus
Cochin Port is a leading cruise destination on the Indian coast offering
services of international standards. Cochin Port gets major cruise lines like
Cunard Lines, Royal Caribbean Lines, Aida Cruises, Costa Cruises etc., every
year. So it is rather obvious that a great deal of traffic flow through inland
waters will be smoothened with the development of the cruise berth terminal.
4. 4
CHAPTER 2
LITERARURE REVIEW
XAVIER C. BARRETT 1, PE et.al [1] Berths 8 and 9 of the
Morehead Port located at the juncture of Bogue Sound and the Newport River
in Carteret County, North Carolina, are to be improved, for a distance of about
213.4 meters (700 feet).The improvements were done in 2 phases, consist of
strengthening the existing sheet piles to carry an additional live load surcharge
due to a newly constructed warehouse, and increasing the design dredge
elevation to -12.2 meters. The load from the warehouse is reduced by
providing tie backs anchors and new wales at an elevation of -1.5 meters
which is designed to carry a force of 289 kN. During dredging and
construction operation the rip rap will not be removed from the toe of the sheet
pile While dredging the forces in tieback is adjusted or by installing second
row of tie backs and adjusting the forces in the first row of tie backs.For
situations where the overall stability of the system may be compromised due
to unintended disturbance or removal of the rip rap from the toe of the sheet
piles or removal of the battered pile or other related factors a new king pile
combination wall will be constructed in front of the existing sheet pile wall
after demolishing the existing relieving platform. A new tieback anchors will
be connected to the new combination wall. And then construct a new cap
beam. Back fill and reconstruct the relieving platform. The crane rails and
pavement is reconstructed. Geo technical investigation were done to determine
the in-situ properties of the existing coastal plain soils to provide geotechnical
parameters for the SSI analysis and design of the sheet pile wall, the tieback
anchors and the laterally loaded king piles.
6. 6
recently constructed and comprised of a diaphragm wall and pile rows to
support the deck structure. In this case the simplified theoretical solutions do
not always provide a sound basis for the assessment of load transfer in
different layers; hence, pile instrumentation tests are often performed to
measure the axial load at various elevations. Axial loads are typically
generated by the self-weight of the structure and external live loads; lateral
loads are typically generated by wave current and seismic loads. After
completion of the structure, the instrumented pile load test was conducted on a
pile with a design load. The development of port structure necessitated in-
depth studies on the behaviour of berthing structures during dredging. Most of
the coastal regions have sloping seabeds with low shear strength, soft, marine
clay. Therefore, slope stability is a common issue in these areas and the
potentially unstable slopes may create problems to existing structures. The
clay strata may cause lateral movements and transfer additional large lateral
forces to the pile causing damage. When the current dredging work was
undertaken, it was decided to monitor the lateral movements of the berth. For
this purpose, one inclinometer tube was installed in one panel of the
diaphragm wall and in one of the piles of the structure. The magnitude of the
soil movement is related to many factors such as soil properties, structural
properties and dredging sequence. The geotechnical investigation at the site
was carried out prior to the placement of fill at the site. Standard penetration
tests (SPT) were carried out at several locations of the study area in
accordance with ASTM D-1586 to understand the stratigraphy. Particle size
analysis of soils was done in accordance with ASTM D-422. Specific gravity
tests were conducted in accordance with ASTM D-854. Direct shear tests were
conducted on representative samples in accordance with ASTM D- 3080.
Unconfined compressive strength (UCC) tests of fine-grained soils were
determined as per ASTM D-2166. Undrained shear strength of soft fine-
grained soils were obtained by field vane shear test as per ASTM D-2573.
7. 7
Compressive strength of rock cores was performed as per ASTM D-2938.
After construction of the berth, it was decided to conduct a full scale axial load
test on a single pile and monitor the lateral movements of the berth during and
after dredging.
S. GUCMA [4] (2007) This paper presents depth optimizing models at
ferry terminals, which take advantage of propeller jet velocities at the bottom,
determined by means of original simulation method. After adaptation; it may
be used to optimize the depths at any berth, for any type of vessels. This paper
is oriented the Swinoujscie Sea Ferries Terminal. The method was used to
determine the depth at the new building berth no 1 at Swinoujscie Sea Ferries
Terminal. The ships model that was used in simulations was worked out in
Institute of Marine Traffic Engineering at Maritime University of Szczecin.
The simulations of mooring maneuvers were conducted for maximum allowed
Ro-Pax ferry‟s at new building berth no 1 in Swinoujscie Sea Ferries
Terminal. Based on simulations results, existing bathymetrical and hydro
meteorological conditions and above detailed costs of designed berth No 1 at
Swinoujscie SFT, the safety depth at berth was set to 12.5 m. During the
whole optimization project, the depth of waterways near berth and southern
swinging area depth were considered as well.
DAVE SMITH et.al [5] (2004) The Vanterm container terminal is
located on the south shore of Burrard Inlet in Vancouver Harbour, about 3 km
east of Canada Place, the main cruise ship terminal in the Port. The terminal
berth structure utilized 23 concrete gravity caissons to provide a perimeter
about 800m long for ship berthing. In 2001,The extension of berth was to be
located along the west end of the Terminal, with dimensions of 79 m along the
wharf face and 52 m perpendicular to the face. Three phases of site
investigation were carried out, using truck-mounted rigs for on land drilling
and raft- or barge-mounted drills for offshore drilling. The apparent absence of
8. 8
the rock fill zone behind the caissons is also significant. Steel pipe piles of 914
mm diameter were selected for the Berth Extension, primarily because of their
availability in Vancouver. A total of 131 piles of 914 mm diameter and 19 mm
wall thickness were driven closed ended using a barge-mounted Delmag D62
diesel hammer. The piles varied in length from 25 to 60 m and were driven to
embedment depths of 10 to 20 m below mud line. Fifty of the piles were
vertical, 44 were battered at 1H: 20V and 37 were battered at 1H: 3V. The 1H:
3V piles had two mild steel Dywidag thread bars with Double Corrosion
Protection (DCP) installed to between 12 m and 25 m below the pile tips to
enhance the tension capacity of the pile. Conventional deck construction was
adopted for the structure. This consisted of piles arranged in bay lines spaced
8.1 m apart, parallel to the berth and crane rails, and capped with reinforced
cast-in-place pile caps and precast concrete deck panels spanning between the
pile caps. Batter piles were excluded from the crane rail pile caps to alleviate
concern over the very high concentrated loads from the crane wheels over pile
caps that would otherwise sustain some level of damage (primarily spalling of
the cover and shear cracking) as a result of pile over strength. The pile caps
with battered piles were designed based on an over strength capacity of the
battered piles. This was considered to be essential to avoid the excessive
damage typically associated with pile structures.
PREMALATHA, P.V. [6] (2011) This journal deals with the lateral
deflection of Berthing structure due to mooring/pulling force is more when
compared to berthing force. Among the three slopes (viz 1V:3H, 1V:2H and
1V:1.5H), slope 1V:3H is normally stable by itself and has the least deflection.
From the deformed mesh it is observed that the soil movement is much greater
in top layers of sandy soil. And it can be observed that the failure zone is like a
circular slip failure. When the dredge level is increased from 1V:3H to 1V:2H
and further to 1V:1.5H, the deflection of the Structure increases by 102% and
89.5% respectively. Hence tie rods are essential to reduce this increase in
9. 9
deflection. The effect of tie rod plays a major role in reducing the deflection of
the berthing structure thereby reducing the length of pile, material and
reinforcement used for construction. The variation in location of these anchors
through finite element modeling can be very helpful in analysing.
MUTHUKUMARAN K, et al. [7] Piles and a diaphragm wall of a
supported berthing structure on marine soils are loaded both axially and
laterally. Axial loads are typically generated by the self-weight of the structure
and external live loads; lateral loads are typically generated by wave current
and seismic loads. These loads are generally considered in the design of
berthing structures. However, the lateral force generated by lateral soil
movements due to dredging may not be considered or accounted in the design
of berthing structures. A study has been conducted on the earthquake damaged
structures of cargo berths No 1 to 5 at Kandla port, situated in Gujarat. The
original design slope for the cargo berths was 1V:3H.The design slope was
changed to 1V:1.5H because of silting. No mud slide force is considered for
the design slope of 1V: 3H, on the vertical piles. Analysis has been carried out
to know the forces and moments in the structure for pre-earthquake, during
earthquake and post-earthquake conditions. The stability of the slope can be
increased by the resisting action of piles on the berthing structures by offering
lateral resistance. The failure of vertical piles was due to the heavy lateral
forces during earthquake.
PREMALATHA P. V, et al. [8] (2011) This paper deals with the
study on pile group supporting the berthing structures subjected to
berthing/mooring forces and describes the analysis of experimental results
obtained from the laboratory test. The experimental setup is a single row of
instrumented piles reduced to a model scale. The berthing structure is analysed
for both berthing force and mooring force in sloping ground and horizontal
ground, with and without the provision of tie rod anchor. When the structure is
10. 10
connected with an anchor, part of the applied lateral load will be resisted by
the anchor. The usage of tie rod will help in reducing the deflection of the
structure and controls the forces that go to the piles, thereby reducing the
amount of reinforcement used and resulting in an economical design of the
structure.
11. 11
CHAPTER 3
METHODOLOGY
3.1 GENERAL
In this section the methodology of structural design for various
components of berth has been discussed. It consists of design of main beam,
secondary beam, deck slab and piles. The following codes have been used for
the design of the terminal.
Table No: 3.1 Reference Codes
IS 456: 2000 Code of practice for plain and reinforced concrete
IS 1893 Part 1 2002 Criteria for earthquake resistant design of structure.
IS 2911 Part 1 section
2 1979
Code of practice for design and construction of pile
foundation, concrete pile, bored cast in situ piles.
IS 4651
Part 1 1974
Part 3 1974
Part 4 1989
Code of practice for planning and design of ports
and harbours
Site investigations
Loading
General design considerations
SP 16 Design aids for reinforced concrete to IS 456 2000
3.2 SOFTWARE USED
STAAD Pro allows structural engineers to analyse and design virtually
any type of structure through its flexible modelling environment, advanced
features and fluent data collaboration. STAAD Pro features a state-of-the-art
12. 12
user interface, visualization tools. Flexible modelling is provided by a state-of-
the-art graphical environment and the design supports over 70 international
codes and over 20 U.S. codes in 7 languages.
In recent years it has become part of integrated structural analysis and
design solutions mainly using an exposed API called Open STAAD to access
and drive the program using a VB macro system included in the application or
other by including Open STAAD functionality in applications that themselves
include suitable programmable macro systems. Additionally STAAD Pro has
added direct links to applications such as RAM Connection and STAAD.
Foundation to provide engineers working with those applications which
handle design post processing not handled by STAAD Pro itself. Another form
of integration supported by STAAD Pro is the analysis schema of the CIM
steel Integration Standard, version 2 commonly known as CIS/2 and used by a
number modelling and analysis applications.
The commercial version STAAD Pro is one of the most widely used
structural analysis and design software. It supports several steel, concrete and
timber design codes.
It can make use of various forms of analysis from the traditional 1st
order static analysis, 2nd order p-delta analysis, geometric non-linear analysis
or a buckling analysis. It can also make use of various forms of dynamic
analysis from modal extraction to time history and response spectrum analysis.
3.3 DESIGN ASPECTS
3.3.1 Pile Layout
Diameter of pile and pile spacing is obtained from consideration of vertical
loads lateral loads (earth pressure, ship berthing or mooring loads) soil type
and structural capacities of piles.
13. 13
3.3.2 Beam Arrangement
There are 2 systems of beam one along the frame and another
interconnecting frames (longitudinal)
3.3.3 Slab Arrangement
The cast in situ slab is of 300mm thickness. Concrete grade is
M40.Reinforcement grade – Fe 500 for main bars and Fe 415 for distribution
steel. Fender boxes are provided to absorb mooring forces. Mooring facilities
like bollards are also provided.
3.3.4 Fenders
Fendering system has been designed to absorb the impact forces normal
and parallel to the berthing structure. The berth is designed for the berthing
force generated from a barge of 34522t displacements with a berthing velocity
of 0.3 m/s.
3.3.5 Bollards
Bollards of 90t capacity are provided on the berth.
3.3.6 Structural Details
The berthing structure consists of RCC deck supported on bored cast in-
situ piles of 1000mm diameter founded at -50m.
14. 14
CHAPTER 4
DATA COLLECTED
4.1 GENERAL
The proposed construction is for developing berthing facilities for
cruise ships calling at Cochin Port, extending the existing berths BTP. The
BTP shall be extended towards north for 82m length.
4.2. SITE CONDITIONS
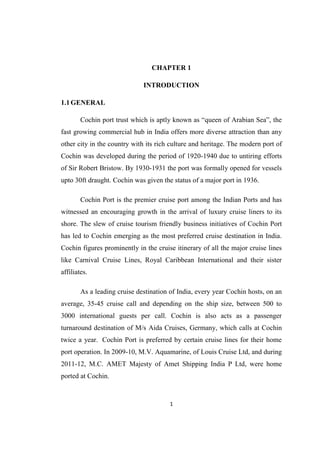
4.2.1 Location of Berth
Fig 4.1 Location of Proposed Berth
The proposed construction of berth for cruise berthing facilities has to
be done as an extension to the existing berth BTP which is located on the
western side of W/ Island (North End) in Mattancherry Channel. The site is
accessible from the Port‟s main traffic corridor - Indira Gandhi Road. The site
is accessible by road and through water.
15. 15
4.2.2 Reference level
All the levels are with reference to Port Chart Datum, which is at 0.582
m below Mean Sea Level.
4.2.3 Current
The maximum current expected in the area of work is about 0.5
metre/sec.
4.2.4 Waves
The work site is in the inner harbour area where generally calm
conditions prevail throughout the year.
4.2.5 Tide and Flood levels
The tides at Cochin are semi-diurnal with a marked daily inequality.
The various tidal levels in the area as per Naval Hydrographic Chart No.2004
are as indicated below.
Table No: 4.1 Tidal Levels
TIDE LEVELS (Metres)
Highest High Water Level +1.200m
Mean High Water Spring +0.920m
Mean Sea Level +0.582m
Mean High Water Neap +0.600m
Mean Low Water Neap +0.300m
Lowest Low Water Level +0.20m
16. 16
4.2.6 Wind
Wind at Cochin is highly influenced by the land and sea breezes. Wind
direction changes from north-east during morning hours to west during
evening for the period of October to May. During peak of south-west
monsoon, especially from June to September, predominant wind direction
remains south-west both during morning and evening hours. Due to strong
monsoon winds, effect of land winds is not dominant during south-west
monsoon. During the non-monsoon periods, the predominant wind direction is
from north east during the morning and west during the evening which shows
influence of land breeze.
4.2.7 Rainfall
The climate is characterized by dry and wet seasons. The wet seasons
starts in late May and ends in November. During this period, two monsoons
pass by one after another. The major monsoon is south-west monsoon which
lasts from June to September. This is followed by north-east monsoon during
October and November. The average annual rainfall is about 3000mm; and the
major portion is during south-west monsoon.
4.2.8 Temperature
Cochin experiences moderate temperatures throughout the year. The
temperature varies from 22 °C to 34 °C. The low temperature occurs during
the southwest monsoon, December and January. Daytime temperature goes
upto 30 °C even during this period. The hot months are from March to May.
17. 17
4.2.9 Sub Soil Data
Table No: 4.2 Subsoil Data
Reduced level (m) N value C (t/m2
)
-12 to -15 10 5
-15 to -20 20 7.61
-20 to -25 30 13.367
-25 to -30 45 18.17
-30 to -35 45 22
Below -35 50 22.50
4.3 MATERIALS
4.3.1 Cement
Quality of cement used for the work must be 43 grade ordinary
Portland cement conforming to I.S. 8112 or 53 grade ordinary Portland cement
conforming to I.S. 12269 or Pozzolona cement conforming to I.S. 1489.
4.3.2 Steel Reinforcement
The reinforcement steel used for the work must be Corrosion Resistant
Steel (CRS)/ ordinary quality HYSD bars of Fe500 / Fe415 grade conforming
to I.S. For checking nominal mass, tensile strength, bend test etc., specimen of
sufficient length as per I.S. 432/ I.S. 1608/ I.S. 1599 or can be cut from each
size of the bar at random at frequency not less than the specified below
18. 18
Table No: 4.3 Specifications of Bars
Size of bar
For Consignment
Over100 tonnes
For Consignment
Below 100 tonnes
Under 10 mm
diameter
One sample for each 25
tonnes
One sample for each 40
tonnes
10 mm to 16 mm
diameter
One sample for each 35
tonnes
One sample for each 45
tonnes
Over 16 mm diameter One sample for each 45
tonnes
One sample for each 50
tonnes
4.3.3 „D‟ Type Rubber Fender
„D‟ type rubber fender to be used on work is of sizes 150mm x 150mm.
The rubber used for manufacturing rubber fender is as per ASTM-D-2000-
98c.
4.3.4 Design Mix
For design mix concrete of following grades of concrete the minimum
cement content per cubic metre and maximum water cement ratio are as given
below.
Table No: 4.4 Design Mix
Sl No Grade of Concrete Minimum cement
content in Kg / m³
Maximum free
Water cement ratio
1 M20 350 0.55
2 M35 (pile foundation) 450 0.40
3 M40 (deck structure) 450 0.40
4 M30 400 0.50
19. 19
4.3.5 Assembly of Reinforcement for Reinforced Cement Concrete.
Reinforcement is to be cut to the exact length and made truly straight
and then bent to the exact shape and dimensions. The bending and fixing of
bars are in accordance with I.S. 2502.
4.4 LOAD TEST ON PILE
4.4.1 General
The load test are conducted to provide data regarding the load
settlement characteristics of the piles up to failure or otherwise as specified
and to assess the safe design capacity. The test set up and test procedure are in
accordance with the provisions of I.S. 2911 (Part IV), “Code of practice for
Design and Construction of Pile Foundations, Part IV - Load Test on Piles”,
modified to the extent given below.
a) The load shall be applied to the pile top in increments of not exceeding one
fifth of estimated safe load of pile specified elsewhere. Settlement reading
shall be taken before and after application of each new load increment and at
2, 4, 8, 15 minutes and at every 15 minutes thereafter. Each stage of loading
shall be maintained till the rate of movement of the pile top is not more than
0.20 mm per hour or a minimum of 2 hours whichever is later.
b) At the stage when loading reaches the estimated safe load, the load shall be
maintained for a period of 24 hours. Settlement observations shall be made
before and after the application of this stage of loading and at 2,4,8,15,30 and
60 minutes and at every 60 minutes thereafter.
c) Further loading and observations shall then be continued as in (a) above, till
any of the two conditions given under for the following tests is achieved.
I. Initial load test
i) Settlement of the pile reaches a value of one tenth of the pile diameter.
20. 20
ii) Maximum test load on the pile which is equal to twice the estimated safe
load.
II. Routine load test
i) The settlement of the pile top is 12 mm.
ii) Maximum test load on the pile which is equal to 1.50 times the estimated
safe load is reached.
d) Where yielding of soil pile system does not occur the maximum test load
shall be maintained on the pile head for 24 hours and settlement readings shall
be taken at 2,4,8,15,30 and 60 minutes and at one hour intervals thereafter.
e) Unloading shall be carried out in the same steps as loading. A minimum
period of 30 minutes shall be allowed to elapse between two successive stages
of load decrement. The rebound observations shall be continued upto 6 hours
after the entire test load has been removed.
21. 21
CHAPTER 5
MODELLING OF STRUCTURE
Fig 5.1 Model
Main Beam =
Secondary Beam =
Pile = 1000mm diameter
Plate Thickness = 0.25m
23. 23
CHAPTER 6
LOADS ON STRUCTURE
6.1 DESIGN VESSEL DETAILS
LOA = 268m
Beam = 32.2m
Draft = 7.4m
Displacement tonnage = 34522t
Design vessel details of largest cruise vessel
LOA = 345m
Beam = 41m
Draft = 10m
Displacement tonnage = 76378t
6.2 TECHNICAL DETAILS
For piles fck=30N/mm2
For beams of slabs fck=40N/mm2
According to IS 1789-1979,
For main reinforcement fy = 500N/mm2
For secondary reinforcement fy = 415N/mm2
Wearing Course = 75mm tk
R.C Slab = 250mm tk
Main beam =
Secondary beam =
Pile diameter = 1000mm
Pile cap =
24. 24
6.3 CALCULATION
(i). Self-weight of pile cap =( ) ( )
= 27.14 kN/ m2
Weight of slab =
= 6.25kN/m2
(ii). Vertical Live Loads
According to IS: 4651 part 3-1974 Page 5, table: 1
Uniform vertical live load = 5t/m2
= 50kN/m2
(iii). Horizontal Force Due to Berthing
Displacement tonnage = 34522t
As per IS: 4651 Part 3, Clause 5.2.1.3 (b) page 9,
Angle = 10
As per IS: 4651 Part 3 page 6,
Berthing energy =
As per IS: 4651 Part 3 page no:8
Mass coefficient, Cm =
=
=1.459
As per IS: 4651 part 3-1974, clause 5.2.1.3(a)
Eccentricity Coefficient =
( )
( )
=
( )
( )
=0.52
25. 25
As per IS: 4651 Part 3 page no: 10
Stiffness coefficient Cs =0.95
V =0.15(for sheltered)
Berthing energy = ( ) ( )
=28.53t
As per IS: 4651 part 4 page no: 5 clause: 9.3(e)
Ultimate energy =
=
= 39.94t
From IRM catalogue,
E≈50.2
Reaction = 99.5t
Deflection = 52.5%
Fender = DC1150H
(iv) Mooring Load
As per IS: 4651 part 3 Page no: 11 table 4
Bollard Pull =90t
There are 4 cases
Case 1: Perpendicular to Berth
Fz =900kN
Case 2: Acting at 45° to Berth
Fz =
= 636.39kN
Fx =
=636.39kN
Case 3: Acting at 30° to Vertical
Fy =
= 450 kN
26. 26
Fz =
= 779.42kN
Case 4: Acting at 45° to the Berth and 30° to Vertical
Fy =
=450kN
Fz =
= 551.135kN
Fx =
=551.135kN
(v) Seismic Load
As per 1893 part 1 2002 page 14, clause 6.4.2,
R =3
Ah =
Moderate Seismic Zone, Z= 0.16 (from table 2)
As per table 6, Page 18, IS: 1893 Part 1 2002,
I = 1
As per IS 1893 part 1 2002 Page 24, clause 7.6.1,
T =
=
=0.421
= 2.22
Ah =
= 0.06
As per IS: 1893 Part 1 2002, clause 6.4.4, Underground structures and
foundations at a depth of 30m or below
Ah =
=0.03
27. 27
(vi) Design Seismic Base Shear
V = AhW (from page 24, IS 1893 Part 1 2002)
X Direction,
For end row piles,
Wearing coat = ( )
= 541.2kN
Weight of slab = ( )
= 2050kN
Weight of main beam = ( )
= 96kN
Weight of secondary beam =
= 1476kN
Weight of pile cap =
= 709.8kN
Weight of pile =
= 2478.89 kN
Total dead load =
= 7351.89kN
Live load = 50 kN/m2
Total live load = ( )
= 16400kN
Total load =
= ( )
= 15551.8kN
Load on each pile = 1110.85kN
28. 28
Horizontal Seismic Load, VB
= AhW
=
=33.32 kN
For middle row piles
Wearing coat = ( )
=541.2kN
Weight of slab = ( )
=2050 kN
Weight of main beam =
=96kN
Weight of secondary beam=
=1476kN
Weight of pile + weight of pile cap
=*( ) ( )+
=1039.66 kN
Total dead load ( ) = kN
Live load ( ) =
=16400kN
Total load =
= ( )
29. 29
=13402.86 kN
Loads act on 14 piles,
Therefore the load acting on a single pile
=
=957.35kN
Horizontal seismic load =Ah
=
= 28.72kN
2. Along Z direction
For end row pile,
Wearing coat = ( )
= 99kN
Weight of slab = ( )
=375kN
Weight of main beam = ( )
= 120kN
Weight of secondary beam =
= 216kN
Weight of pile + weight of pile cap
30. 30
= ( )
= 741.14kN
Total dead load ( ) = 1551.14 kN
Live load = ( )
= 3000 kN
Total load = ( )
=
= 3051.14kN
Load acts on 3 piles,
Therefore load on each pile=
= 1017.05kN
Horizontal seismic load = Ahw
=
= 30.51kN
For middle row pile,
Wearing coat = ( )
= 73.65kN
Weight of slab = ( )
=450kN
31. 31
Weight of main beam = ( )
=144kN
Weight of secondary beam =
= 648 kN
Weight of pile + pile cap = 741.14 kN
Total dead load ( ) = 2056.79 kN
Live load = ( )
= 3600kN
Total load = ( )
= 2056.79 (( ) )
=3856.79kN
Load acts on 3 piles,
Therefore load on each pile =
= 1285.59kN
Horizontal seismic load = AhW
=
= 38.567 kN
(vii). Fender load
37. 37
CHAPTER 8
STRUCTURAL DESIGN
8.1 LOAD CARRYING CAPACITY OF PILE
Table No: 8.1 Geotechnical Data
Depth (m) N C (t/m2) α
-12 to -15 10 5.00 0.90
-15 to -20 20 7.61 0.60
-20 to -25 30 13.67 0.32
-25 to -30 45 18.17 0.28
-30 to -35 45 22.00 0.28
Below -35 50 22.50 0.28
Fixity Length = 10m
Bed Level = -13.5m
Ultimate load carrying capacity, ∑
Where α = reduction factor
C= cohesion of soil throughout the length of pile
= Surface area of pile
= Cross sectional area of pile toe
= Bearing capacity factor, usually taken as 9
= Cohesion of soil at pile tip
Capacity at -50m,
38. 38
= = 159 t
∑ = ( ) ( )
( ) ( )
( ) ( )
=553.67 t
= 159 + 553.67 =712.67 t
= 712.67 / 2.5 = 285.066 t > 248.6 t
Table No: 8.2 Maximum Loads on Piles
SL NO LOAD CASE AXIAL LOAD (kN)
1 DL + LL 2165.96
2 DL + LL + T 2200.731
3 DL + LL + T + MF 1.1 2450.185
4 DL + LL + T + MF 1.2 2397.176
5 DL + LL + T + MF 1.3 2343.689
6 DL + LL + T + MF 1.4 2290.972
7 DL + LL + T + MF 1.5 2239.134
8 DL + LL + T + MF 1.6 2213.516
9 DL + LL + T + MF 2.1 2394.319
10 DL + LL + T + MF 2.2 2356.964
11 DL + LL + T + MF 2.3 2319.061
12 DL + LL + T + MF 2.4 2281.539
13 DL + LL + T + MF 2.5 2244.638
14 DL + LL + T + MF 2.6 2208.286
15 DL + LL + T + MF 3.1 2336.398
16 DL + LL + T + MF 3.2 2290.508
39. 39
17 DL + LL + T + MF 3.3 2323.97
18 DL + LL + T + MF 3.4 2278.239
19 DL + LL + T + MF 3.5 2233.715
20 DL + LL + T + MF 3.6 2211.711
21 DL + LL + T + MF 4.1 2288.017
22 DL + LL + T + MF 4.2 2255.683
23 DL + LL + T + MF 4.3 2302.643
24 DL + LL + T + MF 4.4 2270.069
25 DL + LL + T + MF 4.5 2238.481
26 DL + LL + T + MF 4.6 2207.366
27 DL + LL + T + SCX + VE 1569.157
28 DL + LL + T + SCX – VE 1669.46
29 DL + LL + T + SCZ + VE 1754.816
30 DL + LL + T + SCZ – VE 1754.876
31 DL + LL + T + F1 2485.849
32 DL + LL + T + F2 2427.336
33 DL + LL + T + F3 2368.2
34 DL + LL + T + F4 2309.802
35 DL + LL + T + F5 2252.375
36 DL + LL + T + F6 2207.121
Maximum axial load from STAAD = 248.6t
41. 41
26 DL+LL+T+MF4,6 1892.5 27.62 330.781
27 DL+LL+T+SCX VE 1901.693 27.44 -971.922
28 DL+LL+T+SCX VE 1625.401 783.735 -331.499
29 DL+LL+T+SCZ VE 1625.401 -783.735 -331.499
30 DL+LL+T+SCZ VE 1705.071 -501.866 -270.053
31 DL+LL+T+F1 1705.058 -175.668 -270.105
32 DL+LL+T+F2 1705.034 153.973 -270.204
33 DL+LL+T+F3 1704.999 491.125 -270.35
34 DL+LL+T+F4 1704.952 839.251 -270.544
35 DL+LL+T+F5 1704.896 1199.84 -270.765
36 DL+LL+T+F6 3310.681 -21.693 -391.395
From STAAD, Maximum axial force = 3728.774 kN
8.2 DESIGN OF PILE
Assuming a clear cover of 85mm, diameter of longitudinal
reinforcement as 32mm and diameter of helical reinforcement as10mm.
Maximum axial force = 3728.774 kN
Maximum Bending, =√( ) ( ) =1175.19kNm
=
Fixity level = 10m
Effective Length = 1.2 × fixity
= 1.2 × 10 = 12m
Moment due to minimum eccentricity,
= = 5.733mm > 2
42. 42
M = P × e
= 3728.774 × 0.0573
= 213.658 kNm <
Additional moment due to slenderness,
As per IS 456: 2000, Clause 39.7.1,
Slenderness moment = * +
= * +
= 268.471 kNm
Total moment = 1175.9 + 268.471
= 1443.66 kNm
Therefore design for 1443.66 kNm
Use M30 concrete and Fe 500 steel.
= = 0.124
= = 0.05
From SP 16, Page no: 145 Chart 60,
= 0.025
Pt = 0.75%
= 0.75 %
43. 43
Ast =
= 5890.48 mm2
No of bars =
= 7 Nos.
So provided area = 5630 mm2
(i) Helical Reinforcement
According to clause 5.11.3 of IS 2911: 1979, Part 1, Section 2, the
minimum diameter of spiral should not be less than 150mm, hence provide
diameter of 10mm spirals at 200mm pitch.
(ii) Curtailment and Anchorage Details of Reinforcement
The bars are to be kept uncurtailed for 25m and after that only minimum
reinforcement is required.
Minimum reinforcement = 0.4% of sectional area.
As per clause 5.11.1, IS 2911: 1979, Part 1, Section 2,
Minimum reinforcement = = 3141.59mm2
Provide 6 no of bar of 25mm diameter.
44. 44
8.3 DESIGN OF PILE CAP
Using M40 grade and Fe 500 steel,
Size = 1.3m 1.3m 1.2m
Clear cover = 85mm
Effective depth, d =
= 1207mm
Maximum axial force = 3728.774 kN
As per IS 2922 Part 1 Section 2, Maximum permissible shift of pile is 50mm
= Axial load shift
=186.4387 kNm
Depth required = √ = √
= 164.187
Depth provided Depth required
Hence safe.
(i) Reinforcement Calculation
Minimum reinforcement = 0.12% of area
= = 2028mm2
No of bars = = 10 Nos.
Provide 5 No of bars of 16mm diameter at top and bottom and also at sides.
46. 46
24 DL+LL+T+MF4.4 955.91 -919.633 1047.526 -1202.39
25 DL+LL+T+MF4.5 975.926 -939.649 1229.49 -1255.45
26 DL+LL+T+MF4,6 995.74 -959.463 435.783 -492.25
27 DL+LL+T+SCX VE 474.293 -456 508.252 -508.252
28 DL+LL+T+SCX VE 486.016 -464.495 507.23 -500.267
29 DL+LL+T+SCZ VE 711.107 -689.585 1021.673 -949.68
30 DL+LL+T+SCZ VE 711.107 -689.585 2045.723 -1407.32
31 DL+LL+T+F1 1291.72 -1255.44 1772.855 -1185.34
32 DL+LL+T+F2 1189.941 -1153.66 1504.095 -983.42
33 DL+LL+T+F3 1080.433 -1053.48 1322.018 -1129.77
34 DL+LL+T+F4 1017.622 -981.345 1566.098 -1408.28
35 DL+LL+T+F5 1111.394 -1075.12 1836.49 -1696.38
36 DL+LL+T+F6 1212.211 -1175.93 1836.49 -1696.38
The bending moment and shear force values of the main beams where taken
from STAAD output.
Grade of concrete = M40
Steel = Fe 500
Size of beam = 0.8m × 1.2m
Clear cover = 65mm
Effective depth =
= 1122.5mm
At support section,
Design moment = 2045.723kNm
= * +
47. 47
2045.723 × = * +
Ast = 4457.866mm2
Minimum tension steel required, =
As =
= 1526.6mm2
Area of one bar of diameter of 32mm = 804.24mm2
Provide 7 bars of 32mm diameter as main reinforcement.
At mid-section,
Design moment = -1902.032kNm
= * +
1902.032 × 106
= * +
Ast = 4132.82mm2
Minimum tension steel required, =
As = = 1526.6mm2
Area of one bar of diameter of 32mm = 804.24mm2
Provide 8 bars of 32mm diameter as main reinforcement.
(i) Curtailment of Tension Reinforcement
From IS 456:2000, Clause 26.2.3, For curtailment reinforcement shall extent
beyond the point at which it is no longer required to resist flexure for a
48. 48
distance equal to the effective depth of the member for 12times the bar
diameter, which is greater except at simply supported or end of cantilever.
Hence 3 bars of support reinforcement are curtailed after a distance of 2m
from the support and 3 bars of mid span reinforcement are curtailed at a
distance of 1m from the support.
(ii) Design for Shear
Maximum shear required Asv = =
= 147.126mm2
Maximum shear at section = 1291.720kN
Grade = Fe 415
Shear stress =
=
=2.876 N/mm2
= = 4.592
= 1.01 N/mm2
(As per IS 456:2000 table 19, Page no.73)
= 4 N/mm2
(As per table 20, Page no.73)
Hence shear reinforcement are required.
Shear to be resisted, = – (From Page no.73, Clause 40.4, IS 456:
2000)
Design shear = 1291.720kN
49. 49
= 1291.720 × –
= 384740 N
= 384.74 kN
Spacing shear stirrups required =
=
= 847.22mm
Hence provide 16mm diameter of 4 legged stirrups of 200mm c/c.
From IS 13920, Clause 6.3.5,
The spacing of hoops over a length of 2d at either end of span shall not
exceed;
(1) = 280.62mm
(2) 8 times diameter of the smallest longitudinal bar = 256mm. hence the
hoops are provided with a spacing of 200mm c/c.
51. 51
24 DD+LL+T+MF4.4 457.691 -432.017 443.988 -517.029
25 DD+LL+T+MF4.5 453.612 -427.938 449.908 -503.661
26 DD+LL+T+MF4.6 449.776 -424.101 462.915 -490.845
27 DD+LL+T+SCX VE 451.856 -426.182 478.097 -496.952
28 DD+LL+T+SCX VE 285.7 -272.661 333.339 -406.096
29 DD+LL+T+SCZ VE 309.763 -296.723 428.411 -317.91
30 DD+LL+T+SCZ VE 253.951 -240.912 295.145 -295.379
31 DD+LL+T+F1 253.951 -240.912 295.145 -295.379
32 DD+LL+T+F2 467.188 -441.514 521.08 -546.429
33 DD+LL+T+F3 468.489 -442.815 505.654 -520.033
34 DD+LL+T+F4 469.578 -443.904 499.041 -494.883
35 DD+LL+T+F5 470.351 -444.677 505.925 -470.887
36 DD+LL+T+F6 470.934 -445.26 527.974 -452.541
Grade of concrete =M40
Steel = Fe500
Size of beam =
Clear cover = 65mm
Effective depth =
At support section,
Design moment = kNm
From IS 456:2000 G1.1
Mu = ( )
52. 52
( )
Minimum tension steel required =
As =
Area of 1 bar of Diameter 25mm
Provide 4 numbers of bars of diameter 25mm as main reinforcement.
At mid span,
Design moment
Mu = ( )
( )
=
Minimum tension steel required, =
=
Area of 1 bar of diameter 25 mm =
Provide 4 numbers of bars of 25mm diameter as main reinforcement
53. 53
(i) Curtailment of Tension Reinforcement
From IS456:2000, CI 26.2.3, for curtailment reinforcement shall extent
beyond the point at which it is no longer required resist flexure for a distance
equal to the effective depth of the member or 12 times bar diameter, which is
greater except at simply support or end of cantilever .hence 3 bars of support
reinforcement are curtailed after a distance of 2 m from the support and the
mid span reinforcement is continued.
(ii) Design of Shear
Minimum shear steel required,
=
=
Maximum shear at section =
Grade of concrete: Fe415
Shear stress, =
= ⁄
Percentage of steel,
As per IS 456:2000 pg no 73, table 19
⁄
As per IS 456:2000 pg no 73, table 20
⁄
54. 54
Hence the shear reinforcement is required.
As per IS 456:2000 Page no: 73 clause 40.4(c)
Shear to be resisted,
( )
=
=
Diameter of shear stirrups =
Number of legs for each stirrups =2 No‟s
Spacing of shear stirrups required =
=
( )
=
Hence provide 12 mm diameter 2 legged stirrups at 200mm c/c
From IS 13920:1993 clause 6.3.5, spacing of hoops over a length of 2d at
either end of span shall not exceed.
1.
2. 8 times diameter of the smallest longitudinal bar =
Hence the hoops are produced with a spacing of 150mm c/c.
55. 55
8.6 CHECK FOR CRACK WIDTH OF MAIN BEAM
Maximum bending moment = 1902.032kNm
Ast =
=5629.73mm2
As per IS 456 annexure f, page 90
= =
=0.189 < 0.46
( )
= ( )
€1 =
( )
= ×
= 0.00175
b1 = 1000
€m = €1 -
( ) ( )
( )
=0.00175 -
( ) ( )
( )
= 0.00143
= ( )
57. 57
=0.001421 -
( ) ( )
( )
=0.001188
= ( )
= ( )
=0.2301mm
Maximum allowable crack width = 0.004 65
= 0.26mm
0.2301 < 0.26 mm
Hence safe.
8.7 EARTHQUAKE DETAILING (IS: 13920) OF MAIN BEAM
1. Minimum Reinforcement
=
√
= 0.304%
Provided 0.5% at support and 0.74% at mid span
2. Maximum Reinforcement
Provided 0.5% at support and 0.74% at mid span
3. Bottom Reinforcement at support
Provide 9 bars of 32mm diameter
Therefore, =
= 7234.6mm2
4. At any section
Top and bottom reinforcement =
58. 58
=
=1114.46
Minimum steel available = 6 bars of 32mm diameter
= 4825.486mm2
5. Shear reinforcement at either ends of beam to a length of 2d
= 2 × 1122.5
=2245mm
Spacing should not be greater than
(i) = = 280.6mm
(ii) Smallest diameter of bar = 8 × 32 = 256mm
For remaining length provide at = 561.25mm
8.8 CHECK FOR CRACK WIDTH OF SECONDARY BEAM
Maximum bending moment at bottom = 559.27kNm
Ast =
=1963.49mm2
As per IS 456 annexure f, page 90
= =
= 0.180 < 0.46
( )
= ( )
61. 61
8.9 EARTHQUAKE DETAILING (IS: 13920) OF SECONDARY BEAM
1. Minimum Reinforcement
=
√
= 0.304%
Provided 0.5% at support and 0.74% at mid span
2. Maximum Reinforcement
Provided 0.5% at support and 0.74% at mid span
3. Bottom Reinforcement at support
Provide 6 bars of 25mm diameter
Therefore, =
= 2945.24mm2
4. At any section
Top and bottom reinforcement =
=
=738.56mm2
Minimum steel available = 6 bars of 25mm diameter
= 2945.24mm2
5. Shear reinforcement at either ends of beam to a length of 2d
= 2 × 822.5
=1645mm
Spacing should not be greater than
(i) = = 205.6mm
(ii) Smallest diameter of bar = 8 × 25 = 200mm
For remaining length provide at = 411.25mm.
62. 62
CHAPTER 9
CONCLUSION
During the course of project, we determined the different loads and
forces that are likely to act on the structure and our analysis and subsequent
design has shown that the berthing is capable to handling the external loads
and forces safely.
The technical feasibility of the project is definitely within the confines
of Cochin Port Trust. In spite of the adequate facilities available for the vessels
calling at Cochin Port the construction of cruise berth terminal helps to
improve the berthing facilities for the approach of the largest vessels.
63. 63
REFERENCES:
1. Evaluation and Design for Wharf Berth Improvements Xavier C. Barrett1,
PE, Satrajit Das2, PhD, PE, M.ASCE, Richard C. Wells3, PE, F.ASCE and
Dennis K. Hoyle4, PE
2. SeismicAnalysis and Design of Berth 14 Extension. Balboa, Panama J.Paul
Smith- Pardo,Ph.D.PE and Christopher B.Cornell,MASCE,PE,SE
3. Effect of Dredging and Axial Load on a Berthing Structure by K.
Muthukkumaran, R. Sundaravadivelu, S.R. Gandhi (2007). International
Journal of Geoengineering Case histories, Vol.1, Issue 2, p.73-88.
4. Depth Optimization of Designed New Ferry Berth by S. Gucma & S.
Jankowski. International Journal on Marine Navigation and Safety of Sea
Transportation, Volume 1, Number 4.
5. Seismic Design of a New Pile and Duck Structure Adjacent to Existing
Cassions Founded on Potentially Liquefiable Ground in Vancouver, Berth By:
Dave Smith
6. Effect of Dredging and Tie-Rod anchor on the Behavior of Berthing
By:Premalatha P.V., Muthukumaran K, & JayapalanP
7. Behaviour of Berthing Structure under Changing Slope in Seismic
Condition -A Case Study by K. Muthukkumaran, R. Sundaravadivelu, S.R.
Gandhi.
8. Behaviour of piles supported berthing structure under lateral loads -
Premalatha P. V, Muthukkumaran. K & Jayabalan P ( PanAm CGS 2011)