
Recommended
Recommended
More Related Content
What's hot
What's hot (18)
Similar to New Vapor Pressure Method
Similar to New Vapor Pressure Method (20)
Recently uploaded
Recently uploaded (20)
New Vapor Pressure Method
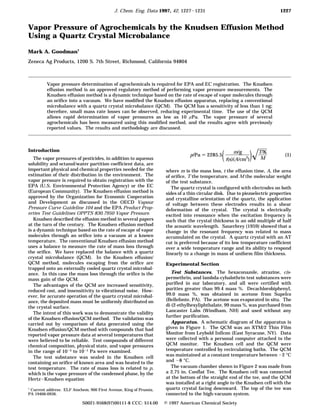
- 1. J. Chem. Eng. Data 1997, 42, 1227-1231 1227 Vapor Pressure of Agrochemicals by the Knudsen Effusion Method Using a Quartz Crystal Microbalance Mark A. Goodman† Zeneca Ag Products, 1200 S. 7th Street, Richmond, California 94804 Vapor pressure determination of agrochemicals is required for EPA and EC registration. The Knudsen effusion method is an approved regulatory method of performing vapor pressure measurements. The Knudsen effusion method is a dynamic technique based on the rate of escape of vapor molecules through an orifice into a vacuum. We have modified the Knudsen effusion apparatus, replacing a conventional microbalance with a quartz crystal microbalance (QCM). The QCM has a sensitivity of less than 1 ng; therefore, small mass rate losses can be observed, reducing experimental time. The use of the QCM allows rapid determination of vapor pressures as low as 10 µPa. The vapor pressure of several agrochemicals has been measured using this modified method, and the results agree with previously reported values. The results and methodology are discussed. ( ) Introduction m/g T/K p/Pa ) 2285.5 (1) The vapor pressures of pesticides, in addition to aqueous t(s)(A/cm2) M solubility and octanol/water partition coefficient data, are important physical and chemical properties needed for the where m is the mass loss, t the effusion time, A, the area estimation of their distribution in the environment. The of orifice, T the temperature, and M the molecular weight vapor pressure is required to obtain registration with the of the test substance. EPA (U.S. Environmental Protection Agency) or the EC The quartz crystal is configured with electrodes on both (European Community). The Knudsen effusion method is sides of a thin circular disk. Due to piezoelectric properties approved by the Organization for Economic Cooperation and crystalline orientation of the quartz, the application and Development as discussed in the OECD Vapour of voltage between these electrodes results in a shear Pressure Curve Guideline 104 and the EPA Product Prop- deformation of the crystal. The crystal is electrically erties Test Guidelines OPPTS 830.7950 Vapor Pressure. excited into resonance when the excitation frequency is Knudsen described the effusion method in several papers such that the crystal thickness is an odd multiple of half at the turn of the century. The Knudsen effusion method the acoustic wavelength. Sauerbrey (1959) showed that a is a dynamic technique based on the rate of escape of vapor change in the resonant frequency was related to mass molecules through an orifice into a vacuum at a known accumulated on the crystal. A quartz crystal with an AT temperature. The conventional Knudsen effusion method cut is preferred because of its low temperature coefficient uses a balance to measure the rate of mass loss through over a wide temperature range and its ability to respond the orifice. We have replaced the balance with a quartz linearly to a change in mass of uniform film thickness. crystal microbalance (QCM). In the Knudsen effusion/ QCM method, molecules escaping from the orifice are Experimental Section trapped onto an externally cooled quartz crystal microbal- ance. In this case the mass loss through the orifice is the Test Substances. The hexaconazole, atrazine, cis- mass gain of the QCM. permethrin, and lambda-cyhalothrin test substances were The advantages of the QCM are increased sensitivity, purified in our laboratory, and all were certified with reduced cost, and insensitivity to vibrational noise. How- purities greater than 99.4 mass %. Decachlorobiphenyl, ever, for accurate operation of the quartz crystal microbal- 99.0 mass %, was obtained in acetone from Supelco ance, the deposited mass must be uniformly distributed on (Bellefonte, PA). The acetone was evaporated in situ. The the crystal surface. di-(2-ethylhexyl)phthalate, 99 mass %, was purchased from Lancaster Labs (Windham, NH) and used without any The intent of this work was to demonstrate the validity further purification. of the Knudsen effusion/QCM method. The validation was carried out by comparison of data generated using the Apparatus. A schematic diagram of the apparatus is Knudsen effusion/QCM method with compounds that had given in Figure 1. The QCM was an XTM/2 Thin Film reported vapor pressure data at several temperatures that Monitor from Leybold Inficon (East Syracuse, NY). Data were believed to be reliable. Test compounds of different were collected with a personal computer attached to the chemical composition, physical state, and vapor pressures QCM monitor. The Knudsen cell and the QCM were in the range of 10-5 to 10-1 Pa were examined. temperature controlled by recirculating baths. The QCM The test substance was sealed in the Knudsen cell was maintained at a constant temperature between -2 °C containing an orifice of known area and was heated to the and -8 °C. test temperature. The rate of mass loss is related to p, The vacuum chamber shown in Figure 2 was made from which is the vapor pressure of the condensed phase, by the a 2.75 in. Conflat Tee. The Knudsen cell was connected Hertz-Knudsen equation at the bottom of the straight end of the tee, and the QCM was installed at a right angle to the Knudsen cell with the †Current address: ELF Atochem, 900 First Avenue, King of Prussia, quartz crystal facing downward. The top of the tee was PA 19406-0936. connected to the high-vacuum system. S0021-9568(97)00111-8 CCC: $14.00 © 1997 American Chemical Society
- 2. 1228 Journal of Chemical and Engineering Data, Vol. 42, No. 6, 1997 Table 1. Vapor Pressure Data for Atrazine p/mPa p/mPa t/°C na (this work)b (Grayson and Fosbraey, 1982) 40 2 0.67 0.75 50 3 2.2 2.9 60 3 9.5 10 70 3 30 35 80 5 98 110 a n ) number of determinations. b 0.381 mm diameter orifice with 0.203 mm thickness. Figure 1. Knudsen effusion method apparatus: A, recirculating bath; B, vacuum chamber containing the Knudsen cell (see Figures 2 and 3) and QCM; C, turbomolecular pump; D, roughing pump; E, computer for data collection; F, QCM; G, oscillator. Figure 4. Plot of vapor pressure data for atrazine: b, this work; s, Grayson and Fosbraey (1982). 40 °C lower in temperature than the Knudsen cell tem- perature. The distance from the top of the Knudsen cell to the top of the QCM holder was 3.4 mm. Experimental Procedure The Knudsen cell was filled with enough material to coat the bottom, to ensure good thermal conduction to the test substance. The Knudsen cell cap was installed on the Knudsen cell with an appropriate orifice plate. The QCM was installed into the vacuum chamber. The Figure 2. Vacuum chamber: A, Knudsen cell (see Figure 3); B, QCM was equipped with cooling lines that were connected heating lines connected to recirculating pump; C, QCM; D, cooling to a constant temperature recirculating bath. A second lines for QCM; E, cable to oscillator; F, heating chamber; G, recirculating bath was connected to the Knudsen cell vacuum source. heating chamber and set to the test temperature. The vacuum system was initiated. At a given test temperature, the change in mass was measured over a period of 5 to 20 min at 15 to 60 s intervals. A least-squares regression fit of the mass data was performed yielding the slope in g s-1, which was used to calculate the vapor pressure using eq 1. Mass and time data were collected in at least duplicate at a given temperature with the average vapor pressure being reported. The measured vapor pressures were used to determine the constants A and B in the following integrated form of the Clausius-Clapeyron equation using a least-squares Figure 3. Top portion of the Knudsen cell: A, Knudsen cell method. chamber; B, cap for Knudsen cell; C, O-rings for sealing cap and orifice plate; D, orifice plate. B log10(p/Pa) ) A - (2) T/K The Knudsen cell design is presented in Figure 3. The orifice plate was made from either 0.127 mm or 0.203 mm Results 302/304 stainless steel shim stock. Orifices were mechani- Atrazine, because of its moderate volatility, was near the cally or laser drilled. upper limit of this method. The atrazine data were In the classical Knudsen vapor pressure experiment, the collected using an orifice plate with a 0.381 mm orifice Knudsen effusion cell is an integral part of the balance. diameter. The vapor pressure data are presented in Table As molecules escape through the orifice into the vacuum, 1. For comparison vapor pressure data reported by Gray- the mass of the Knudsen cell is reduced. son and Fosbraey (1982) are presented as a Clausius- Our Knudsen effusion/QCM experiment is different, in Clapeyron plot with our data in Figure 4. that the molecules escaping from the Knudsen cell are Decachlorobiphenyl was chosen because of its low vola- trapped onto the QCM. The mass loss from the Knudsen tility. Due to the sensitivity of the QCM, a small sample cell is the mass gain of the QCM. To ensure that molecules size can be used. The vapor pressure data for decachlo- are not vaporized from the quartz crystal, it is kept at least robiphenyl were collected using only 400 µg of sample.
- 3. Journal of Chemical and Engineering Data, Vol. 42, No. 6, 1997 1229 Table 2. Vapor Pressure Data for Decachlorobiphenyl Table 4. Vapor Pressure Data for cis-Permethrin p/µPa p/µPa p/µPa p/µPa t/°C na (this work)b (Burkhard et al., 1984) t/°C na (this work)a (Wollerton and Husband) 65 3 26 29 40 3 14 4.1 70 2 51 46 50 2 110 150 75 3 81 74 60 2 530 520 80 3 110 120 70 3 2300 1700 85 3 180 180 80 3 8900 5000 a n ) number of determinations. b 0.381 mm diameter orifice a n ) number of determinations. b 0.381 mm diameter orifice with 0.203 mm thickness. with 0.203 mm thickness. Figure 5. Plot of vapor pressure data for decachlorobiphenyl: b, Figure 7. Plot of vapor pressure data for cis-permethrin: b, this this work; s, Burkhard et al. (1984). work; s, Wells and Wollerton, (1989). Table 3. Vapor Pressure Data for Lambda-Cyhalothrin Wells and Wollerton (1989) is given in Figure 7 along with p/µPa p/µPa our data. t/°C na (this work)a (Wollerton and Husband) The di(2-ethylhexyl)phthalate is an OECD reference 40 3 19 7.8 material. Reproducibility of the method was determined 50 2 47 40 using this compound. The vapor pressure was determined 60 2 170 190 on three separate occasions using an orifice plate with 70 2 650 820 80 2 2000 3200 either a 0.381 mm orifice diameter or a 0.229 mm diameter orifice. We also tested a variable height Knudsen cell. For a n ) number of determinations. b 0.381 mm diameter orifice this set of data a distance of 4 mm from the top of the with 0.203 mm thickness. Knudsen cell to the QCM was used. All the vapor pressure data are presented in Table 5. The Clausius-Clapeyron plot given in Figure 8 was prepared using the OECD Vapour Pressure Curve Guideline 104 data and our vapor pressure data. The hexaconazole (PP523) vapor pressure data was collected using three different orifices areas. Data were collected using the 0.381 mm diameter orifice for vapor pressure data from 45 °C to 55 °C. The 0.229 mm diameter orifice plate was used for vapor pressure data from 50 °C to 75 °C, and a 0.152 mm diameter orifice plate was used to obtain the vapor pressure data from 75 ° to 85 °C. The vapor pressure data are presented in Table 6. The Clau- sius-Clapeyron plot in Figure 9 of our vapor pressure data Figure 6. Plot of vapor pressure data for lambda-cyhalothrin: was prepared with reported vapor pressure data of Wol- 9, this work; s, Wollerton and Husband. lerton and Husband. For each compound the logarithm of the average vapor The decachlorobiphenyl vapor pressure data were col- pressure at each temperature was regressed by linear least lected using an orifice plate with a 0.381 mm orifice squares as a function of the reciprocal temperature. Table diameter. The vapor pressure data are presented in Table 7 lists the regression coefficients A and B, the correlation 2. The Clausius-Clapeyron plot in Figure 5 of our data coefficient, and the molecular weight of each test substance. was prepared along with vapor pressure data reported by Burkhard et al. (1984). Discussion The lambda-cyhalothrin (PP321) vapor pressure data The advantage of the Knudsen effusion/QCM method is were collected using an orifice plate with a 0.381 mm orifice that the QCM is unaffected by vibrational noise and has a diameter. The vapor pressure data are presented in Table sensitivity of 0.1 ng. The increased sensitivity of the QCM 3. The study used for comparison was done by Wollerton over a conventional microbalance results in reduced ex- and Husband. The Clausius-Clayperon plot of their vapor perimental time for each data set being between 5 and 20 pressure data is given in Figure 6, along with our data. min. The cis-permethrin vapor pressure data were collected With the direct sample heating , our Knudsen cell design using an orifice plate with a 0.381 mm orifice diameter. has greatly improved temperature control. One of the The vapor pressure data are presented in Table 4. The problems that has plagued the Knudsen effusion method Clausius-Clapeyron plot of the vapor pressure data of has been the ambiguity in the temperature measurement
- 4. 1230 Journal of Chemical and Engineering Data, Vol. 42, No. 6, 1997 Table 5. Vapor Pressure Data for Di-(2-ethylhexyl)phthalate (this work)b (this work)b (this work)c (this work)c,d t/°C na p/mPa na p/mPa na p/mPa na p/mPa p/mPae 40 3 0.15 0.12 50 2 0.44 2 0.31 2 0.21 3 0.49 0.48 55 2 0.98 2 0.65 0.93 60 2 2.0 2 1.3 2 0.97 3 1.5 1.8 65 2 3.8 2 2.3 2 4.1 3.3 70 2 6.3 2 4.2 2 6.8 2 4.6 5.9 75 2 9.2 2 9.2 11 80 2 12 2 10 4 16 19 a n ) number of determinations. b 0.381 mm diameter orifice with 0.203 mm thickness. c 0.229 mm diameter orifice with 0.127 mm thickness. d Data using variable height Knudsen cell (see text). e OECD Vapour Pressure Curve Guideline 104. Figure 9. Plot of vapor pressure data for hexaconazole: [, this work using 0.0152 mm diameter orifice; 9, this work using 0.0229 mm diameter orifice; b, this work using 0.0381 mm diameter orifice; s, Wollerton and Husband. Figure 8. Plot of vapor pressure data for di(2-ethylhexylphtha- Table 7. Regression Parameters for log10(p/Pa) ) A - late): [, this work using 0.0381 mm diameter orifice; 9, this work B/(T/K) using 0.0381 mm diameter orifice repeat data; *, this work using molecular 0.0229 mm diameter orifice repeat data; b, this work using 0.0229 compound weight A B r2 mm diameter orifice using variable height Knudsen cell set at 4 mm; s, OECD Vapour Pressure Curve Guideline 104 data. atrazine 215.7 16.08 6040 0.999 decachlorobiphenyl 498.7 9.91 4886 0.993 Table 6. Vapor Pressure Data for Hexaconazole lambda-cyhalothrin 449.9 13.47 5723 0.996 cis-permethrin 391.3 19.70 7677 0.999 orifice p/mPa p/mPa (Wollerton di-(2-ethylhexyl)phthalate 390.6 14.90 5911 0.988 t/°C diameter (mm) n (this work) and Husband) hexaconazole 314.2 22.60 8364 0.992 45 0.381 2 0.16 0.73 50 0.381 3 0.75 1.4 0.0735 mm. Lindane, which exceeded our effusion rate 50 0.229 2 3.0 1.4 upper limit, was also accompanied by uneven sample 55 0.381 2 1.3 2.7 distribution on the quartz crystal. The other compounds 55 0.229 3 1.7 2.7 studied had effusion rates and deposition characteristics 60 0.229 2 3.6 5.2 that were acceptable. 65 0.229 3 8.0 9.5 Lambda-cyhalothrin is a solid at room temperature and 70 0.229 3 15 17 75 0.229 3 28 31 a liquid at 55 °C. Data were collected from 40 °C to 80 °C. 75 0.152 3 50 31 It is interesting to note that no abrupt vapor pressure 80 0.152 4 87 54 change was observed above the phase transition. 85 0.152 4 140 93 The hexaconazole vapor pressure for the different orifice a areas used were consistent with the literature gas satura- n ) number of determinations. tion data over its reported temperature range. and controlling the sample temperature. The reason is Quality Criteria. The quality criteria for repeatability that the conventional Knudsen cell temperature cannot be and reproducibility of the Knudsen effusion method has easily measured since it is an integral part of the balance. been established by the OECD for vapor pressure studies. In our design, the temperature of the Knudsen cell is They estimated the repeatability of vapor pressure values directly controlled with a recirculating bath. The temper- to be 5-20%. The repeatability is the variation in the ature of the recirculating bath and our Knudsen cell vapor pressure obtained when the same procedure is used temperature were found to be within 0.1 °C over the several times while measuring the same sample at a given temperature range of 40-90 °C. temperature. The repeatability for the vapor pressure The data presented in Table 5 and Figure 8 for di-(2- measurements at each temperature, for the compounds ethylhexyl)phthalate indicate that the vapor pressure data studied, was within the specified guidelines. at 80 °C with 0.381 mm diameter orifice start to deviate The di-(2-ethylhexyl)phthalate was used to determine from the reported data. This was because the rate of the methods reproducibility. Reproducibility is the average effusion was more than 400 ng/min, and the cooling of the vapor pressure at a given temperature when capacity of the QCM had been exceeded. Therefore, for measuring the same sample at different times using the accurate results the mass rate of effusion should be same procedure. The estimated reproducibility by OECD between 2 and 350 ng/min. for the Knudsen effusion method is up to 50%. The We were unable to collect reliable vapor pressure data reproducibility of the OECD vapor pressure data and our for lindane, even using our smallest orifice diameter of data for di-(2-ethylhexyl)phthalate could be compared,
- 5. Journal of Chemical and Engineering Data, Vol. 42, No. 6, 1997 1231 since both were obtained using the Knudsen effusion Literature Cited method. The average reproducibility for di-(2-ethylhexyl)- Burkhard, L. P.; Armstrong, D. E.; Andren A. W. Vapor Pressures for phthalate was found to be 23.1%, which is within the Biphenyl, 4-Chlorobiphenyl, 2,2′,3,3′,5,5′6,6′-Octachlorobiphenyl, OECD specified guidelines. and Decachlorobiphenyl. J. Chem. Eng. Data 1984, 29, 248-250. Grayson, B. T.; Fosbraey, L. A. Determination of Vapour Pressures of Pesticides. Pestic. Sci. 1982, 13, 269-278. Conclusions Knudsen, M. The Law of the Molecular Flow and Viscosity of Gases Moving through Tubes Ann. Phys. 1909, 28, 75-130. We have demonstrated the validity of the Knudsen Knudsen, M. Effusion and the Molecular Flow of Gases through effusion/QCM method. In comparison to reported vapor Openings Ann. Phys. 1909, 28, 999-1016. pressure data, there is good agreement with our data. Knudsen, M. Experimental Determination of Vapor Pressure of The method is quick and only requires several days of Mercury at 0° and Higher Temperatures Ann. Phys. 1909, 29, 179- 193. work to complete a vapor pressure curve. The computer- OECD Guidelines for Testing of Chemicals, Organization for Economic ized data collection reduces time in performing data Cooperation and Development Publication; Vapour Pressure Curve analysis. The Knudsen cell design of the Knudsen effusion/ Guideline 104; ISBN 92-64-14018-2, 1993. Product Properties Test Guidelines OPPTS 830.7950 Vapor Pressure, QCM method allows for accurate temperature control of U.S. EPA Publication 712 C 96 043; U.S. Government Printing the test substance. Office: Washington, DC, August 1996. The Knudsen effusion/QCM method can be performed Sauerbrey, G. Z. Phys. 1959, 155, 206-222. Wells, D.; Wollerton, C. Permethrin: Vapour Pressure; Series TMJ2648B; with extremely small amounts of material, on the order of Zeneca Report Series TMJ2648B Bracknell-Berkshire, U.K., 1989. milligrams and in some cases even less. The low cost of Wollerton, C.; Husband, R. Water Solubility, Vapour Pressure, Oc- the QCM compared to a conventional microbalance makes tanol-Water Partition Coefficient and Henry’s Law Constant; Zeneca Report Series RJ0699B PP321; Bracknell: Berkshire, U.K. 1988. this method attractive. Wollerton, C.; Husband, R. Physico-Chemical Data File Addendum 1: The repeatability and reproducibility of the method met Water Solubility, Vapour Pressure, Octanol-Water Partition Coef- the criteria established by the OECD. ficient and Henry’s Law Constant Zeneca Report Series RJ0406B PP523; Bracknell, Berkshire, UK, 1991. Acknowledgment Received for review May 13, 1997. Accepted August 4, 1997.X I would like to thank Dave Ijams of MMI Inc. of JE970111M Richmond, CA for his help in constructing the Knudsen effusion cell and Jonathon Earhart and Horst Redmer for their assistance with the manuscript preparation. X Abstract published in Advance ACS Abstracts, September 15, 1997.