Call Girls In Mahipalpur O9654467111 Escorts Service
Dehydration of sodium carbonate decahydrate
1. Dehydration of Sodium Carbonate Decahydrate
to Monohydrate in a Fluidized Bed
M. Hartman, V. Vesely, K. Svoboda, and O. Trnka´
Institute of Chemical Process Fundamentals, Academy of Sciences of the Czech Republic, 165 02 Prague
6-Suchdol, Czech Republic
Z. Beran
LEAR Corp., 636 00 Brno, Czech Republic
Kinetics of the thermal dehydration of sodium carbonate decahydrate to monohy-
drate is in®estigated at temperatures between 15 and 30ЊC in a batch, fluidized-bed,
140-mm-ID reactor. Effects of particle size, mass of bed, and gas ®elocity on the dehy-
dration rate are also explored. A simple correlation based on the collected experimental
data is de®eloped. The proposed rate law formula makes it possible to estimate the
dehydration rate that would be needed to design the performance of a fluidized-bed
drying unit. The produced monohydrate is subjected to textural analysis, and pore ®ol-
ume and surface-area data are presented.
Introduction
It has been well established that the removal of sulfur
dioxide from flue or waste gas by reaction with ‘‘active soda’’
Žat moderate temperatures has attractive features Hartman
et al., 1979; Kimura and Smith, 1987; Keneer and Khang,
.1993; Kopac et al., 1996 . By the term ‘‘active soda’’ we usu-
ally mean a porous sodium carbonate produced by the ther-
Žmal decomposition of sodium hydrogen carbonate bi-
. Ž .carbonate under appropriate conditions Bares et al., 1970 .ˇ
In comparison with calcium oxide, such a solid sorbent reacts
with sulfur dioxide almost completely and much more rapidly
Ž .even at lower temperatures 120᎐180ЊC . Our experience as
Žwell as that of others Svoboda et al., 1990; Mocek et al.,
.1996 indicates that active soda also exhibits a considerable
reactivity toward weakly acid NO and affinity for difficultx
penetrative odors.
Aside from the porosity, the surface area of the solid is
also substantially increased as a gaseous product evolves in
the course of the thermal decomposition. There are causal
links between the low temperature of decomposition of the
Ž . Žparent materials precursors and large surface area and
. Žporosity and high reactivity of their calcines Hartman et al.,
1978; Hartman and Svoboda, 1985; Borgwardt, 1989; Mai and
Correspondence concerning this article should be addressed to M. Hartman.
.Edgar, 1989; Irabien et al., 1990; Hartman et al., 1994a,b .
The decomposition reaction is virtually always accompa-
nied with the process of undesirable sintering of the nascent
solid product. As micrograin sintering occurs, the surface area
is reduced and a significant portion of pore volume can be
Žlost Borgwardt and Rochelle, 1990; Milne et al., 1990; Hart-
.man et al., 1994a,b, 1997 . Research indicates that the cal-
cined product is the most reactive when a certain small frac-
tion of parent material remains undecomposed in the reac-
tion product.
Ž .Hu et al. 1986 found that the NaHCO particles com-3
mence decomposing in a helium stream at approximately
92ЊC. The rapid rate, that remained high up to high conver-
sions to Na CO , was attained at 200ЊC. Corresponding tex-2 3
tural data indicated that the surface area and pore volume
were greater for the particles decomposed at lower tempera-
tures.
The thermal dehydration of sodium carbonate decahydrate
Ž . Ž .SCD takes place in two stages Waterfield et al., 1968 as
follows:
Na CO ؒ10H O s sNa CO ؒH O s q9H O gŽ . Ž . Ž .2 3 2 2 3 2 2
⌬ H o
sq52.669 kJrmol H O 1Ž .298 2
October 2001 Vol. 47, No. 10AIChE Journal 2333
2. and
Na CO ؒH O s sNa CO s qH O gŽ . Ž . Ž .2 3 2 2 3 2
⌬ H o
sq58.770 kJrmol H O. 2Ž .298 2
A transitory occurrence of the metastable heptahydrate
cannot be ruled out under specific conditions. As can be seen,
Ž .the decomposition reactions Eqs. 1 and 2 are considerably
endothermic with the heats of reaction cited earlier. These
are appreciably greater than the heat of vaporization of liq-
Žuid water at 298 K, which amounts to 43.993 kJrmol Perry
.and Chilton, 1973 .
The dissociation pressure of sodium carbonate decahy-
drate can be predicted from an equation developed by Baxter
Ž .and Cooper 1924 :
8,368.79U
ln P s25.1719y . 3Ž .H O2
T q46.45
Predictions of this equation show that the dissociation
pressures of SCD are at 20᎐25ЊC, approximately 30% lower
than the equilibrium water-vapor pressures on liquid water
Ž .estimated with the aid of Eq. 4 Hartman and Trnka, 1993 :
5,041.68U
ln P s18.1304y . 4Ž .H O2
T
In the course of the dehydration, the solid phase under-
goes deep crystallographic transformation. The original mon-
oclinic lattice of sodium carbonate decahydrate is trans-
formed into the orthorhombic unit of sodium carbonate
Ž .monohydrate SCM . Although both the precursor and the
product possess only one known crystal structure, the de-
tailed mechanism of the the transformation from the stand-
point of crystallography is not entirely clear.
As Eq. 3 predicts, SCD already exhibits appreciable disso-
ciation pressures at room temperatures. Note that SCD al-
Ž .ready can melt dissolve in its crystal water at 32.5᎐34.5ЊC
Ž .Weast and Astle, 1981 . It is known that the porous and re-
active product is only formed provided no liquid phase ap-
pears in the course of reaction 1.
The fluidized bed with its high heat-transfer rate offers a
favorable milieu for carrying out such gas᎐solid reactions
Ž .Yates, 1983; Yates and Simons, 1994 . The solid particles it
contains are in continuous motion and are normally very well
mixed. Occasional ‘‘hotrcold spots’’are rapidly dissipated and
the bed operates in an essentially isothermal and well-con-
trolled mode.
Here we report the results of an investigation of dehydrat-
ing the sodium carbonate decahydrate to the monohydrate in
a fluidized bed operated in batch manner. In addition to the
kinetic experiments, pore-volume and surface-area data were
obtained for the solid product in order to evaluate changes in
pore texture as a result of reaction.
Experimental Studies
Apparatus
The principal component of the experimental setup was a
Ž 2.cylindrical glass column of 140 mm ID Fs0.01539 m and
height 0.600 m. The column was equipped with a sandwich-
ing perforated-plate distributor of 5% free area and an ori-
fice diameter of 1.0 mm. Every care was taken to ensure uni-
Ž .form gas air distribution within the vessel. Air passed
through an oil filter, drier, rotameter, and electric heater be-
fore it entered the bottom. Air leaving the column passed
through a cyclone and fabric filter. Further details on the
Žapparatus can be found in a recent article of ours Trnka et
.al., 2000 .
The inlet temperature of fluidization air was measured and
controlled by means of a Ni᎐CrNi thermocouple connected
to a PID-type temperature controller. Temperature within the
fluidized bed was measured by a thermoelement that was lo-
cated at about 7 cm above the distributor plate. Humidity of
the entering and outgoing air streams was also monitored.
Ž .The reactor drier, dehydrator was operated in a batchwise
manner, and solids samples could readily be withdrawn from
the bed.
Material, particles
The experiments were performed with the SCD obtained
as Fluka Analyzed p.a. Grade. The producer’s specifications
Ž .Fluka Chemie A.G. showed purity above 99%. Results of
an X-ray power-diffraction analysis confirmed the presence
of a single solid component in the sample. The mass fraction
of water, z, determined as weight loss at 150ЊC indicated that
Ž .the number of mols of water per mol of Na CO ASC , n,2 3
M zNa CO2 3
ns ؒ , 5Ž .
M 1y zH O2
was slightly less than 10. As stoichiometry indicates, ns10
when zs0.6296, and ns1 if zs0.1453.
Using a microscope heated at a rate of 2ЊCrmin, tempera-
ture was determined when first signs of crystal melting be-
came noticeable. The measured results are plotted in Figure
1. As can be seen, sodium carbonate hydrates are prone to
Figure 1. Melting points of sodium carbonate hydrates
as a function of water content in solids.
The quantity n is given by Eq. 5.
October 2001 Vol. 47, No. 10 AIChE Journal2334
4. Figure 4. Path of conversion of sodium carbonate de-
hydrate to monohydrate.
Bed temperature, 22ЊC; initial mass of bed, 1,500 g; z so
0.56; d s 0.8 mm; H s 0.13 m; `, experimental datap fix
points.
Conversions of the SCD to the monohydrate were calcu-
lated from the decrease in weight fraction of water in solids,
Ž .z , at any moment of time, and the equation
M1 z y z Ž .Na CO o2 3
Xs ؒ ؒ , 7Ž .
w xn y1 M 1y z 1y z Ž .Ž .o H O o2
Ž .in which z G0.1453.
The symbols n and z are the number of mols of watero o
per one mol of Na CO and mass fraction of water in the2 3
Ž . Ž .original initial sample at s0 , respectively. Complete
Ž .conversion of Na CO ؒ10 H O n s10, Xs0 to Na CO ؒ2 3 2 o 2 3
Ž .H O ns1, Xs1 corresponds to a theoretical decrease in2
water content of the solid, z, from 0.6296 to 0.1453.
Figure 4 shows the path of dehydration in the course of
time at 20ЊC. It may appear somewhat unexpected that the
rate of dehydration, dXrdt, is constant until complete conver-
sion to the monohydrate is attained. This phenomenon sug-
gests that the crystal water is bonded rather weakly to the
carbonate. There is an apparent resemblance of the SCD de-
hydration to a physical process such as the constant-rate dry-
ing regime of the solids.
With the aid of Eq. 7, the overall rate, r, in Eq. 6 at which
water vapor is released from the bed can be expressed as
dX
rsn ؒ n y1 ؒ , 8Ž .Ž .ASC o
d
where n is the amount of Na CO present in the bed,ASC 2 3
and X is the fractional conversion of the decomposing SCD
to the monohydrate given by Eq. 7.
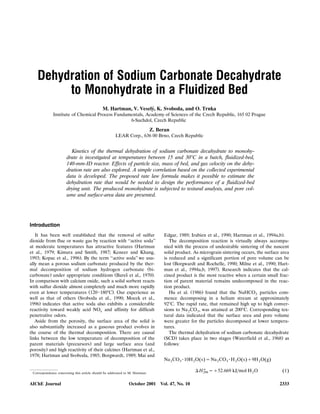
Figure 5. Rate of dehydration of SCD in the fluidized
bed at different temperatures.
Static-bed height, H s 0.18 m; particle size, d s 0.8 mm;fix p
superficial gas velocity, Us 0.70 mrs; mean gas residence
time, s 0.13 s. Solid line shows the predictions of Eq. 10.g
In this work, the rate of dehydration was explored in terms
of the bed temperature, air flow rate, and particle size of the
decomposing SCD.
Influence of bed temperature
Using 0.8-mm particles, dehydration behavior was explored
at bed temperatures between 15.3 and 29.6ЊC. Corresponding
temperatures of the preheated inlet air varied from 25ЊC to
65ЊC and can be estimated with the aid of Figure 3. This
figure and the results plotted in Figure 1 imply that tempera-
ture of the inlet air should be lower than approximately 70ЊC
in order not to bring about any melting action of the solid
phase. For ordinary fluidizing conditions, it is commonly ac-
Ž .cepted that is, Yates and Simons, 1994 that gas and solids
are at the same temperature everywhere within the bed.
Experimental results, as seen in Figure 5, show that the
temperature exerted a strong favorable influence on the mea-
sured rates of dehydration. When the bed temperature was
increased from about 15ЊC to approximately 30ЊC, the reac-
tion rate went up nearly five times. This increase can be at-
tributed to the increase in the surface temperature of the
particle, resulting in higher dissociation pressure.
The driving force for the conversion of the sodium carbon-
ate decahydrate into the monohydrate can be taken as the
difference between the dissociation pressure of SCD and the
Ž .partial vapor pressure of water in the dehydrating drying
air. However, a question can arise of how to represent with
confidence the mean water-vapor concentration in the gas
encountered by the reacting solids within the bed. Research
indicates that it is feasible to assume that the gas passes
Žthrough the fluidized bed in plug flow Davis and Levenspiel,
.1983; Hartman et al., 1988 Thus, the mean concentration of
October 2001 Vol. 47, No. 10 AIChE Journal2336
6. be noted that the gas leaving the bed was less humid, that is,
a greater driving force was achieved when a higher air flow
rate was applied.
The effect of particle size is also shown in Figure 8. Again,
as is to be expected from simple physical reasoning, the
smaller particles were dehydrated more rapidly than the big-
ger ones at the same gas flow rate. Moreover, the gas exiting
the bed of small particles was very close to the saturation
point. It is likely that an increase in particle size decreases
the rate of dehydration due to reduction in surface area per
unit mass of solids.
In general, the preceding results indicate that the most fa-
vorable conditions for the thermal dehydration of SCD using
a fluidized bed require that the bed of small particles is as
hot as safe and still avoids undesirable solid melting. Further-
more, the bed should be as deep as practical and should be
operated at higher air flow rates that are compatible with the
particle size. However, it should be born in mind that higher
gas velocities lead to a certain amount of bypassing, particu-
larly in deep beds, and this reduces the effectiveness of con-
tacting between the phases in the bed.
Determination of rate expression
As follows from the preceding paragraphs, the rate of de-
hydration is influenced by a number of the system variables.
Keeping the given span the temperatures and relatively
straightforward reaction chemistry in mind, it appears viable
to think of an adequate correlation of the amassed experi-
mental data. This is also facilitated by the fortuitous fact that
at the given conditions, the rate of dehydration does not
change in the course of reaction.
Having examined several, mostly more involved procedures
and relationships, the following simple approach was adopted.
It was assumed that the rate of dehydration is governed by
U
two process variables: the driving force, C yC, and excess
gas velocity, UyU , which can be taken as the approximatem f
bubble flow through the bed. The preceding experimental
data were fitted by minimizing the standard deviation be-
tween the experimental values and the values estimated from
the proposed relationship:
dXrd 0.920 y4
s0.0321ؒ UyU q8.60=10 . 10Ž .Ž .m fU
C yC
The values of the empirical parameters were computed by
Ž .the simplex procedure flexible polyhedron search . Agree-
ment between experiment and the correlation embodied in
Eq. 10 appears reasonable, as seen in Figures 5 and 8.
Textural properties of the dehydrated solids
The dehydration of SCD particles at temperatures below
the melting point generally takes place without significant
change in particle dimensions. This fact, together with the
Ždifference in molar volume between Na CO ؒ10H O 198.712 3 2
3 . Ž 3 .cm rmol and Na CO ؒH O 55.11 cm rmol indicates that2 3 2
the SCD particle is made much more porous by dehydrating
it. Thus, elementary arithmetic leads to the theoretical poros-
Ž 3 .ity of Na CO ؒH O particles as large as 0.7227 1.158 cm rg2 3 2
when no shrinkage occurs.
Table 1. Textural Features of Different Sodium Carbonates
Prepared by DehydrationrrrrrCalcination
Na CO ؒH O2 3 2
Prepared from Na CO Prepared2 3
Na CO ؒ10 H O from NaHCO by2 3 2 3
by Dehydration Calcination
Physical Property at 25ЊC at 125ЊC
3
Pore Vol. V , cm rg 0.9718 0.3344p
Porosity, e 0.6862 0.4583
2
Surface Area, m rg 11.24 4.09
3 4
Median Pore Radius, nm 1.23=10 2.22=10
Ž .Microscope examination revealed 50= magnification that
the Na CO ؒ10H O particles were composed of a dense as-2 3 2
sembly of rather flakelike grains. The original smooth surface
of the grains was idented by the dehydration process. After
decomposition to Na CO ؒH O, the SCD grains became2 3 2
smaller, somewhat more spherical in shape, and with sub-
stantially more intergrain space.
Ž .In several samples Na CO ؒH O , prepared by the ther-2 3 2
mal decomposition of Na CO ؒ10H O in the fluidized-bed2 3 2
Ž .reactor, physical properties such as pore volume porosity ,
BET surface area, and pore-size distribution were deter-
Ž .mined Digisorb Analyzer, Micromeritics Auto-Pore .
For the sake of comparison, similar measurements were
conducted with Na CO particles prepared from sodium hy-2 3
Ž .drogen carbonate NaHCO by calcination at 125ЊC. The3
measured results are presented in Table 1 and Figures 9 and
Ž .10. As can be seen, the measured pore volume es0.6862
Ž .was somewhat smaller than its theoretical value es0.7227 .
Nevertheless, it was considerably larger than the porosity
Ž .es0.4583 of anhydrous sodium carbonate prepared from
NaHCO particles.3
Also, the sodium carbonate monohydrate exhibits higher
surface area than does Na CO . Since there is a general cor-2 3
Figure 9. Pore-volume distribution of the Na CO ؒH O2 3 2
particles prepared from Na CO ؒ10H O by2 3 2
dehydration at 25ЊC.
October 2001 Vol. 47, No. 10 AIChE Journal2338
7. Figure 10. Pore-volume distribution of the Na CO par-2 3
ticles prepared from NaHCO by calcination3
at 125ЊC.
relation of reactivity with the textural properties, the higher
surface area and greater porosity of the Na CO ؒH O parti-2 3 2
cles are expected to lead to increased reaction activity with
Ž .acidic reactants Hartman et al., 1978 . The distribution
curves displayed in Figures 9 and 10 indicate that the pore
structure of the Na CO ؒH O and Na CO particles differ2 3 2 2 3
greatly.
Using a small, fixed-bed reactor, experimental measure-
ments were conducted to compare the SO reactivities of2
Na CO ؒH O produced by drying the decahydrate, and the2 3 2
Na CO produced by hydrogen carbonate decomposition.2 3
The approximately 15᎐20% longer breakthrough times for the
monohydrate beds demonstrated the very high reactivity of
the monohydrate prepared from Na CO ؒ10H O.2 3 2
The regeneration of the SO -loaded sorbent has not been2
fully resolved yet. It is expected that this spent sorbent can
be employed in the glass industry. With respect to the high
monohydrate solubility rate, it can also be used to advantage
as an important component in laundry products.
Conclusions
In order to prevent the decomposing SCD particles from
melting and the subsequent agglomeration, the bed tempera-
ture has to be maintained below the 30ЊC level. The results
showed that under such conditions, the dehydration rate was
not very rapid. Kinetics was zero order in the Na CO ؒ2 3
10H O mass, up to practically complete conversion to the2
monohydrate. The data also showed that the rate decreased
when the bed temperature andror excess gas velocity, Uy
U , were reduced andror, if the particle size was increased.m f
In general, both the experimental findings and the theory
strongly suggest that the carrying capacity of the gas is an
operation parameter of considerable importance.
Textural analyses proved the dramatic increase in porosity
upon converting the Na CO ؒ10H O particles to the mono-2 3 2
hydrate. The reduction in the solid-phase volume due to the
reaction leads to a monohydrate porosity as large as 0.686.
The surface area of the monohydrate amounts to 11 m2
rg.
Acknowledgment
This research was funded by Grant 203r98r0101 from the Grant
Agency CR and Grant A 4072711 from the Grant Agency of the AS
ˇ ˇCR. The authors thank Mrs. O. Solcova and Mrs. H. Snajdaufova for´ ´
the textural measurements.
Notation
Ž .ASCsanhydrous sodium carbonate Na CO2 3
C sconcentration of water vapor in the inlet air, mol fractionin
C sconcentration of water vapor in the gas leaving the reac-out
tor, mol fraction
Ž . Ž .C sspecific heat of air s29.19 , Jr molؒKpa
CU
sequilibrium concentration of water vapor in the gas phaseH O2
given by Eq. 4 for ambient pressure, mol fraction
CU
sequilibrium concentration of water vapor in the gas phaseSCD
given by Eq. 3 for ambient pressure, mol fraction
Csmean concentration of water vapor in the gas phase
within the bed given by Eq. 9, mol fraction
d smean sieve size of solids, m, mmp
Ž .esporosity of particle s1y rp s
Ž . 2
Fscross-sectional area of empty vessel s0.015394 , m
H sstatic bed height, mfix
⌬ Ho
sstandard heat of reaction, Jrmol H O2
lnsbase e or natural logarithm
ŽM smolar mass of species M s18.015; M si H O Na CO2 2 3
.105.989; M s286.141 , grmolSCD
nsnumber of mols of water per mol of Na CO in the solid2 3
phase
n snumber of mols of water per mol of Na CO in originalo 2 3
sample
n samount of Na CO in bed, molASC 2 3
PU
sequilibrium pressure of water vapor, kPaH O2
rsoverall rate of release of water from bed given by Eq. 8,
molrs
r spore radius, nmp
Re sReynolds number at the point of minimum fluidizationm f
Ž .sU d rm f p f f
Ž .SCDssodium carbonate decahydrate Na CO ؒ10 H O2 3 2
Ž .SCMssodium carbonate monohydrate Na CO ؒ10 H O2 3 2
t stemperature of bed, ЊCb
t stemperature of preheated inlet air, ЊCin
t stemperature of melting point, ЊCm p
T sthermodynamic temperature of bed, Kb
T sthermodynamic temperature of preheated inlet air, Kin
ŽUssuperficial gas velocity measured on an empty vessel ba-
.sis , mrs
U sminimum fluidization velocity, mrsm f
UyU sexcess gas velocity, mrsm f
Ž .Vsflow rate of air s FU , molrsm
Ž . 3 3
V spore volume of particle s1r y1r , cm rg, m rkgp p s
Xsfractional conversion of sodium carbonate decahydrate to
monohydrate, mol Na CO ؒH Ormol Na CO given by2 3 2 2 3
Eq. 7
zsmass fraction of water in solid phase
z sinitial mass fraction of water in solid phaseo
Ž .l sliquid phase
Ž .s ssolid phase
Greek letters
⑀ sbed voidage at minimum fluidizationm f
Ž . sfluid viscosity, kgr mؒsf
sfluid density, kgrm3
f
Ž . sair density under ambient pressure s12,187 ؒrT ,m
molrm3
Ž . 3
sapparent mercury density of solid reactant, grcm ,p
kgrm3
October 2001 Vol. 47, No. 10AIChE Journal 2339
8. Ž . 3
strue skeletal, helium density of solid reactant, grcm ,s
kgrm3
sexposure time, s
Ž . smean residence time of gas in bed s H ؒ⑀ rU , sg fix m f m f
Literature Cited
Bares, J., J. Marecek, M. Mocek, and E. Erdos, ‘‘Kinetics of theˇ ˇ ¨
Reaction Between the Solid Sodium Carbonate and the Gaseous
Sulfur Dioxide. III,’’ Collect. Czech. Chem. Commun., 35, 1628
Ž .1970 .
Baxter, G. P., and W. C. Copper, Jr., ‘‘The Aqueous Pressure of
Hydrated Crystals. II. Oxalic Acid, Sodium Sulfate, Sodium Ac-
etate, Sodium Carbonate, Disodium Phosphate, Barium Chloride,’’
Ž .J. Amer. Chem. Soc., 46, 923 1924 .
Borgwardt, R. H., ‘‘Sintering of Nascent Calcium Oxide,’’ Chem. Eng.
Ž .Sci., 44, 53 1989 .
Borgwardt, R. H., and G. T. Rochelle, ‘‘Sintering and Sulfation of
Calcium Silicate-Calcium Aluminate,’’ Ind. Eng. Chem. Res., 29,
Ž .2118 1990 .
Davis, G. F., and O. Levenspiel, ‘‘Simple Experimental Method for
Finding the Kinetics of Gas-Solid Reactions,’’ Ind. Eng. Chem.
Ž .Fundam., 22, 504 1983 .
Hartman, M., J. Pata, and R. W. Coughlin, ‘‘Influence of Porosity of
Calcium Carbonates on Their Reactivity with Sulfur Dioxide,’’ Ind.
Ž .Eng. Chem. Process Des. De®., 17, 411 1978 .
Hartman, M., J. Hejna, and Z. Beran, ‘‘Application of the Reaction
Kinetics and Dispersion Model to Gas-Solid Reactors for Removal
Ž .of Sulfur Dioxide from Flue Gas,’’ Chem. Eng. Sci., 34, 475 1979 .
Hartman, M., and K. Svoboda, ‘‘Physical Properties of Magnesite
Calcines and Their Reactivity with Sulfur Dioxide,’’ Ind. Eng. Chem.
Ž .Process Des. De®., 24, 613 1985 .
Hartman, M., K. Svoboda, O. Trnka, and V. Vesely, ’’Reaction of´
Sulfur Dioxide with Magnesia in a Fluidized Bed,’’Chem. Eng. Sci.,
Ž . Ž .Special Issue on ISCRE-10 , 43, 2045 1988 .
Hartman, M., V. Vesely, and K. Svoboda, ‘‘On the Bed Expansion in´
Aggregative Fluidization,’’ Collect. Czech. Chem. Commun., 56, 882
Ž .1991 .
Hartman, M., and R. W. Coughlin, ‘‘On the Incipient Fluidized State
Ž .of Solid Particles,’’ Collect. Czech. Chem. Commun., 58, 1213 1993 .
Hartman, M., and O. Trnka, ‘‘Reactions Between Calcium Oxide and
Flue Gas Containing Sulfur Dioxide at Lower Temperatures,’’
Ž .AIChE J., 39, 615 1993 .
Hartman, M., O. Trnka, and V. Vesely, ‘‘Thermal Dehydration of´
Magnesium Hydroxide and Sintering of Nascent Magnesium Ox-
Ž .ide,’’ AIChE J., 40, 536 1994a .
Hartman, M., O. Trnka, K. Svoboda, and J. Kocurek, ‘‘Decomposi-
tion Kinetics of Alkaline-Earth Hydroxides and Surface Area of
Ž .Their Calcines,’’ Chem. Eng. Sci., 49, 1209 1994b .
Hartman, M., O. Trnka, and Z. Beran, ‘‘Kinetics of the Thermal
Decomposition of Hydrated Dolomitic Lime and Sintering of
Ž .Nascent Calcine,’’ Chem. Eng. Commun., 162, 199 1997 .
Hu, W., J. M. Smith, T. Dogu, and G. Dogu, ‘‘Kinetics of Sodium
Ž .Bicarbonate Decomposition,’’ AIChE J., 32, 1483 1986 .
Irabien, A., J. P. Viguri, F. Cortabitarte, and I. Ortiz, ‘‘Thermal De-
hydration of Calcium Hydroxide,’’ Ind Eng. Chem. Res., 29, 1599
Ž .1990 .
Keneer, T. C., and S. J. Khang, ‘‘Kinetics of Sodium Bircarbonate-
Ž .Sulfur Dioxide Reaction,’’ Chem. Eng. Sci., 48, 2859 1993 .
Kimura, S., and J. M. Smith, ‘‘Kinetics of the Sodium
Ž .Carbonate᎐Sulfur Dioxide Reaction,’’ AIChE J., 33, 1522 1987 .
Kopac, T., G. Dogu, and T. Dogu, ‘‘Single Pellet Reactor for the
Dynamic Analysis of Gas-Solid Reactions-Reaction of SO with2
Ž .Activated Soda,’’ Chem. Eng. Sci., 51, 2201 1996 .
Mai, M. C., and T. F. Edgar, ‘‘Surface Area Evolution of Calcium
Hydroxide During Calcination and Sintering,’’ AIChE J., 35, 30
Ž .1989 .
Milne, C. R., G. D. Silcox, D. W. Pershing, and D. A. Kirchgessner,
‘‘Calcination and Sintering Models for Application to High-Tem-
perature, Short-Time Sulfation of Calcium-Based Sorbents,’’ Ind.
Ž .Eng. Chem. Res., 29, 139 1990 .
Mocek, K., K. Stejskalova, P. Bach, E. Lippert, Z. Bastl, I. Spirovova,´ ´
and E. Erdos, ‘‘Comparison of the Reactivity of Different Sodium¨
Ž .Compounds and Ca OH Towards SO and Mixtures of SO and2 2 2
Ž .NO ,’’ Collect. Czech. Chem. Commun., 61, 825 1996 .x
Perry, H. R., and C. H. Chilton, ‘‘Chemical Engineer’s Handbook,
Ž .5th ed., McGraw-Hill, Tokyo 1973 .
Svoboda, K., V. Vesely, M. Hartman, and K. Jakubec, ‘‘Removal of´
ŽSO and NO from Gases with Sorbents Based on Na CO ’’ in2 x 2 3
. Ž . Ž .Czech , Atmos. Prot., 4 , 30 1990 .
Trnka, O., V. Vesely, M. Hartman, and Z. Beran, ‘‘Identification of´
the State of a Fluidized Bed by Pressure Fluctuation,’’ AIChE J.,
Ž .46, 509 2000 .
Waterfield, C. G., R. G. Linford, B. B. Goalby, T. R. Bates, C. A.
Elyard, and L. A. K. Staveley, ‘‘Thermodynamic Investigation of
Disorder in the Hydrates of Sodium Carbonate.’’ Trans. Faraday
Ž .Soc., 64, 868 1968 .
Weast, R. C., and M. J. Astle, Handbook of Chemistry and Physics,
Ž .62nd ed., CRC Press, Boca Raton, FL 1981 .
Yates, J. G., Fundamentals of Fluidized-Bed Chemical Processes, But-
Ž .terworths, London 1983 .
Yates, J. G., and S. J. R. Simons, ‘‘Experimental Methods in Flu-
Ž . Ž .idization Research,’’ Int. J. Multiphase Flow, 20 Suppl. , 297 1994 .
Manuscript recei®ed No®. 22, 2000, and re®ision recei®ed Apr. 26, 2001.
October 2001 Vol. 47, No. 10 AIChE Journal2340