1. Synthesis and Hydrogen Gas Sensing Performance of Pd-functionalized
Nanostructures
K. Y. Koka
, I. K. Nga
, N. U. Ubaidaha
, S. H. Iliasa
, L. Lombigita
, K W Leoa
, T. F. Chooa
and C. Z Che Abd Rahmana
a
Malaysian Nuclear Agency, Bangi, 43000 Kajang, Selangor Darul Ehsan, Malaysia.
In this work, palladium surface-functionalized single-walled
carbon nanotubes (SWNTs) hydrogen gas sensor was fabricated by
electrodeposition and its sensing properties were systematically
studied under various conditions. The diameter and density of the
Pd nanoparticles were optimized by tuning the deposition voltage
and time. Using a microfabricated chip consisting of a circular
array of 16 individually addressable Pd-functionalised nanosensors,
the gas sensing performance for each nanosensor was evaluated
sequentially via a customized multiplexer-coupled electronic
measurement system with Labview program control. The sensing
properties were optimized for high sensitivity and short response
time with respect to hydrogen detection. Sensor formed from non-
connected chains of Pd particles was found to exhibit excellent
sensing properties with resistance change exceeding 60% in 2000
ppm of hydrogen and lowest detection limit of 30 ppm hydrogen.
The response time increased from a few minutes to tens of minutes
with decreasing hydrogen concentrations.
Introduction
Nanostructures-based gas sensors have emerged as the new generation sensors due to
their enhanced gas sensing performance. Besides higher sensitivities and broader
dynamic range, the sensor elements can be integrated with microelectronics for real-time
monitoring of low concentration mobile source air toxics and other targeted gases.
Materials for the sensors span from metals, metal oxides, polymers and carbon
nanomaterials with configurations ranging from nanowires, nanotubes, nanorods to core-
shell and nanoporous structures. ZnO nanowires and nanorods for example, are good
candidates for the detection of environmentally detrimental NO2 gas while titania
nanotubes and Pd nanowires are good for hydrogen detection with high sensitivities (1-
3). CdS doped ZnO core-shell nanorods, on the other hand, are favorable for vapor
sensing with sensitivity changes as a function of core and shell thicknesses (4). Caliendo
et al used Pd nanoparticle/oranometallic polymer nanocomposite (Pd/Pd-DEBP) as
sensor materials for hydrogen and relative humidity detection (5). Tin oxide nanoclusters
doped with palladium have demonstrated enhanced sensitivity and fast response time for
hydrogen and ammonia detections (6). Good hydrogen detection has also been achieved
by Noh et al using vertically standing Si nanowires coated with Pd (7).
2. In hydrogen sensor, Palladium (Pd) is often used as the sensing element as it readily
absorbs hydrogen gas forming palladium hydride leading to changes in its electrical
resistance or work function. Nevertheless, Pd alone does not exhibit good sensitivity for
hydrogen detection. Enhanced sensing efficiencies are normally achieved using Pd-
incorporated semiconductor nanostructures such as carbon nanotubes, ZnO nanorods and
Si nanowires. In this paper, hydrogen sensors were fabricated from Pd-decorated single
walled carbon nanotubes (SWNTs). A silicon chip microfabricated with a circular array
of 16 individual addressable nanosensors was used as the integrated gas sensing platform.
Each nanosensor constituted of Pd-functionalized SWNTs prepared by electrochemical
deposition. Electrodeposition was used because it is capable of controlling the
composition, size and density of the Pd nanoparticles with precision. More importantly,
it is site-specific meaning that it enables the deposition to be directed to a specific site.
Assembly and alignment of SWNTs on the chip were performed using a.c.
dielectrophoretic technique. The results as revealed by scanning electron microscope
(SEM) examinations were correlated with hydrogen gas sensing performance for
optimization of sensor properties.
Experimental
SWNTs functionalized with –COOH group were uniformly dispersed in dimethyl
formamide (DMF) with a concentration of 0.04 mg/mL to form a suspension. For the
alignment of SWNTs, a silicon chip pre-patterned with a circular array of 16 pairs of gold
electrodes using standard lithographic technique was used. The gap distance between
each pair of electrodes is 3 µm and all the electrodes were connected to a Kiethley
arbitrary waveform generator 3390. 40 µL of SWNTs suspension was dispensed directly
onto the electrodes. A sinusoidal a.c. current was applied sequentially to each pair of the
electrodes via Labview program control. The density and orientation of the SWNTs
across the gaps of the electrodes were tuned by the voltage, frequency and time of the
applied field.
After alignment, deposition of Pd onto the aligned SWNTs was performed using a
mini 3-electrode electrochemical cell with Ag/AgCl and Pt wire as the reference and
counter electrodes respectively. The deposition conditions for Pd were first determined
by Linear Sweep Voltammetry (LSV) using an aqueous bath containing 0.047 M
Pd(NH3)2Cl2 and 0.1 M NH4Cl. The diameter and density of the Pd nanoparticles
deposited were optimized by tuning the deposition voltage and time.
Gas sensing measurements were performed with gas flowing across the sensor chip in
a sealed mini teflon chamber. Hydrogen was diluted at various proportions with dry air
and the flow rates were regulated by mass flow controllers at 200 SCCM. Gas sensing
data for each pair of electrodes were acquired sequentially via a customized Labview
program interfaced with a Keithley Source Measure Unit 2600 coupled to a multiplexer.
A constant voltage of 1.4 V was applied. All experiments were carried out with the
sensor chip first exposed to air to obtain the baseline resistance, followed by exposure to
the desired concentrations of hydrogen gas before the air was flushed back to complete a
3. cycle. The sensor was purged for 20 min between successive exposures to hydrogen to
allow for full recovery.
Results and Discussion
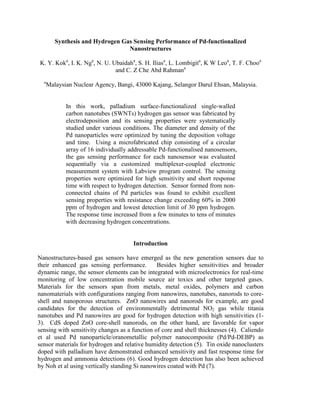
Fig. 1 is the SEM images comparing the effects of frequency and field strength on the
density and alignment of SWNTs across the 3µm-gaps of gold electrodes. Stronger
applied field exerted larger forces on the nanotubes and increased the number of aligned
nanotubes across the gaps of the electrodes. The a.c. frequency, on the other hand,
helped to disperse the nanotubes for a better alignment. Compared to the drop cast
method in which the SWNTs are randomly aligned, a.c. dielectrophoretic technique not
only reduces the amount of SWNTs used, but also allows for better controllability and
reproducibility (8).
Figure 1. SEM images showing the alignment of SWNTs across the 3µm-gaps of the gold
electrodes under various applied voltages and frequencies: (a) 2 Vp-p, 2 MHz (b) 2 Vp-p,
5 MHz (c) 1 Vp-p, 4 MHz (d) 5 Vp-p, 4 MHz. Note: The SWNTs, onto which Pd
nanoparticles have been deposited, are not visible in the figures due to resolution limit of
the SEM used.
Before surface-functionalisation of SWNTs with Pd, Linear Sweep Voltammetry
(LSV) curve for Pd was first obtained by sweeping the applied potential from 0 to -1 V at
a rate of 10 mV s-1
, as shown in Fig. 2. As seen in the figure, the cathodic current
increases rapidly at potentials more negative than -0.6 V when palladium nanoparticles
started to deposit. A maximum is reached at -0.87 V when the rate of electrode reduction
becomes diffusion limited. Different potentials were selected from the potential range for
depositing Pd nanoparticles onto aligned SWNTs at each pair of electrodes. The
deposition time was varied in order to determine the optimum density and size of the Pd
particles for best sensing properties. The size of Pd particles grew with deposition time
until a point where neighboring Pd particles finally merged and coalesced to form pseudo
Pd nanowires. To avoid this, Pd deposition was terminated at the nucleation stage to yield
high density of Pd particles with small particle size.
(a) (b) (c) (d)
4. Figure 2. Linear Sweep Voltammogram for Pd deposition
When Pd functionalized SWNTs are exposed to hydrogen, hydrogen molecules that
have been adsorbed onto Pd surface are dissociated into hydrogen atoms. The hydrogen
atoms diffuse to interfacial sites and induce changes in the Schottky barrier between Pd
particles and SWNTs, resulting in a change in resistivity. The response time is defined as
the time required for reaching 90% of the total change of the electric resistance at a given
H2 concentration. Sensitivity for H2 sensing is defined as (RH− RA)/RA×100%, where RH
and RA are the resistances in the presence of H2 and air respectively. Fig. 3 shows a
typical gas sensing data for Pd functionalized SWNTs and the variations in sensitivity as
a function of hydrogen concentration, from 30 – 2000 ppm.
The response time was found to increase from a few minutes to tens of minutes with
decreasing hydrogen concentration. Pd-functionalized SWNTs registered a resistance
change of exceeding 60% when exposed to 2000 ppm of hydrogen. Bare Pd nanowires
only produce resistance change of 4% when exposed to 2000 ppm of hydrogen (Fig. 4).
Therefore, Pd-functionalised SWNT sensors are better than bare-Pd nanowire sensors for
hydrogen detection in view of the enhanced gas sensing property.
Figure 3. Typical hydrogen sensing response for the Pd-functionalized SWNTs sensor
with a sensitivity of 0.3% /ppm.
-0.0025
-0.002
-0.0015
-0.001
-0.0005
0
-1 -0.9 -0.8 -0.7 -0.6 -0.5
Current
(A)
Potential (V vs Ag/AgCl)
5. Figure 4. (a) Typical hydrogen sensing response from bare Pd nanowires of diameter 200
nm with a sensitivity of 0.002%/ppm. The nanowires were aligned across the gold
electrodes as shown in the SEM image in (b). The Pd nanowires, which were grown by
template assisted electrodeposition, were not continuous and comprised of large grain
particles (as shown in the SEM image of the nanowires embedded in the template) (c).
When hydrogen was incorporated into the Pd particles, the particle grains swelled. This
narrowed the gaps between individual grains and improved the conductivity across the
grains. As a result, a drop in resistance was observed.
Fig. 5 compares the sensing performance of SWNTs functionalized with Pd
nanoparticles of different sizes and densities. All sensors exhibit linear response of up to
2000 ppm hydrogen with lowest detection limit of 30 ppm hydrogen. Non-connected
chains of Pd nanoparticles with diameters less than 100 nm were found to exhibit the best
sensing properties with high sensitivity and fast response time, possibly due to shorter
hydrogen diffusion paths and larger surface-to-volume ratio.
Figure 5: Comparison of the hydrogen sensing responses for SWNTs functionalized with
Pd particles of different sizes and the corresponding SEM images of the Pd particles.
Results from bare Pd nanowires were included for comparison.
0
0.1
0.2
0.3
0.4
0.5
0.6
0.7
0 500 1000 1500 2000
δR/R
ο
Hydrogen concentration (ppm)
90 nm
145 nm
Pd
175 nm
(a) 90 nm (b) 145 nm
(b) 90 nm
(c) 175 nm (d) Pd nanowires
(a) (b)
(c)
6. Conclusion
We have successfully demonstrated the performance of a cost-effective hydrogen gas
sensor constructed from Pd-functionalized SWNTs which were assembled on a
multichannel sensor platform. The sensor was highly selective and sensitive to hydrogen
with low detection limit and short response time. The Pd-functionalised multichannel gas
sensor was more sensitive to hydrogen gas detection than bare Pd- or bare SWNT-based
sensors. The multichannel characteristic of the sensor has enabled the optimization of
SWNT alignment and Pd deposition onto individual pairs of electrodes been carried out
more effectively and efficiently on a single platform.
Acknowledgments
This work is financially supported by the Ministry of Science, Technology and
Innovation, Malaysia (Science Fund #03-03-01-SF0083). The authors also gratefully
acknowledge Prof Nosang Myung from University of California-Riverside for his support.
References
1. Y. J. Choi, I. S. Hwang, J. G. Park, K. J. Choi, J. H. Park and J. H. Lee,
Nanotechnology, 19, 095508 (2008)
2. O. K. Varghese, D. Gong, M. Paulose, K. G. Ong and C. A. Grimes, Sensors and
Actuators B 93, p. 338 (2003).
3. K. J. Jeon, J. M. Lee, E. Lee and W. Lee, Nanotechnology, 20, 135502 (2009).
4. T. Gao, Q. Li and T. Wang, Chem. Mater., 17, p.887 (2005).
5. C. Caliendo, G. Contini, I. Fratoddi, S. Irrera, P. Pertici, G. Scavia and M. V.
Russo, Nanotechnology, 18, 125504 (2007).
6. A. Lassesson, M. Schulze, J. van Lith and S. A. Brown, Nanotechnology, 19,
015502 (2008).
7. J. Noh, H. Kim, B. S. Kim, E. Lee, H. H. Cho and W. Lee, J. Mater. Chem., 21,
p.15935 (2011).
8. S. Mubeen, T. Zhang, B. Yoo, M. A. Deshusses and N. V. Myung, J. Phys. Chem.
C, 111, p. 6321 (2007).