
Recommended
More Related Content
Similar to SAS Results for Problem 2Factor (IV) in ANOVA 2 levels (1 or.docx
Similar to SAS Results for Problem 2Factor (IV) in ANOVA 2 levels (1 or.docx (20)
More from todd331
More from todd331 (20)
Recently uploaded
Recently uploaded (20)
SAS Results for Problem 2Factor (IV) in ANOVA 2 levels (1 or.docx
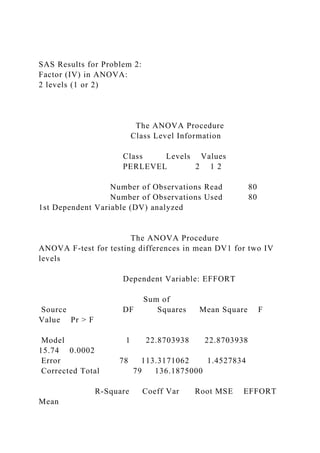
- 1. SAS Results for Problem 2: Factor (IV) in ANOVA: 2 levels (1 or 2) The ANOVA Procedure Class Level Information Class Levels Values PERLEVEL 2 1 2 Number of Observations Read 80 Number of Observations Used 80 1st Dependent Variable (DV) analyzed The ANOVA Procedure ANOVA F-test for testing differences in mean DV1 for two IV levels Dependent Variable: EFFORT Sum of Source DF Squares Mean Square F Value Pr > F Model 1 22.8703938 22.8703938 15.74 0.0002 Error 78 113.3171062 1.4527834 Corrected Total 79 136.1875000 R-Square Coeff Var Root MSE EFFORT Mean
- 2. 0.167933 28.78363 1.205315 4.187500 Source DF Anova SS Mean Square F Value Pr > F PERLEVEL 1 22.87039385 22.87039385 15.74 0.0002 2nd DV analyzed The ANOVA Procedure ANOVA F-test for testing differences in mean DV2 for two IV levels Dependent Variable: UND Sum of Source DF Squares Mean Square F Value Pr > F Model 1 9.3002113 9.3002113 3.92 0.0513 Error 78 185.1872887 2.3741960 Corrected Total 79 194.4875000 R-Square Coeff Var Root MSE UND Mean 0.047819 36.36207 1.540843 4.237500 Source DF Anova SS Mean Square F Value Pr > F PERLEVEL 1 9.30021129 9.30021129 3.92 0.0513
- 3. Note: Good strategy is conduct univariate ANOVA F-tests at a small α (e.g., α = .01 or .02) The ANOVA Procedure ANOVA F-test for testing differences in mean DV3 for two IV levels 3rd DV analyzed Dependent Variable: QUALITY Sum of Source DF Squares Mean Square F Value Pr > F Model 1 7.6597701 7.6597701 5.45 0.0221 Error 78 109.5402299 1.4043619 Corrected Total 79 117.2000000 R-Square Coeff Var Root MSE QUALITY Mean 0.065356 28.90385 1.185058 4.100000 Source DF Anova SS Mean Square F Value Pr > F PERLEVEL 1 7.65977011 7.65977011 5.45 0.0221 4th DV analyzed The ANOVA Procedure ANOVA F-test for testing differences in mean DV4 for two IV levels
- 4. Dependent Variable: LUCK Sum of Source DF Squares Mean Square F Value Pr > F Model 1 10.5261663 10.5261663 3.64 0.0599 Error 78 225.2738337 2.8881261 Corrected Total 79 235.8000000 R-Square Coeff Var Root MSE LUCK Mean 0.044640 37.35052 1.699449 4.550000 Source DF Anova SS Mean Square F Value Pr > F PERLEVEL 1 10.52616633 10.52616633 3.64 0.0599 5th DV analyzed The ANOVA Procedure ANOVA F-test for testing differences in mean DV3 for two IV levels Dependent Variable: DIFF Sum of Source DF Squares Mean Square F Value Pr > F Model 1 4.3206981 4.3206981 2.50 0.1180
- 5. Error 78 134.8668019 1.7290616 Corrected Total 79 139.1875000 R-Square Coeff Var Root MSE DIFF Mean 0.031042 39.69624 1.314938 3.312500 Source DF Anova SS Mean Square F Value Pr > F PERLEVEL 1 4.32069811 4.32069811 2.50 0.1180 Multivariate Analysis of Variance p-values for MANOVA test of Ho: no mean vector differences between the 2 PERLEEVEL groups MANOVA Test Criteria and Exact F Statistics for the Hypothesis of No Overall PERLEVEL Effect H = Anova SSCP Matrix for PERLEVEL E = Error SSCP Matrix S=1 M=1.5 N=36 Statistic Value F Value Num DF Den DF Pr > F Wilks' Lambda 0.67500180 7.13 5 74 <.0001 Pillai's Trace 0.32499820 7.13 5 74 <.0001 Hotelling-Lawley Trace 0.48147752 7.13 5 74 <.0001
- 6. Roy's Greatest Root 0.48147752 7.13 5 74 <.0001 Levene's Test for Homogeneity of EFFORT Variance Sum of Mean Source DF Squares Square F Value Pr > F PERLEVEL 1 1.0414 1.0414 0.30 0.5832 Error 78 267.5 3.4300 p-value for testing equality of variances in DV for 2 PERLEVEL groups (Fail to reject Ho implies equality of variances) Levene's Test for Homogeneity of UND Variance DV analyzed Sum of Mean Source DF Squares Square F Value Pr > F PERLEVEL 1 12.2948 12.2948 1.51 0.2235 Error 78 636.9 8.1650 Levene's Test for Homogeneity of QUALITY Variance Sum of Mean Source DF Squares Square F Value Pr > F
- 7. PERLEVEL 1 11.3703 11.3703 3.51 0.0646 Error 78 252.3 3.2350 Levene's Test for Homogeneity of LUCK Variance Sum of Mean Source DF Squares Square F Value Pr > F PERLEVEL 1 8.0512 8.0512 0.63 0.4285 Error 78 991.5 12.7112 Levene's Test for Homogeneity of DIFF Variance Sum of Mean Source DF Squares Square F Value Pr > F PERLEVEL 1 3.4087 3.4087 0.89 0.3477 Error 78 297.9 3.8188 The ANOVA Procedure 1st DV analyzed Bonferroni (Dunn) t Tests for EFFORT NOTE: This test controls the Type I experimentwise error rate. Alpha 0.05 Error Degrees of Freedom 78 Error Mean Square 1.452783
- 8. Critical Value of t 1.99085 Minimum Significant Difference 0.5581 Harmonic Mean of Cell Sizes 36.975 NOTE: Cell sizes are not equal. Means with the same letter are not significantly different. Ranking of DV means (means with different letters are significantly different) Bon Grouping Mean N PERLEVEL A 4.8966 29 2 B 3.7843 51 1 Bonferroni (Dunn) t Tests for UND NOTE: This test controls the Type I experimentwise error rate. 2nd DV analyzed Alpha 0.05 Error Degrees of Freedom 78 Error Mean Square 2.374196 Critical Value of t 1.99085 Minimum Significant Difference 0.7134 Harmonic Mean of Cell Sizes 36.975 NOTE: Cell sizes are not equal.
- 9. Means with the same letter are not significantly different. Ranking of DV means (means with the same letter are not significantly different) Bon Grouping Mean N PERLEVEL A 4.6897 29 2 A A 3.9804 51 1 Bonferroni (Dunn) t Tests for QUALITY 3rd DV analyzed NOTE: This test controls the Type I experimentwise error rate. Alpha 0.05 Error Degrees of Freedom 78 Error Mean Square 1.404362 Critical Value of t 1.99085 Minimum Significant Difference 0.5487 Harmonic Mean of Cell Sizes 36.975 NOTE: Cell sizes are not equal. Means with the same letter are not significantly different. Bon Grouping Mean N PERLEVEL A 4.3333 51 1
- 10. B 3.6897 29 2 4th DV analyzed Bonferroni (Dunn) t Tests for LUCK NOTE: This test controls the Type I experimentwise error rate. Alpha 0.05 Error Degrees of Freedom 78 Error Mean Square 2.888126 Critical Value of t 1.99085 Minimum Significant Difference 0.7869 Harmonic Mean of Cell Sizes 36.975 NOTE: Cell sizes are not equal. Means with the same letter are not significantly different. Bon Grouping Mean N PERLEVEL A 4.8235 51 1 A A 4.0690 29 2 Bonferroni (Dunn) t Tests for DIFF 5th DV analyzed NOTE: This test controls the Type I experimentwise
- 11. error rate. Alpha 0.05 Error Degrees of Freedom 78 Error Mean Square 1.729062 Critical Value of t 1.99085 Minimum Significant Difference 0.6088 Harmonic Mean of Cell Sizes 36.975 NOTE: Cell sizes are not equal. Means with the same letter are not significantly different. Bon Grouping Mean N PERLEVEL A 3.6207 29 2 A A 3.1373 51 1 SOPHOMORE - PRACTICING A - level Written Communication SOPHOMORE - PRACTICING B - level Written Communication SOPHOMORE - PRACTICING C - level Written Communication
- 12. SOPHOMORE - PRACTICING D - level Written Communication SOPHOMORE - PRACTICING F - level Written Communication Using language (grammar, syntax, mechanics) with almost no errors, the work is very well organized and very clearly communicates meaning while using good, relevant, and compelling content and sources to illustrate good understanding of the subject. The work well addresses the context, audience, and purpose of the assignment. Using language (grammar, syntax, mechanics) with minimal errors, the work is well organized and very clearly communicates meaning while using appropriate, relevant, and compelling content and sources to illustrate good understanding of the subject. The work addresses the context, audience, and purpose of the assignment. Using language (grammar, syntax, mechanics) that may have some errors, but overall the work is mostly organized and clearly communicates meaning while using appropriate and relevant content and sources to illustrate general understanding of the
- 13. subject. The work begins to address the context, audience and purpose of the assignment. Using language (grammar, syntax, mechanics) that has many errors and some vague areas, the work is not organized and does not communicate clear meaning. Content and sources are not very appropriate nor relevant to illustrate general understanding of the subject. The work does not satisfactorily address the context, audience and purpose of the assignment. Using language (grammar, syntax, mechanics) that has too many errors and vague areas, the work is poorly organized and fails to communicate a clear meaning. Content and sources are neither appropriate nor relevant to illustrate any understanding of the subject. The work fails to address the context, audience and purpose of the assignment. SOPHOMORE - PRACTICING A - level Critical Thinking SOPHOMORE - PRACTICING B - level Critical Thinking SOPHOMORE - PRACTICING
- 14. C - level Critical Thinking SOPHOMORE - PRACTICING D - level Critical Thinking SOPHOMORE - PRACTICING F - level Critical Thinking Issue/problem to be considered critically is very clear. Ideas are taken from quality sources with very good interpretation/evaluation and questioning. Distinguishes between key assumptions and contexts, addresses multiple viewpoints, and clearly integrates own and others’ points with very sound reasoning. Issue/problem to be considered critically is clear. Ideas are taken from quality sources with good interpretation/evaluation and questioning. Generally distinguishes between key assumptions and contexts, addresses some multiple viewpoints, and generally integrates own and others’ points with sound reasoning. Issue/problem to be considered critically is generally clear. Ideas are taken from quality sources with adequate interpretation/ evaluation
- 15. and adequate questioning. Identifies key assumptions and contexts, begins to address multiple viewpoints, and begins to integrate own and others’ points with basically sound reasoning. Issue/problem to be considered critically is only minimally clear. Ideas are taken from quality sources with minimal interpretation/ evaluation and questioning. The work does not identify key assumptions and contexts nor does it address multiple viewpoints. The approach does not integrate own and others’ points and the reasoning is somewhat faulty. Issue/problem to be considered critically is not clear and/or very ambiguous. Ideas are taken from poor or sources with virtually no interpretation/ evaluation and questioning. The work does not identify key any assumptions and contexts nor does it address multiple viewpoints. The approach does not integrate own and others’ points and the reasoning is faulty. SOPHOMORE - PRACTICING A - level Information Literacy SOPHOMORE - PRACTICING B - level Information Literacy
- 16. SOPHOMORE - PRACTICING C - level Information Literacy SOPHOMORE - PRACTICING D - level Information Literacy SOPHOMORE - PRACTICING F - level Information Literacy Information literacy skills are demonstrated through at least TWO evaluative annotations for books or substantial articles (preferably peer reviewed) found through the Otis Library databases. Annotations must include: 1. author credentials 2. a description of the type of source (audience) 3. a discussion about purpose/bias/point of view 4. a discussion of currency of the source 5. an explanation about why the source is relevant to the project/paper. A works cited page is required and must include at least 5 QUALITY sources that are incorporated into paper/project. Information literacy skills are demonstrated through at least TWO
- 17. evaluative annotations for books or substantial articles (preferably peer reviewed) found through the Otis Library databases. Annotations must include: 1. author credentials 2. a description of the type of source (audience) 3. a discussion about purpose/bias/point of view 4. an explanation about why the source is relevant to the project/paper. A works cited page is required and must include at least 4 QUALITY sources that are incorporated into paper/project. Information literacy competency is demonstrated through at least TWO evaluative annotations for books or substantial articles (preferably peer reviewed) found through the Otis Library databases. Annotations must include: 1. author credentials 2. a description of the type of source (audience) 3. an explanation about why the source is relevant to the project/paper A works cited page is required and must include at least 3 QUALITY sources that are incorporated into
- 18. paper/project. Any of the following: - inferior or missing annotations - author credentials missing - type of source/audience missing - relevance is missing - works cited page missing - fewer than 3 QUALITY sources - too many free web sources or low- quality, inadequate or inferior sources are used - sources not incorporated in paper _______________________________ A QUALITY source is not necessarily the first or easiest found. Should be peer-reviewed or substantial material that considers multiple points of view and relies on evidence, logic, and research to create a context. It has at least one named author and is up to date. Any of the following: - inferior or no annotations - no works cited page - no QUALITY sources - only free web sources or low-quality, inadequate or inferior sources are used - sources not incorporated in paper Signature Assignment
- 19. “In the long history of humankind (and animal kind, too) those who learned to collaborate and improvise most effectively have prevailed.” Charles Darwin, The Origin of Species For your Signature Assignment, you’ll be applying improv techniques to a particular problem. The problem can be personal, political, environmental, social, or a variety of the above. Diagnose the problem and decide how various improvisational skills can be used to better the situation. This 1500-word essay will be part narrative description, part research, and part analysis. Example problems to diagnose: How could a particular struggle in your art or design practice be helped by the philosophy of ‘yes, and…’? How can establishing the ‘who, what, and where?’ help abate the proliferation of fake news? How can ‘facing the facts’ foster more community on campus? In activist groups? Research: While this essay will have a narrative component, detailing your own experiences
- 20. with improv, this is also a research paper. You will need to include four sources and two annotations. If you decide to write about a topic from your personal life, be sure you understand the greater thematic elements at play so you can find relevant sources and include multiple points of view. For instance, if you are writing about your perfectionism in studio, you can research how psychology, philosophy or world religions have grappled with this common problem. You could also research specific topics in your major. How do improv techniques align or conflict with your discipline? Those of you choosing a political or social issue will perhaps have an easier time coming up with research topics, but remember that you must include your own experiences with improvisation and explain how they apply, or could be applied, to this issue. You may also need to write how improvisation does not serve your paper topic. Below is a review of some of the concepts* we practiced this term: Yes, and...
- 21. Giving gifts Accepting reality/Facing the Facts Establishing the Who, What, & Where The 'If blank is true, then what else is true' pattern Labeling broad and playing specific Listening instead of planning Taking risks Surrendering your own ideas for the group Clunky and clear is better than clever and vague Taking care of each other Status in relationships *These are not all of the techniques we explored. If you think of another improv technique and want to integrate it into your essay – please do! Assignment Requirements: Minimum of 6 pages/1500 words. Use at least 4 quality sources and integrate these sources into your final paper.
- 22. Write 2 annotations, as outlined in the Source Worksheet <doc>. Rough Draft for Peer Review. 2nd Draft emailed to Instructor ([email protected]) Students will post their final draft on their Learning Portfolio for this class and "submit" the final draft as "Signature Assignment". There must be an element of document design - proper formatting and integration of media. Please see the Signature Assignment Rubric <pdf> Final Pointers: -If appropriate, feel free to use the articles we read in class as sources for your research. -Be sure you chose a particular issue, struggle, or experience. Don’t generalize For example: Being a product designer is like saying ‘yes, and...’ to life = general On my internship, I was what we call ‘blocking’ in improv - not participating, disagreeing, and looking at the clock. Then, I said yes to my colleague’s suggestion. I was irritated at first, but it turns out his wood and earthy designs for the flatware were much more aligned with the aesthetic the client was looking for. = specific SAS Results for Problem 3:
- 23. SAS output for Stepwise Discriminant Analysis (only useful when trying to select best subset of IVs from a long list of potential IVs) STEPWISE DISCRIMINANT ANALYSIS The STEPDISC Procedure The Method for Selecting Variables is STEPWISE Total Sample Size 569 Variable(s) in the Analysis 14 Class Levels 2 Variable(s) Will Be Included 0 Significance Level to Enter 0.15 Significance Level to Stay 0.15 Number of Observations Read 716 Number of Observations Used 569 DV (2 levels) Class Level Information Variable ADOPT Name Frequency Weight Proportion 0 _0 468 468.0000 0.822496 p-values: Ho tested is no difference between means of IV for 2 Adopt status levels, using all other IVs as covariates 1 _1 101 101.0000 0.177504
- 24. IVs selected by stepwise routine The STEPDISC Procedure Stepwise Selection Summary Number Partial Step In Entered Removed Label R- Square F Value Pr > F 1 1 NUMIT 0.0747 45.77 <.0001 2 2 REVDUM 0.0306 17.84 <.0001 3 3 CHLEADER My company is obligated to do as 0.0324 18.91 <.0001 4 4 P2HDUM 0.0310 18.04 <.0001 5 5 WMLDUM 0.0162 9.26 0.0025 6 6 P2LDUM 0.0129 7.34 0.0069 7 7 QUALITY Product quality 0.0076 4.28 0.0390 8 8 SERVICE My firm feels my channel or supply 0.0055 3.08 0.0796 9 9 FIRMDUM 0.0050 2.81 0.0942 10 10 WMHDUM 0.0054 3.04 0.0820 11 9 WMLDUM 0.0033 1.83 0.1763 12 10 BRHDUM 0.0056 3.16 0.0759 13 11 WMLDUM 0.0041 2.32 0.1285
- 25. Note: With 14 potential IVs, Step 1 conducts 14 ANCOVAs, Step 2 conducts 13 ANCOVAs, Step 3 conducts 12 ANCOVAs, etc. At each step, IV with smallest p-value is selected DA function includes the 1st 7 IVs selected by Stepwise DA SAS output for Discriminant Analysis (assuming MV normal distribution) NORMAL DISCRIMINANT ANALYSIS The DISCRIM Procedure Total Sample Size 626 DF Total 625 Variables 7 DF Within Classes 624 Classes 2 DF Between Classes 1 Prior probabilities used Number of Observations Read 716 DV (2 levels) Number of Observations Used 626 Class Level Information Variable Prior ADOPT Name Frequency Weight Proportion Probability 0 _0 512 512.0000 0.817891 0.817891 1 _1 114 114.0000 0.182109 0.182109
- 26. NORMAL DISCRIMINANT ANALYSIS The DISCRIM Procedure Test of Homogeneity of Within Covariance Matrices Notation: K = Number of Groups P = Number of Variables N = Total Number of Observations - Number of Groups N(i) = Number of Observations in the i'th Group - 1 __ N(i)/2 || |Within SS Matrix(i)| V = ----------------------------------- N/2 |Pooled SS Matrix| _ _ 2 | 1 1 | 2P + 3P - 1 RHO = 1.0 - | SUM ----- - --- | ------------- |_ N(i) N _| 6(P+1)(K-1) DF = .5(K-1)P(P+1) _ _ | PN/2 | | N V | p-value for testing Ho: equal Var-Cov matrix Under the null hypothesis: -2 RHO ln | --------------- --- | | __ PN(i)/2 | |_ || N(i) _| SAS uses Linear DA if equal Var-Cov matrix; uses Quadratic DA if unequal (i.e., if reject Ho at alpha=.10)
- 27. is distributed approximately as Chi-Square(DF). Chi-Square DF Pr > ChiSq 234.291358 28 <.0001 Since the Chi-Square value is significant at the 0.1 level, the within covariance matrices will be used in the discriminant function. Reference: Morrison, D.F. (1976) Multivariate Statistical Methods p252. p-values for MANOVA test of Ho: no mean vector differences between the 2 ADOPT groups NORMAL DISCRIMINANT ANALYSIS The DISCRIM Procedure Multivariate Statistics and Exact F Statistics S=1 M=2.5 N=308 Statistic Value F Value Num DF Den DF Pr > F Wilks' Lambda 0.80289363 21.67 7 618 <.0001 Pillai's Trace 0.19710637 21.67 7 618 <.0001 Hotelling-Lawley Trace 0.24549500 21.67 7 618 <.0001 Roy's Greatest Root 0.24549500 21.67 7 618 <.0001
- 28. NORMAL DISCRIMINANT ANALYSIS The DISCRIM Procedure Classification Summary for Calibration Data: WORK.RFID Resubstitution Summary using Quadratic Discriminant Function Number of Observations and Percent Classified into ADOPT From ADOPT 0 1 Total 0 400 112 512 Summary table of Hit Rates when using all data to estimate DA function 78.13 21.88 100.00 1 37 77 114 32.46 67.54 100.00 Total 437 189 626 69.81 30.19 100.00 Priors 0.81789 0.18211 Error Count Estimates for ADOPT 0 1 Total Rate 0.2188 0.3246 0.2380 Priors 0.8179 0.1821
- 29. NORMAL DISCRIMINANT ANALYSIS The DISCRIM Procedure Classification Summary for Calibration Data: WORK.RFID Cross-validation Summary using Quadratic Discriminant Function Hit Rate for ADOPT=0 Number of Observations and Percent Classified into ADOPT From ADOPT 0 1 Total 0 398 114 512 Summary table of Hit Rates when using jackknife method to estimate DA function 77.73 22.27 100.00 1 50 64 114 43.86 56.14 100.00 Total 448 178 626 71.57 28.43 100.00 Priors 0.81789 0.18211 Hit Rate for ADOPT=1
- 30. Error Count Estimates for ADOPT 0 1 Total Rate 0.2227 0.4386 0.2620 Priors 0.8179 0.1821 Overall hit rate = 1 - .262 = .738 SAS output Stepwise Logistic Regression STEPWISE LOGISTIC REGRESSION The LOGISTIC Procedure Model Information Data Set WORK.RFIDSUB Response Variable ADOPT Number of Response Levels 2 Model binary logit Number of Observations Read 716 Number of Observations Used 569 DV (2 levels): 1=Adopt RFID 0=No adoption Response Profile Ordered Total Value ADOPT Frequency 1 0 468 2 1 101
- 31. Probability modeled is ADOPT=1. NOTE: 147 observations were deleted due to missing values. Stepwise Selection Procedure SAS creates dummy variables for QL IVs Class Level Information Design Class Value Variables WLAN HI-USE 1 0 LO-USE 0 1 NO-USE -1 -1 WMS HI-USE 1 0 LO-USE 0 1 NO-USE -1 -1 BAR HI-USE 1 0 LO-USE 0 1 P2LS HI-USE 1 0 LO-USE 0 1 NO-USE -1 -1 REVENUE HIGH 1 LOW -1 FIRMTYPE DOM 1 INT -1
- 32. p-values for Ho: beta associated with IV = 0 STEPWISE LOGISTIC REGRESSION IVs selected by the stepwise routine Summary of Stepwise Selection Effect Number Score Wald Variable Step Entered Removed DF In Chi-Square Chi-Square Pr > ChiSq Label 1 NUMIT 1 1 42.4998 <.0001 2 REVENUE 1 2 20.5906 <.0001 3 CHLEADER 1 3 17.1828 <.0001 4 P2LS 2 4 18.1073 0.0001 5 WMS 2 5 12.3397 0.0021 Type 3 Analysis of Effects Note: With 14 potential IVs, Step 1 conducts 14 chi-sq tests (one for each IV), Step 2 conducts 13 chi-sq tests, Step 3 conducts 12 chi-sq tests, etc. At each step, IV with smallest p- value is selected Wald Effect DF Chi-Square Pr > ChiSq CHLEADER 1 16.5384 <.0001 NUMIT 1 7.2375 0.0071 WMS 2 11.3212 0.0035 P2LS 2 19.0501 <.0001 REVENUE 1 23.4229 <.0001 Analysis of Maximum Likelihood Estimates
- 33. Standard Wald Parameter DF Estimate Error Chi-Square Pr > ChiSq Intercept 1 -5.6041 0.7805 51.5490 <.0001 CHLEADER 1 0.3095 0.0761 16.5384 <.0001 NUMIT 1 0.3620 0.1346 7.2375 0.0071 WMS HI-USE 1 0.8305 0.2512 10.9344 0.0009 WMS LO-USE 1 -0.6511 0.3810 2.9205 0.0875 P2LS HI-USE 1 -1.2804 0.3046 17.6678 <.0001 P2LS LO-USE 1 0.9976 0.2706 13.5920 0.0002 REVENUE HIGH 1 0.8824 0.1823 23.4229 <.0001 SAS output for fit of Logistic Regression model with only main effects of IVs selected by stepwise MAIN EFFECTS LOGISTIC REGRESSION The LOGISTIC Procedure Model Information Data Set WORK.RFID
- 34. Response Variable ADOPT Number of Response Levels 2 Model binary logit Number of Observations Read 716 Number of Observations Used 626 Response Profile Ordered Total π = P(Adopt RFID) is probability modeled in logistic regression equation Value ADOPT Frequency DV (2 levels): 1=Adopt RFID 0=No adoption 1 0 512 2 1 114 Probability modeled is ADOPT=1. NOTE: 90 observations were deleted due to missing values. Rsq statistic used to assess fit: Values near 1 are excellent fit, values near 0 are poor fit (Subjective decision) Model Convergence Status Convergence criterion (GCONV=1E-8) satisfied. Model Fit Statistics Intercept
- 35. Intercept and Criterion Only Covariates AIC 596.169 465.647 SC 600.608 501.162 -2 Log L 594.169 449.647 p-value for overall model chi-sq test of Ho: all betas in model = 0 (Reject Ho implies a statistically useful model) R-Square 0.2062 Max-rescaled R-Square 0.3363 Number of IVs in model is 7 -- the IVs selected by the stepwise routine Testing Global Null Hypothesis: BETA=0 Test Chi-Square DF Pr > ChiSq Likelihood Ratio 144.5219 7 <.0001 Score 123.3886 7 <.0001 Wald 86.0149 7 <.0001 MAIN EFFECTS LOGISTIC REGRESSION p-values for testing each IV in model, Ho: beta associated with IV = 0 (Reject Ho implies IV is a statistically useful predictor) Analysis of Maximum Likelihood Estimates Standard Wald
- 36. Parameter DF Estimate Error Chi-Square Pr > ChiSq Intercept 1 -6.5899 0.7008 88.4291 <.0001 Independent variables (IV) in model CHLEADER 1 0.3148 0.0728 18.6977 <.0001 NUMIT 1 0.4359 0.1296 11.3081 0.0008 REVDUM 1 1.7115 0.3389 25.5101 <.0001 P2HDUM 1 -1.6445 0.4420 13.8436 0.0002 P2LDUM 1 0.6271 0.3881 2.6102 0.1062 WMHDUM 1 0.9445 0.5089 3.4439 0.0635 WMLDUM 1 -0.3953 0.6878 0.3303 0.5655 95% Confidence Interval for odds ratio (OR) estimate of each IV in model Odds Ratio Estimates Odds ratio (OR) estimates for each IV in model Point 95% Wald Effect Estimate Confidence Limits CHLEADER 1.370 1.188 1.580 NUMIT 1.546 1.199 1.994 REVDUM 5.537 2.850 10.758 OR values > 1 imply odds increase as IV increases; OR values < 1 imply odds decrease as IV increases
- 37. P2HDUM 0.193 0.081 0.459 Odds of Adopt RFID increase 1.55 times (i.e., by 55%) for each unit increase in NUMIT P2LDUM 1.872 0.875 4.006 WMHDUM 2.572 0.948 6.973 WMLDUM 0.673 0.175 2.593 Association of Predicted Probabilities and Observed Responses Percent Concordant 82.6 Somers' D 0.667 Percent Discordant 16.0 Gamma 0.676 Summary table of predictions using jackknife method Percent Tied 1.4 Tau-a 0.199 Pairs 58368 c 0.833 Level used for making predictions (e.g., .5). If predicted prob. of adopting RFID (π) > .5 then predict company will adopt. If predicted π < .5, then predict company will not adopt. Classification Table Correct Incorrect Percentages Prob Non- Non- Sensi- Speci- False False Level Event Event Event Event Correct tivity ficity POS NEG For a given prob. level: Sensitivity is Hit Rate for Adopters; Specificity is Hit Rate for Non-adopters Select prob. level based on maximizing these hit rates 0.100 111 285 227 3 63.3 97.4 55.7 67.2
- 38. 1.0 0.200 81 370 142 33 72.0 71.1 72.3 63.7 8.2 0.300 60 437 75 54 79.4 52.6 85.4 55.6 11.0 0.400 39 464 48 75 80.4 34.2 90.6 55.2 13.9 0.500 23 487 25 91 81.5 20.2 95.1 52.1 15.7 0.600 16 496 16 98 81.8 14.0 96.9 50.0 16.5 0.700 8 507 5 106 82.3 7.0 99.0 38.5 17.3 0.800 4 512 0 110 82.4 3.5 100.0 0.0 17.7 0.900 0 512 0 114 81.8 0.0 100.0 . 18.2 SAS output for testing interactions of channel leader IV with other IVs in Logistic Regression model TEST CHANNEL LEADER INTERACTIONS The LOGISTIC Procedure Model Information Data Set WORK.RFID Response Variable ADOPT Number of Response Levels 2 Model binary logit Number of Observations Read 716 Number of Observations Used 626
- 39. Response Profile Ordered Total Value ADOPT Frequency 1 0 512 2 1 114 Probability modeled is ADOPT=1. NOTE: 90 observations were deleted due to missing valuess. Model Convergence Status Convergence criterion (GCONV=1E-8) satisfied. Model Fit Statistics Intercept Intercept and Criterion Only Covariates AIC 596.169 470.688 SC 600.608 532.839 -2 Log L 594.169 442.688 R-Square 0.2149 Max-rescaled R-Square 0.3507 Number of IVs in model is 13 -- the 7 IVs selected by the stepwise routine + 6 interactions with channel leader Testing Global Null Hypothesis: BETA=0 Test Chi-Square DF Pr > ChiSq
- 40. Likelihood Ratio 151.4814 13 <.0001 Score 127.2428 13 <.0001 Wald 76.3402 13 <.0001 TEST CHANNEL LEADER INTERACTIONS Analysis of Maximum Likelihood Estimates Standard Wald Parameter DF Estimate Error Chi-Square Pr > ChiSq Intercept 1 -11.8112 2.6631 19.6704 <.0001 CHLEADER 1 1.3518 0.4700 8.2711 0.0040 NUMIT 1 0.6703 0.3899 2.9559 0.0856 REVDUM 1 2.6683 1.1137 5.7407 0.0166 P2HDUM 1 -2.4134 1.2934 3.4819 0.0620 P2LDUM 1 0.3411 1.0803 0.0997 0.7522 WMHDUM 1 4.4171 2.5652 2.9651 0.0851 WMLDUM 1 3.7808 2.9408 1.6528 0.1986 CHL_NUM 1 -0.0469 0.0812 0.3335 0.5636 CHL_REV 1 -0.2023 0.2204 0.8426 0.3587 CHL_WMH 1 -0.6879 0.4753 2.0947
- 41. 0.1478 CHL_WML 1 -0.8488 0.5723 2.1997 0.1380 CHL_P2H 1 0.1676 0.2725 0.3782 0.5385 CHL_P2L 1 0.0599 0.2414 0.0617 0.8039 Odds Ratio Estimates Point 95% Wald Effect Estimate Confidence Limits These are the 7 IVs selected by stepwise CHLEADER 3.864 1.538 9.709 NUMIT 1.955 0.910 4.197 REVDUM 14.416 1.625 127.881 P2HDUM 0.090 0.007 1.129 P2LDUM 1.407 0.169 11.687 WMHDUM 82.854 0.543 >999.999 p-value for testing the interactions (nested model test); Ho: all interaction betas =0 (Fail to reject Ho implies interactions are not significant) WMLDUM 43.850 0.138 >999.999 CHL_NUM 0.954 0.814 1.119 These are the 6 channel leader interactions CHL_REV 0.817 0.530 1.258 CHL_WMH 0.503 0.198 1.276 CHL_WML 0.428 0.139 1.314 CHL_P2H 1.182 0.693 2.017 CHL_P2L 1.062 0.662 1.704 Linear Hypotheses Testing Results
- 42. Wald Label Chi-Square DF Pr > ChiSq CHLEADER_INTERACTION 5.7630 6 0.4503 Number of terms (interactions) tested TEST NUMBER IT INTERACTIONS SAS output for testing interactions of NUMIT IV with other IVs in Logistic Regression model The LOGISTIC Procedure Model Information Data Set WORK.RFID Response Variable ADOPT Number of Response Levels 2 Model binary logit Optimization Technique Fisher's scoring Number of Observations Read 716 Number of Observations Used 626 Response Profile Ordered Total Value ADOPT Frequency 1 0 512 2 1 114
- 43. Probability modeled is ADOPT=1. NOTE: 90 observations were deleted due to missing values. Model Convergence Status Convergence criterion (GCONV=1E-8) satisfied. Model Fit Statistics Intercept Intercept and Criterion Only Covariates AIC 596.169 460.609 SC 600.608 522.760 -2 Log L 594.169 432.609 Number of IVs in model is 13 -- the 7 IVs selected by the stepwise routine + 6 interactions with NUMIT Testing Global Null Hypothesis: BETA=0 Test Chi-Square DF Pr > ChiSq Likelihood Ratio 161.5598 13 <.0001 Score 130.3523 13 <.0001 Wald 69.9183 13 <.0001 TEST NUMBER IT INTERACTIONS The LOGISTIC Procedure Analysis of Maximum Likelihood Estimates
- 44. Standard Wald Parameter DF Estimate Error Chi-Square Pr > ChiSq Intercept 1 -11.4784 2.5018 21.0504 <.0001 CHLEADER 1 0.7476 0.3019 6.1310 0.0133 NUMIT 1 1.3536 0.5507 6.0409 0.0140 REVDUM 1 5.2846 1.6370 10.4219 0.0012 P2HDUM 1 -4.4241 3.1177 2.0136 0.1559 P2LDUM 1 4.4983 2.2370 4.0436 0.0443 WMHDUM 1 1.0095 1.3328 0.5737 0.4488 WMLDUM 1 -7.4836 3.7309 4.0234 0.0449 CHL_NUM 1 -0.0858 0.0598 2.0609 0.1511 NUM_REV 1 -0.7198 0.3025 5.6619 0.0173 NUM_WMH 1 0.0565 0.3817 0.0220 0.8822 NUM_WML 1 1.3533 0.7071 3.6632 0.0556 NUM_P2H 1 0.4742 0.5318 0.7952 0.3725 NUM_P2L 1 -0.7049 0.3867 3.3223 0.0683 Odds Ratio Estimates
- 45. Point 95% Wald Effect Estimate Confidence Limits CHLEADER 2.112 1.169 3.817 NUMIT 3.871 1.315 11.393 REVDUM 197.280 7.974 >999.999 P2HDUM 0.012 <0.001 5.401 P2LDUM 89.865 1.121 >999.999 WMHDUM 2.744 0.201 37.399 WMLDUM <0.001 <0.001 0.843 These are the 6 NUMIT interactions CHL_NUM 0.918 0.816 1.032 NUM_REV 0.487 0.269 0.881 NUM_WMH 1.058 0.501 2.236 NUM_P2H 1.607 0.567 4.556 NUM_P2L 0.494 0.232 1.055 Linear Hypotheses Testing Results p-value for testing the interactions (nested model test); Ho: all interaction betas =0 (Fail to reject Ho implies interactions are not significant) Wald Label Chi-Square DF Pr > ChiSq NUMIT_INTERACTION 14.3850 6 0.0256 Note: When conducting multiple tests better to test each at a small α (e.g., .01) Number of terms (interactions) tested For each problem, submit a document that describes:
- 46. 1. (1) the research question(s) of interest 2. (2) the method of analysis and why it is appropriate 3. (3) the assumptions that underlie the method 4. (4) the statistical tests to be conducted 5. (5) a discussion of results that will answer the research question Assume you are writing the "methods" section of a research paper to be submitted to a professional journal. Problem Set 2 answer 1- The research questions Is to determine whether the means of the outcome variables described above differ depending on performance level. 2-The method of analysis used in this case isMANOVA and why it is appropriate Multivariate analysis of variance (MANOVA) is simply an ANOVA with several dependent variables. That is to say, ANOVA tests for the difference in means between two or more groups, while MANOVA tests for the difference in two or more vectors of means this is why we have to used here. 3- Assumptions · Equality regarding covariance matrices · Each sample group is taken from a normally distributed population · The observations are sampled independently and randomly of each other 4- the statistical tests to be conducted It's better to conduct Bonferroni is more flexible and easier to compute, it has limitations. Bonferroni assumes that tests are independent while calculating familywise error -5-discussion of results that will answer the research question - Discussion of results - MANOVA Test Criteria and Exact F Statistics. for the Hypothesis of No Overall PERLEVEL Effect H = Anova SSCP Matrix for PERLEVEL E = Error SSCP Matrix S=1 M=1.5 N=36
- 47. Statistic Value F Value Num DF Den DF Pr > F Wilks' Lambda 0.67500180 7.13 5 74 <.0001 Pillai's Trace 0.32499820 7.13 5 74 <.0001 Hotelling-Lawley Trace 0.48147752 7.13 5 74 <.0001 Roy's Greatest Root 0.48147752 7.13 5 74 <.0001 (p-values for MANOVA test of Ho: no mean vector differences between the 2 PERLEEVEL groups) Levene's Test for Homogeneity of EFFORT Variance Sum of Mean Source DF Squares Square F Value Pr > F PERLEVEL 1 1.0414 1.0414 0.30 0.5832 p-value for testing equality of variances in DV for 2 PERLEVEL groups (Fail to reject Ho implies equality of variances) - Discussion of results - ANOVA 1st Dependent Variable analyzed EFFORT Corrected Total 79 136.1875000 R-Square Coeff Var Root MSE EFFORT Mean 0.167933 28.78363 1.205315 4.187500 Source DF Anova SS Mean Square F Value Pr > F PERLEVEL 1 22.87039385 22.87039385 15.74 0.0002
- 48. · There is a significant difference in the mean 2en Dependent Variable analyzed UND Source DF Squares Mean Square F Value Pr > F Model 1 9.3002113 9.3002113 3.92 0.0513 Error 78 185.1872887 2.3741960 Corrected Total 79 194.4875000 R-Square Coeff Var Root MSE UND Mean 0.047819 36.36207 1.540843 4.237500 Source DF Anova SS Mean Square F Value Pr > F PERLEVEL 1 9.30021129 9.30021129 3.92 0.0513 · There is NO significant difference in the mean 3rd Dependent Variable analyzed QUALIT Source DF Squares Mean Square F Value Pr > F Model 1 7.6597701 7.6597701 5.45 0.0221 Error 78 109.5402299 1.4043619 Corrected Total 79 117.2000000 R-Square Coeff Var Root MSE QUALITY Mean 0.065356 28.90385 1.185058 4.100000 Source DF Anova SS Mean Square F Value Pr > F
- 49. PERLEVEL 1 7.65977011 7.65977011 5.45 0.0221 • There is NO significant difference in the mean 4rd Dependent Variable analyzed LUCK Source DF Squares Mean Square F Value Pr > F Model 1 10.5261663 10.5261663 3.64 0.0599 Error 78 225.2738337 2.8881261 Corrected Total 79 235.8000000 R-Square Coeff Var Root MSE LUCK Mean 0.044640 37.35052 1.699449 4.550000 Source DF Anova SS Mean Square F Value Pr > F PERLEVEL 1 10.52616633 10.52616633 3.64 0.0599 • There is NO significant difference in the mean 5rd Dependent Variable analyzed DIFF Source DF Squares Mean Square F Value Pr > F Model 1 4.3206981 4.3206981 2.50 0.1180 Error 78 134.8668019 1.7290616 Corrected Total 79 139.1875000 R-Square Coeff Var Root MSE DIFF Mean 0.031042 39.69624 1.314938 3.312500
- 50. Source DF Anova SS Mean Square F Value Pr > F PERLEVEL 1 4.32069811 4.32069811 2.50 0.1180 • There is NO significant difference in the mea PROBLEMS/DATA SETS The following problems (with associated data sets) are designed to test your ability to determine the proper multivariate statistical method(s) to apply in order to answer the research question(s) of interest. For each problem, submit a document that describes: (1) the research question(s) of interest (2) the method of analysis and why it is appropriate (3) the assumptions that underlie the method (4) the statistical tests to be conducted (5) a discussion of results that will answer the research question Assume you are writing the "methods" section of a research paper to be submitted to a professional journal. Each of the 2 data sets described employs at least one of the following statistical methods: (1) Analysis of Variance (2) Analysis of Covariance (3) Multivariate Analysis of Variance (4) Multivariate Analysis of Covariance (5) Discriminant Analysis (6) Logistic Regression
- 51. (7) Cluster Analysis (8) Principal Components (9) Exploratory Factor Analysis (10) Confirmatory Factor Analysis . Problem 2: Attribution theory is concerned with the cognitive processes that individuals use to explain their own performance in situations where causal relations are ambiguous. Empirical evidence indicates a tendency for individuals to attribute their own successful performance to internal factors, such as effort or ability, while poor performance is attributed to external factors beyond the individual's control. An experiment was conducted to examine the causal reasoning patterns of system users at the conclusion of a competitive, computer-based business game. Eighty MBA students used what appeared to be different computer models to analyze unexpected variances in manufacturing costs. (Actually, all students utilized the same computer model.) Upon completion, students were paid an amount based on their overall performance: those who were told they performed poorly relative to their peers were paid $5, while those who were told they did well earned $20. (In actuality, the students were randomly assigned to one of the two performance groups.) At the time of payment, participants completed an evaluation form upon which five outcome variables were measured (each on a 7-point Likert scale): Internal Outcome SAS Variable Names EFFORT -- amount of effort expended UND -- how well they understood the cost structure External Outcome SAS Variable Names
- 52. QUALITY -- quality of the computer model used LUCK -- level of good/bad luck DIFF -- difficulty of the task itself The main purpose of the study is to determine whether the means of the outcome variables described above differ depending on performance level (SAS variable defined below). PERLEVEL = 1 if poor performance ($5), 2 if good performance ($20) The data are saved in the ATTRIB SAS file. Several observations are listed below. PERLEVEL EFFORT UND QUALITY LUCK DIFF 1 4 6 5 4 3 1 3 4 6 1 1 1 3 4 4 6 3 1 3 3 5 5 5 1 4 5 5 6 1 2 7 5 4 4 4 2 5 2 1 6 6 2 5 3 3 4 5 2 4 3 1 2 4 2 4 5 4 5 4 Problem 3: Radio-frequency identification (RFID) is the wireless use of electromagnetic fields to track data. Some industries have already adopted RFID technology (e.g., an RFID tag attached to an automobile during production is used to track its progress through the assembly line), but others have yet to adopt. This study attempts to identify those factors that increase the likelihood or probability of RFID adoption for supply chain
- 53. management companies. Data were collected through a Web-based survey of managers who are members of the Institute for Supply Management (ISM). A total of 755 managers participated in the survey. A list of the variables measured for each manager is provided below (SAS variable name given first). The researchers want to use these variables to build an algorithm which accurately predicts whether or not a supply management firm will adopt RFID technology. ASDOPT -- Firm’s RFID adoption status (1=adopted, 0=not adopted) NUMIT -- Total number of other information technology adoptions at firm WLAN – Level of wireless LAN adoption (HI-USE, LO-USE, or NO-USE) WMS – Level of warehouse management system adoption (HI- USE, LO-USE, or NO-USE) BAR – Level of barcode adoption (HI-USE, LO-USE, or NO- USE) P2LS – Level of “pick-to-light” system adoption (HI-USE, LO- USE, or NO-USE) FIRMTYPE – Domestic (DOM) or International (INT) firm REVENUE – Firm revenue status (LOW or HIGH) CHLEADER -- “My firm is obligated to do as the channel/supply chain leader suggests” (7-point Likert scale where 1=strongly disagree and 7=strongly agree) QUALITY -- “My firm is concerned with product quality” (7-point Likert scale where 0=never and 7=always) SERVICE -- “My firm feels channel/supply chain leader provides services needed”
- 54. (7-point Likert scale where 1=strongly disagree and 7=strongly agree) The data are saved in the RFID SAS file. Several observations are listed below. CHLEADER QUALITY SERVICE ADOPT WLAN WMS BAR P2LS NUMIT REVENUE FIRMTYPE 4 1 2 1 LO-USE NO-USE LO-USE NO-USE 3 LOW DOM 6 2 4 0 HI-USE NO-USE HI-USE NO-USE 3 LOW DOM 2 1 6 0 NO-USE HI-USE HI-USE NO-USE 4 HIGH DOM 6 4 4 1 HI-USE HI-USE HI-USE NO-USE 5 HIGH INT 4 5 4 0 LO-USE HI-USE HI-USE NO-USE 4 HIGH INT