Congo ontvangt jaarlijks ruim 2 miljard euro
•
1 like•804 views

Congo ontvangt jaarlijks ruim 2 miljard.
Recommended

Recommended
More Related Content
Similar to Congo ontvangt jaarlijks ruim 2 miljard euro
Similar to Congo ontvangt jaarlijks ruim 2 miljard euro (20)
More from Thierry Debels
More from Thierry Debels (20)
Recently uploaded
Recently uploaded (20)
Congo ontvangt jaarlijks ruim 2 miljard euro
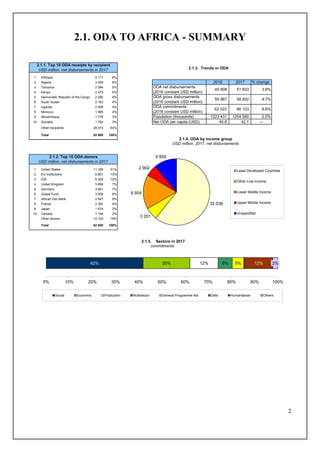
- 1. 2 2.1. ODA TO AFRICA - SUMMARY 1 Ethiopia 4 117 8% 2 Nigeria 3 359 6% 2016 2017 % change 3 Tanzania 2 584 5% 4 Kenya 2 475 5% 5 Democratic Republic of the Congo 2 280 4% 6 South Sudan 2 183 4% 7 Uganda 2 008 4% 8 Morocco 1 885 4% 9 Mozambique 1 776 3% Population (thousands) 1223 431 1254 590 2.5% 10 Somalia 1 760 3% Net ODA per capita (USD) 40.8 42.1 Other recipients 28 373 54% Total 52 800 100% 1 United States 11 190 21% 2 EU Institutions 6 851 13% 3 IDA 6 326 12% 4 United Kingdom 3 858 7% 5 Germany 3 691 7% 6 Global Fund 3 059 6% 7 African Dev.Bank 2 547 5% 8 France 2 362 4% 9 Japan 1 674 3% 10 Canada 1 140 2% Other donors 10 103 19% Total 52 800 100% 4.7% 49 908 51 833 3.9% ODA commitments (2016 constant USD million) 62 022 66 103 6.6% ODA gross disbursements (2016 constant USD million) 55 967 58 602 2.1.5. Sectors in 2017 commitments 2.1.1. Top 10 ODA receipts by recipient 2.1.2. Top 10 ODA donors USD million, net disbursements in 2017 USD million, net disbursements in 2017 ODA net disbursements (2016 constant USD million) 2.1.3. Trends in ODA 2.1.4. ODA by income group USD million, 2017, net disbursements 42% 20% 12% 6% 5% 12% 2% 0% 10% 20% 30% 40% 50% 60% 70% 80% 90% 100% Social Economic Production Multisector General Programme Aid Debt Humanitarian Others 32 038 3 201 8 804 2 902 5 855 Least Developed Countries Other Low Income Lower Middle Income Upper Middle Income Unspecified