Nehal Farouk (CAPMAS) • 2019 IFPRI Egypt - NNC Seminar: "the 100 million heal...
AU Scorecard - FINAL (English)
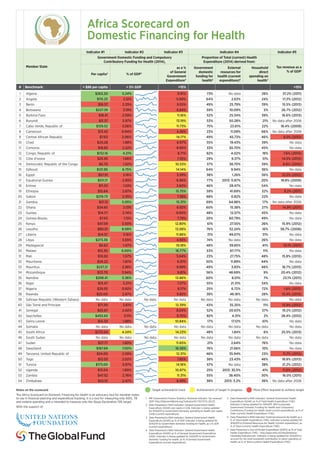
1. Member State
Indicator #1 Indicator #2 Indicator #3 Indicator #4 Indicator #5
Government Domestic Funding and Compulsory
Contributory Funding for Health (2014),
Proportion of Total (current) Health
Expenditure (2014) derived from:
Tax revenue as a
% of GDP1
Per capita2
% of GDP3
as a %
of General
Government
Expenditure4
Government
domestic
funding for
health5
External
resources for
health (current
expenditure)6
Household
direct
spending on
health7
# Benchmark: > $86 per capita > 5% GDP >15% >15%
1 Algeria $263.20 5.24% 9.91% 73% No data 26% 37.2% (2011)
2 Angola $115.25 2.12% 5.00% 64% 2.63% 24% 17.3% (2012)
3 Benin $18.57 2.25% 9.55% 49% 25.79% 39% 15.5% (2013)
4 Botswana $227.39 3.19% 8.84% 59% 10.09% 5% 26.7% (2012)
5 Burkina Faso $18.41 2.59% 11.16% 52% 25.34% 39% 16.6% (2013)
6 Burundi $11.37 3.97% 13.19% 53% 50.28% 21% No data after 2006
7 Cabo Verde, Republic of $129.52 3.56% 11.73% 75% 23.61% 22% 18.4% (2009)
8 Cameroon $13.42 0.94% 4.26% 23% 11.09% 66% No data after 2006
9 Central African Republic $7.63 2.06% 14.17% 49% 45.73% 46% 9.5% (2012)
10 Chad $20.28 1.98% 8.97% 55% 19.43% 39% No data
11 Comoros $18.65 2.22% 8.66% 33% 30.70% 45% No data
12 Congo, Republic of $132.16 4.21% 8.71% 82% 4.02% 18% 7.6% (2010)
13 Côte d'Ivoire $25.95 1.68% 7.35% 29% 9.37% 51% 14.5% (2013)
14 Democratic Republic of the Congo $6.70 1.52% 10.53% 37% 38.70% 39% 8.8% (2010)
15 Djibouti $121.85 6.75% 14.14% 64% 9.94% 36% No data
16 Egypt $67.91 2.16% 5.59% 38% 1.26% 56% 12.5% (2012)
17 Equatorial Guinea $511.17 2.93% 6.96% 77% 2013: 0.87% 20% 18.8% (2009)
18 Eritrea $11.53 1.53% 3.60% 46% 28.47% 54% No data
19 Ethiopia $15.64 2.87% 15.75% 59% 41.69% 32% 9.2% (2011)
20 Gabon $219.73 2.35% 7.38% 68% 0.82% 22% No data
21 Gambia $21.12 5.05% 15.31% 69% 64.88% 17% No data after 2006
22 Ghana $34.65 2.13% 6.82% 60% 15.38% 27% 14.9% (2011)
23 Guinea $14.77 2.74% 9.00% 48% 12.57% 45% No data
24 Guinea-Bissau $7.63 1.15% 7.79% 20% 60.79% 49% No data
25 Kenya $47.59 3.50% 12.80% 61% 27.55% 26% 15.9% (2012)
26 Lesotho $80.01 8.08% 13.08% 76% 52.24% 16% 58.7% (2008)
27 Liberia $14.57 3.16% 11.86% 31% 49.07% 31% No data
28 Libya $273.36 3.65% 4.93% 74% No data 26% No data
29 Madagascar $6.62 1.47% 10.18% 48% 39.85% 41% 10.1% (2011)
30 Malawi $15.30 6.00% 16.77% 53% 87.77% 11% No data
31 Mali $10.92 1.57% 5.64% 23% 27.75% 48% 15.8% (2013)
32 Mauritania $24.22 1.87% 6.01% 50% 11.89% 44% No data
33 Mauritius $237.21 2.36% 9.99% 49% 3.83% 46% 18.7% (2013)
34 Mozambique $23.70 3.94% 8.81% 56% 48.69% 9% 20.4% (2012)
35 Namibia $299.41 5.36% 13.86% 60% 8.01% 7% 23.1% (2011)
36 Niger $13.47 3.21% 7.57% 55% 21.31% 34% No data
37 Nigeria $29.55 0.92% 8.17% 25% 6.72% 72% 1.6% (2012)
38 Rwanda $20.00 2.87% 9.85% 38% 46.18% 28% 13.4% (2013)
39 Sahrawi Republic (Western Sahara) No data No data No data No data No data No data No data No data
40 São Tomé and Príncipe $71.59 3.61% 12.39% 43% 35.35% 11% 13.9% (2012)
41 Senegal $25.67 2.42% 8.04% 52% 20.63% 37% 19.2% (2012)
42 Seychelles $455.63 3.11% 9.70% 92% 4.31% 2% 28.4% (2012)
43 Sierra Leone $14.59 1.88% 10.84% 17% 17.12% 61% No data
44 Somalia No data No data No data No data No data No data No data No data
45 South Africa $275.04 4.24% 14.23% 48% 1.84% 6% 25.5% (2013)
46 South Sudan No data No data No data No data No data No data No data No data
47 Sudan $27.77 1.80% 11.65% 21% 2.64% 76% No data
48 Swaziland $187.69 7.00% 16.58% 76% 21.66% 10% No data
49 Tanzania, United Republic of $24.00 2.59% 12.31% 46% 35.94% 23% 11.7% (2012)
50 Togo $13.03 2.02% 7.85% 38% 23.43% 46% 18.8% (2013)
51 Tunisia $173.00 3.97% 14.16% 57% No data 38% 21.2% (2012)
52 Uganda $13.04 1.80% 10.97% 25% 2013: 35.5% 41% 11.0% (2012)
53 Zambia $47.52 2.76% 11.31% 55% 38.40% 30% 16.0% (2011)
54 Zimbabwe $22.10 2.47% 8.49% 38% 2013: 3.2% 36% No data after 2006
Africa Scorecard on
Domestic Financing for Health
1 IMF Government Finance Statistics Yearbook indicator: Tax revenue/
GDP: http://data.worldbank.org/indicator/GC.TAX.TOTL.GD.ZS
2 Data Presented is NHA Indicator: General Government Health
Expenditure (GGHE) per capita in US$. Indicator is being updated
for SHA2011 to Government domestic spending on health, per capita
(US$) (current expenditure).
3 Data Presented is NHA Indicator: General Government Health
Expenditure (GGHE) as % of GDP. Indicator is being updated for
SHA2011 to Government domestic funding for health, as a % GDP
(current expenditure).
4 Data Presented is NHA Indicator: General Government Health
Expenditure (GGHE) as % of General Government Expenditure
(GGE). Indicator is being updated for SHA2011 to Government
domestic funding for health, as % of General Government
Expenditure (current expenditure).
5 Data Presented is NHA Indicator: General Government Health
Expenditure (GGHE) as % of Total Health Expenditure (THE).
Indicator is being updated for SHA2011. Will incorporate
Government Domestic Funding for Health and Compulsory
Contributory Funding for Health (both current expenditure), as % of
Total (current) Health Expenditure (THE).
6 Data Presented is NHA indicator: External resources for health as a
% of Total Health Expenditure (THE). Indicator is being updated for
SHA2011 to External Resources for Health (current expenditure), as
% of Total (current) Health Expenditure (THE).
7 Data Presented is Out-of-Pocket Expenditure (OOPS) as % of Total
Health Expenditure (THE) - http://apps.who.int/nha/database/
ViewData/Indicators/en. Indicator is being updated for SHA2011 to
account for the total household contribution to direct spending on
health, as % of Total (current) Health Expenditure (THE).
Notes on the scorecard:
The Africa Scorecard on Domestic Financing for Health is an advocacy tool for member states
to use in financial planning and expenditure tracking. It is a tool for measuring only AIDS, TB
and malaria spending and is intended to measure only the Abuja Declaration 15% target.
With the support of:
Target achieved/on track Achievement of target in progress More effort required to achieve target